1
1
N
i
i
B
x
N
«Be Greater Than Average»
Kennedy Space Center
to all the people
who believed in me
University of Messina
Department of Engineering
PhD in Engineering and Chemistry of Materials
and Constructions
Experimental and numerical study
on bond behavior in composite
materials and strengthening systems
PhD student
SantiURSO
Tutor
Prof.ssa Chiara Borsellino
Co-tutor
Prof. Ing. Antonino Recupero
Co-tutor
Prof. Qingda Yang
Acknowledgments
The author gratefully acknowledges Prof.ssa Chiara Borsellino and Prof.
Antonino Recupero (University of Messina) for giving him the opportunity to work
on this topic during his PhD studies.
The author would like to thank Prof. Antonio Nanni and Prof. Qingda
Yang (University of Miami) for their priceless guidance and for giving him the
opportunity to perform the experimental work at University of Miami.
The author would like to express his appreciation to Ruredil S.p.A. of San
Donato Milanese, Italy, for providing the composite materials for the experimental
Index of Contents
Index of Contents ... i
Index of Figures ... v
Index of Tables ... xi
Summary ... 1
Chapter 1. Adhesive joints: an overview ... 3
1.1 General aspects ... 3
1.2 Why to use adhesive joints ... 4
1.3 Adhesive types ... 5
1.4 Joint geometry and design criteria ... 7
1.4.1 Joint design criteria ... 8
1.4.2 Failure type ... 10
1.5 Cohesive Zone Model ... 10
Chapter 2. Experimental tests on adhesive joints ... 13
2.1 Compatibility and temperature effect on hybrid bonded joints made of glass-aluminum and glass-GFRP ... 14
2.1.1 Materials and methods ... 15
2.1.2 Test set up and test program ... 19
2.1.3 Results and discussion ... 20
2.1.4 Discussion ... 30
2.2 Compatibility and temperature effect on hybrid painted bonded joints made of glass-aluminum ... 31
2.2.1 Materials and methods ... 31
2.2.2 Test set up and test program ... 34
2.2.3 Results and discussion ... 34
2.3 Tensile test on dog-bone specimens ... 36
Chapter 3. FEM Models on adhesive joints ... 41
3.1 Numerical model of the adhesive joint in a Tensegrity floor ... 41
3.1.1 Experimental test ... 41
3.1.2 Numerical model ... 44
Chapter 4. Strengthening systems with composite materials ... 49
4.1 Strengthening systems with externally bonded composite materials ... 49
4.2 Fabric Reinforced Cementitious Matrix ... 51
4.2.1 Design of FRCM strengthening ... 52
4.3 Research on strengthening systems with composite material: temperature and moisture influence ... 53
4.4 Numerical models on FRCM strengthening system ... 55
Chapter 5. Experimental tests on FRCM/FRP strengthening systems ... 57
5.1 Introduction ... 57 5.2 Experimental campaign ... 60 5.2.1 Materials ... 60 5.2.2 Specimens preparation ... 63 5.2.4 Environmental conditioning ... 67 5.3 Experimental results ... 68
5.3.1 Force-displacement curves and failure modes of beams with PBO-FRCM system ... 68
5.3.2 Force-displacement curves and failure modes of beams with CFRP system... 71
5.4.1 Interpretation of the force-displacement curve in the PBO-FRCM
system ... 74
5.4.2 Indirect method to evaluate the interfacial stress-slip curve for FRCM system ... 79
5.4.2 Influence of environmental conditioning on the CFRP system ... 82
5.5 Conclusion... 84
Chapter 6. FEM Models of FRCM ... 87
6.1 2D Finite Element model using Augmented-FEM ... 87
6.1.1 Introduction ... 87
6.1.2 Augmented Finite Element Method (A-FEM) ... 90
6.1.3 Assumptions and simplifications ... 92
6.1.4 Numerical and experimental results of direct tensile ... 98
6.1.5 Parametric study and comparison ... 100
6.1.6 Single-lap shear test (SLS) ... 103
6.1.7 Results of single-lap shear test model ... 103
6.1.8 Conclusion ... 105
6.2 3D Finite Element model using Augmented-FEM ... 106
6.2.1 Introduction ... 106
6.2.2 Assumptions and simplifications ... 106
6.2.3 Calibration of a new cohesive law ... 112
6.2.4 Comparison with experimental results (SLS) ... 118
6.2.5 Discussion and conclusion ... 121
Conclusions ... 123
Index of Figures
Figure 1.1 Adhesive classification ... 6
Figure 1.2 Most common configurations of adhesive joints ... 8
Figure 1.3 Loading condition for adhesive joints ... 8
Figure 1.4 Tensile force on lap joint showing (a) unloaded joint, (b) joint under stress, and (c) stress distribution in adhesive. ... 9
Figure 1.5 Failure type: (a) adhesive failure; (b) cohesive failure; (c) mixed failure. ... 10
Figure 1.6 Different cohesive laws ... 11
Figure 2.1 Double-lap specimens geometry ... 18
Figure 2.2 a)Testing machine; b) Specimen positioning. ... 19
Figure 2.3 Representative load-displacement curves of glass-aluminum double-lap specimens, bonded with three epoxy adhesives (a), and three acrylic adhesives (b). ... 21
Figure 2.4 Representative load-displacement curves of glass-GFRP double-lap specimens, bonded with three epoxy adhesives (a), and three acrylic adhesives (b). ... 22
Figure 2.5 Comparison between mechanical trends at different temperatures of glass-aluminum adhesive joints. ... 24
Figure 2.6 Comparison between mechanical trends at different temperatures of glass-GFRP adhesive joints. ... 25
Figure 2.7 Percentage reduction of the maximum carried load of the aluminum/glass double lap joint at high temperatures: a) Tw and b)Tm ... 25
Figure 2.8 Percentage reduction of the maximum carried load of the GFRP/glass double lap joint at high temperatures: a) Tw and b)Tm... 26
Figure 2.9 Failure modes of glass-GFRP/aluminum double lap joints: adhesive failure. ... 27
Figure 2.10 Failure modes of glass-GFRP/aluminum double lap joints: cohesive failure. ... 27
Figure 2.11 Failure modes of glass-GFRP/aluminum double lap joints: light-fiber-tear failure. ... 28
Figure 2.12 Failure modes of glass-GFRP/aluminum double lap joints: mixed
failure. ... 28
Figure 2.13 Comparison between mechanical trends at different temperatures of two combinations: (a) glossy painted glass: (b) glossy aluminum-transparent glass. ... 35
Figure 2.14 Test specimen, adapted from UNI EN ISO 527-2. ... 36
Figure 2.15 Stress strain curve of dog-bone specimens at environmental temperature ... 37
Figure 2.16 Stress strain curve of dog-bone specimens at work temperature ( Tw=50 °C) ... 37
Figure 2.17 Stress strain curve of dog-bone specimens at maximum service temperature (Tm=80°C) ... 37
Figure 2.18 Comparison on stress-strain characteristic curve at the three test temperatures ... 39
Figure 2.19 Typical failure mode of tensile test on dog-bone specimen ... 40
Figure 3.1 Geometric configuration of the hybrid system [mm] ... 42
Figure 3.2 Cyclic load for flexural test ... 42
Figure 3.3 Flexural test: a) test set-up; b) static model; c) transducers position . 43 Figure 3.4 FEM model ... 44
Figure 3.5 Mesh configuration: a) whole system; b) particular of the meshed joint ... 45
Figure 3.6 Displacement color map ... 46
Figure 3.7 Stress map of whole system ... 47
Figure 4.1 Example of FRP strengthening applied on a concrete substrate ... 50
Figure 4.2 Example of FRCM application ... 52
Figure 4.3 Direct tensile test setup per AC434... 53
Figure 4.4 Variation of Modulus E with Temperature ... 54
Figure 4.5 3D numerical model for direct tensile test according to AC434 ... 55
Figure 5.1 Representative carbon sheet and PBO grid used in the experimental campaign ... 62
Figure 5.2 Curing process of the specimens: a) after demolding; b) wrapping of specimens to prevent evaporation of water during the 28 days curing time ... 63 Figure 5.3 Specimen dimensions according to ASTM D7958/D7958M (2017) regulations (dimensions in mm): a) front view; b) bottom view ... 64 Figure 5.4 Preparation of concrete beams before application of the strengthening system ... 64 Figure 5.5 Application of FRP system: a) application of primer; b) application of first layer of resin; c) application of carbon fabric; d) application of second layer of resin ... 65 Figure 5.6 Application of the FRCM system: a) wet of bonding area; b) application of first layer of mortar; c) application of PBO grid; d) application of second layer of mortar ... 66 Figure 5.7 Test setup: a) front view of the specimen in three-point bending test configuration; b) details of the LVDT for the deflection measurement ... 67 Figure 5.8 Layout of the environmental conditioning phase in curing tank at controlled temperature ... 67 Figure 5.9 Force-displacement curves of non-conditioned beam specimens with PBO-FRCM system ... 69 Figure 5.10 Force-displacement curves of beam specimens with PBO-FRCM system conditioned at temperature Tw=30°C ... 69 Figure 5.11 Force-displacement curves of beam specimens with PBO-FRCM system conditioned at temperature Tc=50°C ... 70 Figure 5.12 Typical failure of PBO-FRCM strengthened beams with significant elongation of the PBO fibers and mortar keeping attached to the concrete substrate... 71 Figure 5.13 Force-displacement curves of non-conditioned beam specimens with CFRP system ... 72 Figure 5.14 Force-displacement curves of beam specimens with CFRP system conditioned at temperature Tw=30°C ... 72 Figure 5.15 Force-displacement curves of beam specimens with CFRP system conditioned at temperature Tc=50°C ... 73 Figure 5.16 Typical failure of CFRP-strengthened beams with adhesive failure for Tc=50°C conditioning, and adhesive failure accompanied by partial concrete detachment for nc and Tw=30°C conditioning ... 74 Figure 5.17 Representative Force-displacement curve of notched beam specimens ... 75 Figure 5.18 Distribution of strains and stresses in the mid-span cross-section of the beam for identification of load level of point A ... 76
Figure 5.19 Influence of the environmental conditioning on the first peak load FA (left) and on the second peak load Fc (right) of the Force-displacement curve
of beams with PBO-FRCM system ... 79
Figure 5.20 Analysis of right-body motion of the PBO-FRCM strengthened beam and evaluation of rotation angle for the determination of the stress-global slip curve of the bond behavior ... 80
Figure 5.21 Stress-global slip curve obtained by processing the force-displacement results of the notched beam test setup for FRCM_nc_1 specimen ... 82
Figure 5.22 Influence of the environmental conditioning on the peak load (Fmax) of the Force-displacement curve of CFRP-strengthened beams ... 83
Figure 6.1 Direct tensile test setup configuration according to AC434... 88
Figure 6.2 Single-lap Shear test setup configuration according to Rilem ... 89
Figure 6.3 Six different failure mode for Single-Lap Shear test ... 90
Figure 6.4 Illustration of an element from (a) a regular element, to (b) an A-FE with two quadrilateral domains, or to (c) an A-FE with one triangular sub-domain and one pentagonal sub-sub-domain ... 91
Figure 6.5 Real cross-section of sample for direct tensile test [mm], (b) Homogenized model geometry ... 93
Figure 6.6 (a) Top view of the fabric mortar geometry, (b) detail of contribution of mortar within and fabric ... 93
Figure 6.7 Single layer specimen for direct tensile test [mm] according to AC434 ... 94
Figure 6.8 Mesh size of different elements [mm] – schematic figure ... 94
Figure 6.9 boundary and conditions for direct tension simulation ... 95
Figure 6.10 Shape of fracture laws for Mode I and Mode II ... 96
Figure 6.11 Cohesive traction-separation law ... 97
Figure 6.12 Cohesive laws ... 98
Figure 6.13 Numerical stress-strain curve ... 99
Figure 6.14 Experimental results: a) one layer, b) two layers, c) three layers .... 100
Figure 6.15 Comparison of stress-strain curves with different cracks number 101 Figure 6.16 Comparison between experimental and numerical results (DT) – a) one ply model, b) two plies model, c) three plies model ... 102
Figure 6.18 Comparison between 2D numerical and experimental results (SLS)
... 104
Figure 6.19 Theoretical curve that describe bond mechanism ... 104
Figure 6.20 Evolution of bond length ... 105
Figure 6.21 Schematic representation of elements of the models ... 107
Figure 6.22 Element illustration for (a) a regular 4-node tetrahedron element with two possible different crack planes; (b) an A-FE with a tetrahedron and a wedge sub-domains; (c) an A-FE with two wedge sub-domains. ... 108
Figure 6.23 Building of a brick element through six tetrahedron elements ... 109
Figure 6.24 Mortar layers ... 109
Figure 6.25 Fabric yarns ... 110
Figure 6.26 “Link-cohesive elements” ... 110
Figure 6.27 Cohesive laws for (a) (matrix) shear damage mode; (b) fiber tensile rupture/compressive kinking damage mode; (c) matrix tension/compression damage mode. ... 111
Figure 6.28 Cohesive law proposed by D’Antino et al. (2018) ... 112
Figure 6.29 Comparison between numerical and experimental results (DT) ... 113
Figure 6.30 Cohesive laws with τ=0.6 - parametric study on the stiffness of the first branch (k1) ... 114
Figure 6.31 Comparison between numerical and experimental results (DT), first parametric study (τ=0.6) ... 114
Figure 6.32 Cohesive laws with τ=0.5 - parametric study on the stiffness of the first branch ... 115
Figure 6.33 Comparison between numerical and experimental results (DT), second parametric study (τ1=0.5) ... 115
Figure 6.34 Cohesive laws with τ1=0.7 - parametric study on the stiffness of the first branch ... 116
Figure 6.35 Comparison between numerical and experimental results (DT), third parametric study (τ1=0.7) ... 116
Figure 6.36 Cohesive laws with τ1=0.6 and τ2=0.06 - parametric study on the stiffness of the second branch ... 117
Figure 6.37 Comparison between numerical and experimental results (DT), third parametric study (τ1=0.6) ... 117
Figure 6.38 Comparison between three different cohesive laws with fixed first branch stiffness and varying τ1 (0.5, 0.6 and 0.7) ... 118
Figure 6.39 Comparison between numerical and experimental results (DT), (τ1=0.5, 0.6 and 0.7), ... 118 Figure 6.40 A-FEM configuration of the SLS test set up ... 119 Figure 6.41 Comparison between 3D numerical and experimental results (SLS) ... 119 Figure 6.42 Evolution of bond length ... 120
Index of Tables
Table 2.I Nomenclature ... 15
Table 2.II Glass mechanical properties according to manufacture' s data sheet 16 Table 2.III Aluminum mechanical properties according to manufacture' s data sheet ... 16
Table 2 IV GFRP mechanical properties according to manufacture' s data sheet ... 16
Table 2.V Technical and mechanical characteristics of the adhesives reported by manufacturers ... 17
Table 2.VI Test program ... 20
Table 2.VII Mechanical properties of the glass-aluminum double-lap specimens ... 21
Table 2.VIII Mechanical properties of the glass-GFRP double-lap specimens. 21 Table 2.IX Mechanical properties of the glass-aluminum double-lap specimens at high temperatures... 23
Table 2.X Mechanical properties of the glass-GFRP double-lap specimens at high temperatures. ... 23
Table 2.XI Failure modes of aluminum-glass double lap joints ... 29
Table 2.XII Failure modes of GFRP-glass double lap joints ... 30
Table 2.XIII Glass mechanical properties according to manufacturer’s data sheet ... 32
Table 2.XIV Aluminum mechanical properties according to manufacturer’s data sheet ... 32
Table 2.XV Typical uncured physical properties ... 32
Table 2.XVI Typical cured thermal properties ... 33
Table 2.XVII Test program ... 34
Table 2.XVIII Mechanical properties of the double-lap specimens at three temperatures. ... 34
Table 2.XIX Stiffness of the double-lap specimens at three temperatures. ... 35
Table 2.XX Different test specimens, adapted from UNI EN ISO 527-2. ... 36
Table 2.XXII Young Modules of adhesive EPX4 ... 38
Table 3.I Glass and steel properties according to manufacturer's data sheet ... 44
Table 3.II Data of mechanical properties in tensile test of the adhesives ... 46
Table 3.III Displacement of hybrid samples, experimental and FEM results .... 46
Table 5.I Concrete compressive strength ... 61
Table 5.II Concrete flexural strength ... 61
Table 5.III Mechanical properties of mortar used in the PBO-FRCM system .. 61
Table 5.IV Mechanical and geometrical properties of the PBO-FRCM grid system ... 62
Table 5.V Mechanical properties of primer and epoxy used in the CFRP system ... 62
Table 5.VI Mechanical properties of CFRP system ... 62
Table 5.VII Test program ... 68
Table 5.VIII Experimental results of three-point bending tests on beams with PBO-FRCM system ... 79
Table 5.IX Experimental results of three-point bending tests on beams with CFRP system ... 83
Table 6.I Mechanical properties of PBO fabric and mortar ... 95
Table 6.II Fracture properties of mortar ... 95
Table 6.III Mortar fracture parameters ... 97
Summary
The mechanism of stress transfer across different materials bonded each other is one of the most discussed topic in research field. Different approaches can be used in order to study this topic: analytical approach, experimental approach and numerical approach.
In this thesis these approaches are applied in order to study the bonding mechanism in various engineering field.
In the first part, the attention is focused on adhesive joints for mechanical application in which aluminum, GFRP and glass materials are used. Two experimental campaigns are performed in order to evaluate the mechanical performances of double-lap joints using different type of adhesives and adherends. The influence of temperature on joint performances is also studied and results show the strong influence of this parameter on the mechanical strength of the adhesive joint.
In a third experimental study, the mechanical performance of the adhesive joints in a steel-glass connection is investigated. The aim of part is to verify the applicability of the adhesive bonds on a tensegrity floor; that is a hybrid system characterized by a particular steel-glass adhesive junction that permits an effective cooperation between the two structural elements (a glass panel and a steel subframe). Experimental tests on hybrid system are performed with a stepwise cyclic loading and a numerical validation of the whole system is done through a Finite Element Model of the tested samples.
The second part of the dissertation is focused on new strengthening systems for civil application. In the last few decades, the construction industry has had a rapid expansion of interest regarding strengthening and retrofitting of existing reinforced concrete (RC) and masonry structures. In fact, new strengthening systems for existing structures were investigated e optimized in terms of efficiency, easy application, durability and cost.
Externally bonded composite materials, FRP (Fiber Reinforced Polymer) and FRCM (Fabric Reinforced Cementitious System), are studied in this section. The bond behavior between composite system and concrete substrate is investigated. An experimental campaign on strengthened beams with FRP (carbon sheet fibers) and FRCM (PBO fabric) applied at different environmental
conditions are conducted in order to study the durability problems. Results, in term of force-displacement curve, are interpreted with an analytical approach.
Finally, numerical models on FRCM system are carried out in order to develop a tool aimed to the optimization of the system. Augmented-FEs are implemented in numerical codes and used for 2D and 3D models. Tensile behavior of FRCM coupon is numerically simulated in all three stages of its characteristic behavior. Results of this study show a good agreement with experimental ones.
The last part is focused on developing a new cohesive law, calibrated on experimental results, for 3D models of FRCM system. Parametric studies are conducted and then the proposed approach is validated by modeling different test setup.
Chapter
1
Adhesive joints: an overview
The main aim of this Chapter is to give general, preliminary definitions that may be useful in reading this thesis. Different type of adhesives, their failure mode and analysis methods are following described. The concept is to introduce the problem of bonding between different materials in the field of mechanical application but they have found application also in other different field like civil application.
1.1 General aspects
The gluing technique allows to connect permanently two different substrates, joined by an adhesive. The adhesive is defined as a non-metallic material, capable of connecting different materials by surface fixation (adhesion) in order to obtain a joint that has enough internal strength (cohesion).
In the cohesion zone, the adhesive is present in its normal state. In the adhesion zone, the adhesive has a modified structure and composition due to adhesion to the substrate surfaces. The structure and composition are different from those found in the cohesion area. As a consequence, also the macroscopic properties of the adhesive in the adhesion zone will be different.
In the transition zone, between the adhesion and cohesion areas, the structure, composition and macroscopic properties of the adhesive continuously change.
Adhesion zone
The adhesive has a modified molecular structure in the adhesion zone due to the bonding on the substrate surface. The adhesion phenomenon is caused by the molecular interactions between the substrate surface and the adhesive.
Chemical bonds are formed, however, only in the presence of very few substrate/adhesive combinations. It has been shown for some of these glued
joints that chemical bonds account for up to 50% of all interactions. The long-term stability of these bonds depends directly on their resistance to moisture.
Nevertheless, in addition to the chemical and intermolecular adhesion forces, also the bonding mechanism called "micromechanical adhesion" can have effects, depending on the morphology of the substrate surface. In general, "micromechanical adhesion" is considered of secondary importance. However, if there are regular interstices on the substrate - possibly created for design reasons - in which the adhesive penetrates, the joint strength is increased.
Transition zone
The transition zone, in which the chemical, mechanical and optical properties of the adhesive are altered, has a variable thickness, from some nanometers up to some millimeter extensions. The thickness depends on the nature of the substrate surface, the adhesive and the hardening conditions. If large transition zones or thin glued joints are present, the behavior of the entire glued joint may depend on the properties of the transition zone since in this case there is no cohesion zone.
Cohesive zone
In the cohesion area, the adhesive has the nominal properties shown in the data sheet. These properties depend on the following molecular forces:
• Molecular bonds within polymers;
• Chemical bonds deriving from polymer cross-linking;
• Intermolecular interactions between molecules in the adhesive; • Mechanical fastening between various molecules in the adhesive. Just like in a chain, the weakest link in a glued joint determines which loads the joint can withstand.
1.2 Why to use adhesive joints
As discussed in the previous parts, adhesive bonding is a useful technique because has many advantages:
• uniform distribution of stress and largest stress-bearing area; • allow to join materials of any shape, similar and dissimilar; • resist fatigue and cyclic loads;
• seal joints against a variety of environments;
• insulate against heat transfer and electrical conductance;
• the heat required to set the joint is usually too low to reduce the strength of the metal parts;
• dampen vibration and absorb shock;
• quicker and/or cheaper to form than mechanical fastening. Clearly there are also many disadvantages:
• the bond doesn’t permit visual examination of the bond area; • careful surface preparation is required to obtain durable bonds; • exposure to solvents used in cleaning or solvent cementing may
present health problems;
• the useful life of the adhesive joint depends on the environment to which it is exposed;
The basic requirements for a good adhesive bond are: • proper choice of adhesive;
• good joint design;
• cleanliness of surfaces: wetting of surfaces that are to be bonded together;
• proper adhesive bonding process (solidification and cure). 1.3 Adhesive types
All the most popular adhesives can be classified according to their chemical composition, source, function and physical form, as summarized in Figure 1.1.In particular:
• Natural adhesives, including materials of animal or vegetable origin; • Thermoplastic adhesives, including natural and synthetic resins; • Thermosetting adhesives, based on synthetic polymers;
• Elastomeric adhesives, including rubber-like materials of natural or synthetic origin;
• Biopolymer adhesives, generally consisting of elements of previous categories
Figure 1.1 Adhesive classification
Natural adhesives
They are the simplest, commonly used and they resulting from animals and plants. They are characterized by a good resistance to heat and to chemical agents, on the contrary, to a poor resistance to moisture. They can be used only for paper bonding and industrial packaging.
Thermoplastic adhesives
Thermoplastic resins are linear or branched polymers that can be melted due to an appropriate amount of heat, as well as at high temperature they are subject to softening, instead under tension they are subjected to viscous sliding. They can be forged and re-forged in any form with techniques such as injection molding and extrusion. These polymers, whose fusion is obtained through heat, thanks to a contact with the walls of the mold, solidify for cooling without causing any problem to the performance of the resin. The thermoplastic polymers can be characterized by two different phases: an amorphous phase and a crystalline one. The first is characterized by the glass transition temperature, Tg, the temperature
that marks the transition from a glassy state to a rubbery one. The second one is characterized by a melting temperature, Tm, representative of the passage from an
ordered state, crystalline solid, to a disordered state, liquid.
Thermosetting adhesives
These adhesives solidify by polymerization thanks to the action of the curing agents (first of all heat and chemical catalysts), like thermoplastic adhesives, but,
Natural
Elastomeric
Synthetic
Thermoplastic
Adhesives
Thermosetting
unlike the latter, they cannot be melted and processed after the first cooling, because they would face degradation and decomposition. The thermosetting adhesives produce stronger adhesives than other adhesives and they are therefore more suitable for certain structural components. The properties of viscous sliding and shear strength are good, but the peeling resistance is discreet, furthermore the glues are brittle and have low impact strength.
Elastomeric adhesives
Elastomers, more commonly called "rubbers", are materials capable of undergoing big deformations under the action of relatively small loads, and returning to their original shape once the effort has ended.
1.4 Joint geometry and design criteria
The main aim of adhesive joints is to transfer the load between the structural elements as efficiently as possible and within the safety limits. Bonding often produces joints that are more reliable in operation and cheaper than those made with conventional connections. A safe design must not exceed the strength and durability limits of the adhesive and the structure while maintaining a light and economical configuration, complying with safety standards codes. In order to optimize the performance of a project, general principles have to be followed:
• Stress the adhesive in the direction of maximum resistance; • provide for the maximum bonding area;
• make the adhesive layer as uniform as possible; • maintain a thin and continuous adhesive layer; • avoid stress concentrations.
The importance of the thickness of the adhesive film is in its influence on the resistance of the joint, in fact thin layers demonstrate high shear strength. The most common configurations of a bonded composite-composite or metal-composite joints are (see Figure 1.2):
• single-lap joint; • double-lap joint; • single-strap joint; • double-strap joint; • Scarf joint.
Figure 1.2 Most common configurations of adhesive joints
Is important to know the right stress distribution of the joint in order to obtain a good adhesion and for this reason there are two rules:
• to use the maximum area in order to increase the strength of joint; • to choose the best geometry according to joint design.
An adhesive joint can be subject to different loading condition. There are five different loading condition as shown in Figure 1.3:
a. Compression b. Tension
c. Shear d. Peel
e. Cleavage
Figure 1.3 Loading condition for adhesive joints 1.4.1 Joint design criteria
The bonded area should be large enough to resist the greatest force that the joint will be subjected to in service. The calculation of stress in the adhesive joint is not a reliable way of determining the exact dimensions required. It is relatively
SCARF BEVEL
SINGLE LAP
BUTT STEP
DOUBLE BUTT STRAP
DOUBLE LAP
BUTT STRAP
COMPRESSION TENSION
SHEAR
difficult to decide on an allowable stress. The strength of the bond is affected by environmental conditions, age, temperature of cure, composition and size of adherends, and the thickness of the adhesive layer.
The stress in the adhesive is ordinarily a combination of various stresses, in Figure 1.4 is described the stress distribution in a single lap joint. The relative flexibility of the adhesive to that of the adherends has a pronounced effect on the stress distribution. The greater part of the lap (adjacent to the center) carries a comparatively low stress. Therefore, if the overlap length is doubled, the load-carrying capability of the joint is increased by a relatively low percentage. The greatest gain in strength is obtained by increasing the joint width. Increasing the width of the joint results in a proportionate increase in strength, while increasing the overlap length (L) beyond a certain limit has very little effect.
In addition to overlap length and width, the strength of the lap joint is dependent on the yield strength of the adherend. The modulus and thickness of the adherend determine its yield strength, which should not exceed the joint strength. The yield strength of thin metal adherends can be exceeded where an adhesive with a high tensile strength is employed with a relatively small joint overlap.
Figure 1.4 Tensile force on lap joint showing (a) unloaded joint, (b) joint under stress, and (c) stress distribution in adhesive.
1.4.2 Failure type
When the joint is subjected to a load during destructive tests, the adhesive will separate from the substrate through three types of breakage: adhesive, cohesive and mixed as shown in Figure 1.5.
(a) (b) (c) Figure 1.5 Failure type: (a) adhesive failure; (b) cohesive failure; (c) mixed failure.
Failure mode depends by several variables, like adhesive, substrates, surface preparation, temperature, environmental condition and by the stress distribution among the junction. For this reason, it’s important study the functionality of joints in its configuration by experimental, numerical and analytical approach.
1.5 Cohesive Zone Model
The Cohesive Zone Model (CZM) describes material separation with a traction-separation law and links the micro-structural failure mechanism to the continuum deformation field.
CZM offers an alternative way to assess failure in materials or along material interfaces. It is a phenomenological model instead of an exact physical representation of material behavior in the fracture process zone, where distributed micro-cracking or void formation takes place.
The Cohesive Zone Model (CZM) removes the crack tip singularity and represents physics of the fracture process at the atomic scale. It regards fracture as a gradual phenomenon in which material separation takes place across an extended crack tip (cohesive zone) and is resisted by cohesive forces. A cohesive traction-separation law governs the constitutive behavior of crack opening in addition to the bulk stress-strain relation of surrounding material. No additional criterion is needed for fracture to occur. New crack surfaces are created as a natural result of constitutive evolvement, thus maintaining continuity conditions mathematically despite the physical separation. Furthermore, the CZM is able not only to represent the toughness at the crack tip but also to describe the entire fracture process including crack initiation and propagation. The presence of an initial crack is not essential as is required, instead, by conventional fracture mechanics.
Despite the fact that the CZM is a phenomenological model and does not define the actual physical process of fracture, the validity of the method has been witnessed in various applications. Over the years, the CZM has been successfully applied for studying and rationalizing crack growth simulation in materials spanning the domains of metals, concretes, ceramics, polymers, and their composite counterparts. It has been used to describe micromechanical separation processes such as void growth and nucleation, atomic separation.
Different shapes of cohesive laws are available in literature and implemented in the softwares for FEM analysis as shown in Figure 1.6.
Figure 1.6 Different cohesive laws
Cohesive laws are in important in order to describe interface behavior between adhesive and substrate and they are used in FEM codes. In the FE models herein analyzed, further discussed in the next chapters, cohesive laws were used in order to connect different materials.
Equation Section (Next)
Chapter
2
Experimental tests on adhesive joints
In this Chapter, a series of mechanical tests were conducted on different type of specimens. Tensile tests were done on double-lap joint and tensile test on bone dog specimen. Different types of adhesives (epoxy and acrylic) were compared and three temperature conditions (room temperature, work temperature and maximum service temperature) were investigated.
The first part of the experimental study describes the results of tensile tests conducted in order to verify the compatibility of the bonding system at room temperature, then, the second part illustrates the degradation of the adhesive bonding due to high temperatures.
The results evidenced that the mechanical performance of adhesive junctions is considerably reduced as the temperature increases. This phenomenon is more evident in acrylic adhesives rather than epoxy ones. The highest load carrying capacity was always obtained with the epoxy adhesives, while the acrylic ones showed the highest joint elongations. The different failure modes, observed at room temperature, were classified as:
• Adhesive Failure (AF); • Cohesive Failure (CF);
• Light-Fiber-Tear Failure (LFTF); • Mixed Failure (MF).
At high temperatures, only “adhesive failure” were observed. The experimental campaign demonstrates that high temperatures have a remarkable impact on the mechanical properties of adhesive junctions. Such effect should be taken into account suitably in the design and verification phase of components.
Results of tensile tests on dog-bone specimens have shown that at different test temperatures, mechanical behavior changes not only in terms of reduction of maximum strength but also in terms of different constitutive behavior.
2.1 Compatibility and temperature effect on hybrid bonded joints made of glass-aluminum and glass-GFRP
In the field of civil and mechanical engineering, in the last decades, an increasing interest has been addressed towards new building materials, such as Glass Fiber-Reinforced Polymer (GFRP) (Stazi et al. 2016a), structural adhesives (Stazi et al. 2015), solar control glass coatings (Stazi et al. 2016b) and structural glass. GFRP can be used in alternative to conventional materials in bridges and buildings (Keller 2001), electricity transmission towers (Godat et al. 2013), and windows frames (Appelfeld et al. 2010, Dispenza et al. 2006). Structural glass has been utilized for wall façade system, glass floor (Overend et al. 2011), glass columns and beams (Foraboschi 2007, Bati et al. 2009, Biolzi et al. 2010 and Speranzini & Agnetti 2013). GFRP pultruded profiles present several advantages if compared to traditional materials, for example high specific yield strength, light weight, low electrical and thermal conductivity and non-corrodibility, rapid installation time and low life-cycle costs (Godat et al. 2013, Hollaway 2010 and Wu et al. 2015). At the same time, several factors, like their orthotropic nature (Turvey 2013), the brittleness in bolted connections (de Castro & Keller 2008a and 2008b), and the low elastic modulus if compared to steel (up to ten times lower, see (Wu et al. 2015, Kim & Lee 2012 and Qureshi & Mottram 2013), make impossible to apply GFRP to many applications, especially when concentrated bearing loads are applied (Wu & Bai 2014, Borowicz & Bank 2010 and Turbey & Zhang 2006). Furthermore, the extreme sensitivity of GFRP to fire remains a problem of great complexity. With regard to structural glass joined with other materials, its intrinsic brittle behavior makes the classic bolted connection not suitable, so the adhesive conjunction should be preferred. The new capabilities of adhesives led to the development of hybrid structures composed of glass and steel (Machalická & Eliášová 2017) An extended experimental campaign demonstrated the effectiveness of an adhesive junction between two GFRP profiles (Stazi et al. 2015) and between GFRP profiles and steel (Giampaoli et al. 2017).
However, even if adhesive bonding is suitable to be used for bonding dissimilar materials, it is necessary to consider that these materials may have very different coefficients of thermal expansion (Da Silva 2010 and Marques et al. 2015). This implies that in the design phase of the adhesive joint not only the mechanical acting forces should be taken into account, but also the elements to which it is exposed during service. Mechanical stress, elevated temperatures, and high relative humidity can be a fatal combination for certain adhesives if all occur at the same time. In particular, it is important to consider thermal effects because these generally lead to a joint strength reduction (Apalak et al. 2003, Srivastava
2003, Al-Samhan & Darwish 2005 and Viana et al. 2017) even though in some cases the opposite happens (Da Silva et al. 2004 and San Román 2005). In this first experimental campaign, the mechanical properties of two hybrid adhesive, i.e. glass-aluminum and glass-GFRP are studied.
The first aim of the study is verifying the compatibility of the bonding system at room temperature, through tensile tests on double-lap specimens with different adhesives (three epoxy and three acrylic), in order to select the best product. Then, since different materials with different thermal expansion coefficients are tested, the second aim of the research work is quantifying the decay of the mechanical performances as the temperature rises. To this purpose, further tests were carried on at various temperature conditions, i.e. work temperature and maximum service temperature,
The experimentation demonstrates that high temperatures affect considerably the mechanical properties of hybrid adhesives junctions, the experiments and the outcomes to justify this statement are thoroughly presented and discussed in the following sections.
2.1.1 Materials and methods
In this section, the used materials and the experimental conditions are presented. Table 2.Isummarizes the nomenclature used in this section.
Table 2.I Nomenclature
α Thermal coefficient of expansion ACR1-2-3 First, second and third acrylic adhesive
At Application temperature
EPX1-2-3 First, second and third epoxy adhesive
Et Young modulus in tension
k Stiffness
St Service temperature
Wt Working time at 22 °C
εt Tensile strain
σt Tensile strength
σys Tensile yield strength
τ Shear strength
In order to verify the compatibility and the temperature effect of glass-aluminum/glass-GFRP junctions, tensile tests on adhesively bonded double lap joints were conducted.
Adherends
Three different materials were used in this work, float glass, aluminum, and GFRP. The mechanical properties of the three materials, provided by the manufacturers, are reported in Table 2.II, Table 2.IIIandTable 2 IV.
Table 2.II Glass mechanical properties according to manufacture' s data sheet Glass
α Et σt
[°C-1] [GPa] [MPa]
9x10⁻⁶ 75 40
Table 2.III Aluminum mechanical properties according to manufacture' s data sheet Aluminum profiles
α Et σys σt εt
[°C-1] [GPa] [MPa] [MPa] [%]
23.2x10⁶ 69 250 295 8
Table 2 IV GFRP mechanical properties according to manufacture' s data sheet Gfrp profiles
α Et σt εt
[°C-1] [GPa] [MPa] [%]
11x10-6 26 400 1.5
Notice that the used GFRP profiles are made of pultruded E-glass fiber reinforced vinyl ester composite; this material consists of alternating layers of unidirectional fiber roving and chopped strand mat embedded in vinyl ester matrix. A polyester surface veil is used to protect the matrix against environmental actions.
Adhesives
Nowadays, there is still a lack of guidelines and standards for selecting suitable adhesives to be used in glass-aluminum and/or glass-GFRP joints. For this reason, it’s important investigate the mechanical performance of junction with different nature of adhesives in order to find the best combination and
optimize the it. In this work six different adhesives, from two different manufacturers, three epoxy (EPX) and three acrylic (ACR), were selected, namely:
• 3MTMScotch-Weld™ Epoxy Adhesive 7260 F/C (EPX1);
• Gurit Spabond 340LV (EPX2); • Gurit Spabond 345 (EPX3); • 3MTM VHB TM Tape 4941 (ACR1);
• 3MTM VHB TM Tape 4950 (ACR2);
• 3MTM VHB TM Tape 4991 (ACR3).
The products were chosen following two criteria:
i. the adhesive should be suitable for glass-aluminum/ glass-GFRP connections;
ii. the set of adhesives should be heterogeneous in load capacity, stiffness and thermal coefficient of expansion.
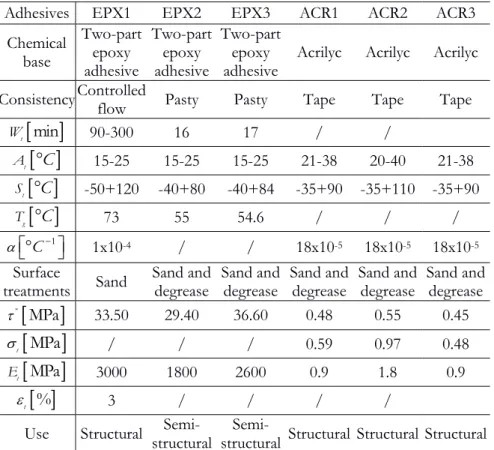
Table 2.Vsummarizes the technical and mechanical characteristics of the selected adhesives reported by manufacturers data sheet.
Table 2.V Technical and mechanical characteristics of the adhesives reported by manufacturers
Adhesives EPX1 EPX2 EPX3 ACR1 ACR2 ACR3
Chemical base Two-part epoxy adhesive Two-part epoxy adhesive Two-part epoxy
adhesive Acrilyc Acrilyc Acrilyc Consistency Controlled flow Pasty Pasty Tape Tape Tape
min t W 90-300 16 17 / /
t A C 15-25 15-25 15-25 21-38 20-40 21-38
t S C -50+120 -40+80 -40+84 -35+90 -35+110 -35+90
g T C 73 55 54.6 / / / 1 C 1x10⁻⁴ / / 18x10-5 18x10-5 18x10-5 Surfacetreatments Sand Sand and degrease Sand and degrease Sand and degrease Sand and degrease Sand and degrease
* MPa 33.50 29.40 36.60 0.48 0.55 0.45
MPa
t / / / 0.59 0.97 0.48
MPa
t E 3000 1800 2600 0.9 1.8 0.9
% t 3 / / / /Experiments
The experimental tests consist in tensile test on adhesively bonded glass-GFRP and glass-aluminum double lap joints. Such tests allow evaluating the compatibility between glass-aluminum and glass-GFRP and comparing the mechanical behavior of the double lap joints bonded with three epoxy and three acrylic adhesives, in terms of their load carrying capacity, displacement, and stiffness. The specimens were manufactured according to ASTM D5573-99(2019); the used geometry is illustrated in Figure 2.1.
Figure 2.1 Double-lap specimens geometry
For each experiment, three repetitions were conducted, therefore three specimens per type of test and adhesive type where produced.
The dimension of the glass panels was 200 x 100 mm, 5 mm thick, while the dimension of the aluminum and GFRP laminates was 25.4 x 140 mm, 5 mm thick. The total overlap length where the adhesive was applied is 25.4 mm, 12.7 in each
side of the double lap joint. Among the three epoxy adhesives, a different bonding thickness (t) was employed as recommended by the manufacturer, i.e. 0.3 mm for EPX1 and 2 mm for EPX2 and EPX3. With regard to the acrylic adhesives, instead, the bonding thickness depends on the tape thickness, i.e. 1.1 mm for ACR1 and ACR2 and 2.3 mm for ACR3.
Since the study is focused on the shear strength of the joint, in the connections zone, the double-lap specimens are separated by a 2 mm interspace, where the adhesive is not present, in order to avoid the connection between the two adherents. All surfaces were cleansed with isopropyl alcohol, furthermore, as recommended by manufacturers, the glass was treated with a silane primer when acrylic adhesives were used, and a primer stick was applied on GFRP/aluminum laminates.
The specimens were manufactured under laboratory conditions (temperature of 18°C, relative humidity of 70%) and cured at room temperature for 23 days, according to specifications.
2.1.2 Test set up and test program
All tests were carried out according to ASTM D3528-16 (2016), under displacements control, with a crosshead speed of 1,27 mm/min. All specimens were loaded up to the joint fracture, identified as a force drop larger than 80% with respect to the maximum one. Figure 2.2 shows the test configuration.
The load was applied at the same rate of 1.27 mm/min used for the previous test and the specimens were again loaded up to the joint failure.
Figure 2.2 a)Testing machine; b) Specimen positioning.
a) b)
As mentioned before, for each type test three repetitions were performed, thus a series of 18 specimens per adhesive type, subdivided according to the temperature conditions, were tested: three at room temperature (T0), three at work
temperature (Tw, namely 50°C) and three at maximum service temperature
(Tm=85°C for EPX and 90°C for ACR) for each of the two adherents.
The test program is summarized in Table 2.VI.It is worth noting that the ACR3 was tested only at room temperature. As further specified, this adhesive showed a poor compatibility in the first test and therefore was accordingly excluded from the following analysis.
Table 2.VI Test program
Adhesives T0 Tw Tm EPX1 3 3 3 EPX2 3 3 3 EPX3 3 3 3 ACR1 3 3 3 ACR2 3 3 3 ACR3 3 - -
2.1.3 Results and discussion
In this section, the load-elongation response and the failure modes of double-lap joints are presented and analyzed, the results are presented in terms of mean value and standard deviation, computed with respect to the three repetitions. The results are subdivided according to the used temperature conditions (T0, Tw and Tm).
Mechanical performances of double-lap joints at laboratory conditions
Tensile tests were conducted on the double lap joints under laboratory conditions (registered temperature 20°C and relative humidity 50%). Table 2.VIIand Table 2.VIII summarize the identified mechanical properties of aluminum and GFRP double-lap specimens, in terms of load carrying capacity (kN), maximum elongation (mm) and stiffness (kN/mm).These parameters are needed for a smart design way in order to allow the maximum workability of the adhesive junction.
Table 2.VII Mechanical properties of the glass-aluminum double-lap specimens
Series
Fmax Displacement* k
[kN] [mm] [kN/mm]
Mean
Value DeviationStandard MeanValue DeviationStandard MeanValue DeviationStandard
EPX1 8.09 2.217 0.14 0.024 74.82 7.244 EPX2 3.93 0.609 0.16 0.041 34.05 3.510 EPX3 3.45 0.775 0.14 0.045 34.05 3.510 ACR1 0.30 0.008 10.41 0.641 0.03 0.364 ACR2 0.30 0.020 7.71 0.274 0.04 1.667 ACR3 0.15 0.021 11.23 1.466 0.01 0.077
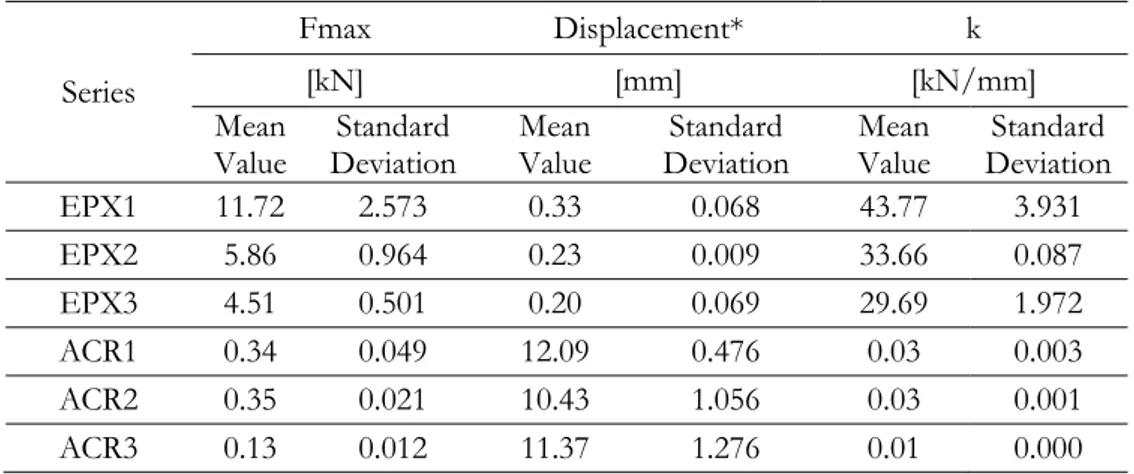
Table 2.VIII Mechanical properties of the glass-GFRP double-lap specimens.
Series
Fmax Displacement* k
[kN] [mm] [kN/mm]
Mean
Value DeviationStandard Mean Value DeviationStandard Mean Value DeviationStandard
EPX1 11.72 2.573 0.33 0.068 43.77 3.931 EPX2 5.86 0.964 0.23 0.009 33.66 0.087 EPX3 4.51 0.501 0.20 0.069 29.69 1.972 ACR1 0.34 0.049 12.09 0.476 0.03 0.003 ACR2 0.35 0.021 10.43 1.056 0.03 0.001 ACR3 0.13 0.012 11.37 1.276 0.01 0.000
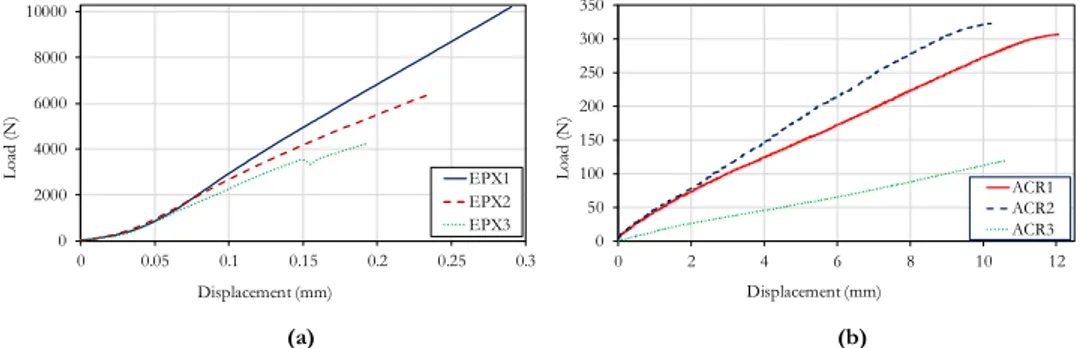
The overall stiffness of the joints was computed through a linear fit of the force-displacement curve, the fitting was limited to the initial part of the curve, before the damage initiation that produces a non-linear behavior. The corresponding load-displacement curves for the three epoxy and acrylic adhesives, are shown in Figure 2.3 and Figure 2.4.
(a) (b)
Figure 2.3 Representative load-displacement curves of glass-aluminum double-lap specimens, bonded with three epoxy adhesives (a), and three acrylic adhesives (b).
0 1500 3000 4500 6000 0 0.025 0.05 0.075 0.1 0.125 0.15 0.175 0.2 Lo ad (N ) Displacement (mm) EPX1 EPX2 EPX3 0 50 100 150 200 250 300 350 0 2 4 6 8 10 12 Lo ad (N ) Displacement (mm) ACR1 ACR2 ACR3
(a) (b)
Figure 2.4 Representative load-displacement curves of glass-GFRP double-lap specimens, bonded with three epoxy adhesives (a), and three acrylic adhesives (b).
The mechanical properties are remarkably different between epoxy and acrylic adhesive. In particular, as shown in Table 2.VIIand Table 2.VIII, epoxy adhesives have much higher load carrying capacity and stiffness, while acrylic adhesives present grater joint elongation. EPX2 and EPX3 had an almost similar behavior in terms of load-joint elongation r and maximum load, while the best performances were achieved by EPX1, which bore the highest load. i.e. 10.51 kN for glass-aluminum and 14.70 kN for glass-GFRP. ACR1 and ACR2 showed mainly the same behavior, while ACR3 resulted in a poor performance with very low maximum load (0.13 kN) and joint stiffness (0,01 kN/mm). For this reason, ACR3 was excluded from the following analysis on high temperatures. Looking at the comparison between epoxy and acrylic adhesives, there is a large difference in terms of stiffness, in particular, the stiffness of epoxy joint is more than 1000 times higher than the corresponding acrylic one. The maximum load is around 10 times higher in epoxy joints while the maximum elongation is 10 times higher in acrylic ones. Therefore, the choice between epoxy or acrylic adhesives depends on the intended purpose of the junctions: if high load carrying capacity is required, epoxy ones should be used, otherwise, if a certain level of deformability is necessary, acrylic ones should be preferred. Furthermore, from the analysis of Figure 2.3 and Figure 2.4, it turns out that epoxy joints are also influenced by the adherent, in particular, glass-GFRP joints have a load carrying capacity around 30-50% higher than the glass-aluminum ones, due to the GFRP higher superficial roughness. This influence is less evident in acrylic joints.
Mechanical performances of double-lap joints at high temperatures
Tensile tests were conducted on the double lap joints at work temperature (Tw =50°C) and at maximum service temperature (Tm=85°C for EPX and 90°C for
ACR), the results are summarized in Table 2.IX and Table 2.X, the same mechanical properties before investigated are listed. All adhesives presented a
0 2000 4000 6000 8000 10000 0 0.05 0.1 0.15 0.2 0.25 0.3 Lo ad (N ) Displacement (mm) EPX1 EPX2 EPX3 0 50 100 150 200 250 300 350 0 2 4 6 8 10 12 Lo ad (N ) Displacement (mm) ACR1 ACR2 ACR3
drastic reduction of the load carrying capacity. EPX1 presented the best behavior by maintaining almost similar stiffness at both temperatures, while the acrylic tapes shown the worst behavior.
The same consideration can be done for both aluminum and GFRP double-lap specimens, meaning that the performance reduction is obviously due only to the adhesive behavior.
Table 2.IX Mechanical properties of the glass-aluminum double-lap specimens at high temperatures.
Series
Test
Temperature Fmax Displacement* k
[°C] [kN] [mm] [kN/mm]
Mean
Value DeviationStandard Mean Value DeviationStandard ValueMean DeviationStandard
EPX1 Tw 3.01 0.746 0.69 0.085 3.98 0.119 Tm 1.18 0.057 0.51 0.009 2.53 0.028 EPX2 Tw 2.96 0.463 0.80 0.085 4.09 0.058 Tm 0.33 0.010 1.29 0.060 0.37 0.032 EPX3 Tw 4.21 0.247 1.28 0.028 3.43 0.022 Tm 0.49 0.014 1.00 0.065 0.51 0.008 ACR1 Tw 0.10 0.025 16.66 3.006 0.01 0.000 Tm 0.03 0.004 5.76 0.913 0.01 0.000 ACR2 Tw 0.14 0.007 15.84 1.516 0.01 0.001 Tm 0.05 0.001 7.60 0.362 0.01 0.000
Table 2.X Mechanical properties of the glass-GFRP double-lap specimens at high temperatures.
Series
Test
Temperature Fmax Displacement* k
[°C] [kN] [mm] [kN/mm]
Mean
Value DeviationStandard Mean Value DeviationStandard ValueMean DeviationStandard
EPX1 Tw 3.95 0.240 1.64 0.226 3.48 0.370 Tm 0.94 0.093 0.40 0.039 2.55 0.155 EPX2 Tw 4.95 0.235 2.04 0.255 2.95 0.439 Tm 0.21 0.030 0.66 0.110 0.26 0.006 EPX3 Tw 6.00 0.951 3.44 0.397 2.55 0.400 Tm 0.55 0.075 1.12 0.130 0.50 0.004 ACR1 Tw 0.16 0.006 19.89 1.691 0.01 0.000 Tm 0.03 0.000 5.56 0.244 0.01 0.001 ACR2 Tw 0.13 0.026 17.62 1.198 0.01 0.000 Tm 0.05 0.002 7.57 0.157 0.01 0.000
The corresponding load-displacement curves for the three epoxy adhesives and for the two acrylic adhesives, are shown in Figure 2.5 and Figure 2.6 where the comparison between the mechanical trends at different temperatures of the tested double-lap joints with aluminum and GFRP supports, respectively, are depicted.
Figure 2.5 Comparison between mechanical trends at different temperatures of glass-aluminum adhesive joints.
It can be evidenced that, for all the adhesives, there is a drastic reduction of the joint stiffness, together with an increment of the joint elongation response. This second plastic branch is correlated to the higher deformability of the adhesive at high test temperature. Figure 2.7 and Figure 2.8 show the percentage reduction of the maximum carried load of the glass-aluminum and glass-GFRP double-lap joints, respectively, with respect to the room temperature performances. 0 1000 2000 3000 4000 5000 6000 7000 0 1 2 3 4 5 L oa d (N ) Displacement (mm) EPX1 T0 Tw Tm 0 1000 2000 3000 4000 5000 0 1 2 3 4 5 6 7 L oa d (N ) Displacement (mm) EPX2 T0 Tw Tm 0 1000 2000 3000 4000 5000 0 1 2 3 4 5 L oa d (N ) Displacement (mm) EPX3 T0 Tw Tm 0 50 100 150 200 250 300 0 5 10 15 20 25 L oa d (N ) Displacement (mm) ACR1 T0 Tw Tm 0 50 100 150 200 250 300 0 5 10 15 20 Lo ad ( N ) Displacement (mm) ACR2 T0 Tw Tm
Figure 2.6 Comparison between mechanical trends at different temperatures of glass-GFRP adhesive joints.
Figure 2.7 Percentage reduction of the maximum carried load of the aluminum/glass double lap joint at high temperatures: a) Tw and b)Tm 0 2000 4000 6000 8000 10000 12000 0 0.5 1 1.5 2 L oa d (N ) Displacement (mm) EPX1 T0 Tw Tm 0 1000 2000 3000 4000 5000 6000 7000 0 0.5 1 1.5 2 2.5 3 L oa d (N ) Displacement (mm) EPX2 T0 Tw Tm 0 1000 2000 3000 4000 5000 6000 7000 0 1 2 3 4 5 L oa d (N ) Displacement (mm) EPX3 T0 Tw Tm 0 50 100 150 200 250 300 350 0 5 10 15 20 25 L oa d (N ) Displacement (mm) ACR1 T0 Tw Tm 0 50 100 150 200 250 300 350 0 5 10 15 20 L oa d (N ) Displacement (mm) ACR2 T0 Tw Tm -62.8 -24.6 21.9 -65.5 -54.7 -80.0 -70.0 -60.0 -50.0 -40.0 -30.0 -20.0 -10.0 0.0 10.0 20.0 30.0
EPX1 EPX2 EPX3 ACR1 ACR2
Fm ax [ kN ] 1) -85.4 -91.7 -85.9 -90.5 -82.5 -100.0 -90.0 -80.0 -70.0 -60.0 -50.0 -40.0 -30.0 -20.0 -10.0 0.0
EPX1 EPX2 EPX3 ACR1 ACR2
Fm ax [ kN ] b)
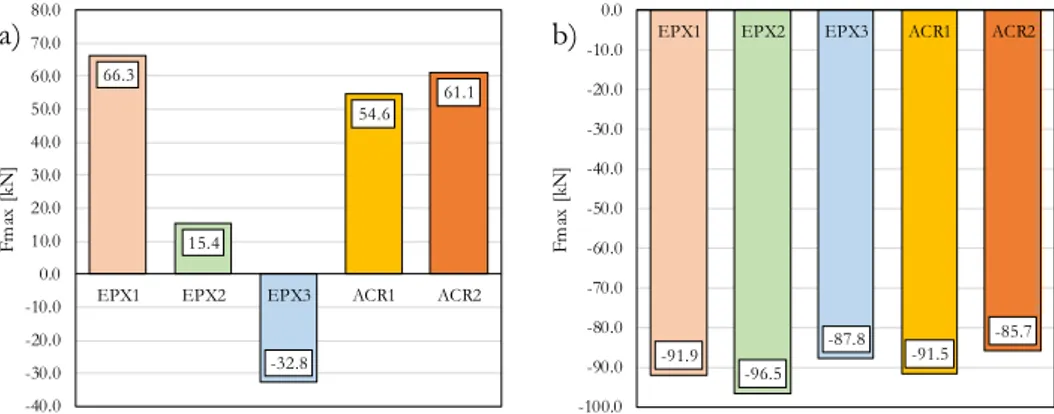
Figure 2.8 Percentage reduction of the maximum carried load of the GFRP/glass double lap joint at high temperatures: a) Tw and b)Tm
EPX2 and EPX3 shown the best behavior at work temperature, with a contained reduction of the maximum load; in particular, EPX3 presented even an improvement of the performance, that can be explained through a further adhesive catalyzation with the high temperature. Moreover, this improvement can be associated to a change in the failure mode: the tested samples showed a fragile failure at T0, while, at Tw, the failure mode changed, exhibiting a plastic
deformation, which is, instead, not present at Tm. As a matter off act all adhesives
presented a drastic reduction of the load carrying capacity at Tm, that is correctly
identified by the manufacturer as the maximum service temperature indeed.
Failure modes
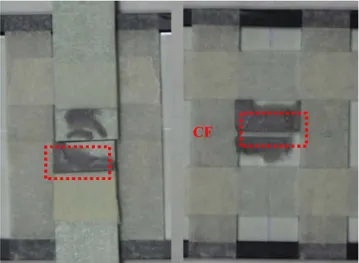
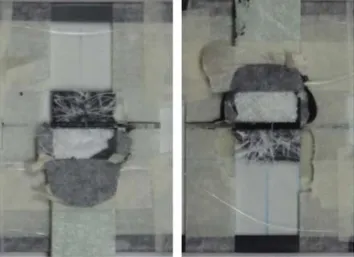
In this section, the failure modes of the tested specimens are described and analyzed. The failure modes are classified according to ASTM D3528-16 (2016); in Figure 2.9- Figure 2.12the four types of failure modes occurred during the tests are depicted:
• The first is an “Adhesive Failure” (AF – Figure 2.9) and occurred at the interface between the adherent and the adhesive.
• The second is a “Cohesive Failure” (CF – Figure 2.10), occurring within the adhesive layer: this reveals a good compatibility between adhesive and adherents.
• In the third picture (Figure 2.11), a ‘‘Light-Fiber-Tear Failure” (LFTF) is showed that occurred within the GFRP adherent, with few glass fibers transferred from the adherent to the adhesive.
66.3 15.4 -32.8 54.6 61.1 -40.0 -30.0 -20.0 -10.0 0.0 10.0 20.0 30.0 40.0 50.0 60.0 70.0 80.0
EPX1 EPX2 EPX3 ACR1 ACR2
Fm ax [ kN ] a) -91.9 -96.5 -87.8 -91.5 -85.7 -100.0 -90.0 -80.0 -70.0 -60.0 -50.0 -40.0 -30.0 -20.0 -10.0 0.0
EPX1 EPX2 EPX3 ACR1 ACR2
Fm ax [ kN ] b)
• In Figure 2.12 there is an example of “Mixed Failure” (MF), which combines two of the failure modes described above (AF and CF, for example).
Figure 2.9 Failure modes of glass-GFRP/aluminum double lap joints: adhesive failure.
Figure 2.10 Failure modes of glass-GFRP/aluminum double lap joints: cohesive failure.
Figure 2.11 Failure modes of glass-GFRP/aluminum double lap joints: light-fiber-tear failure.
Figure 2.12 Failure modes of glass-GFRP/aluminum double lap joints: mixed failure.
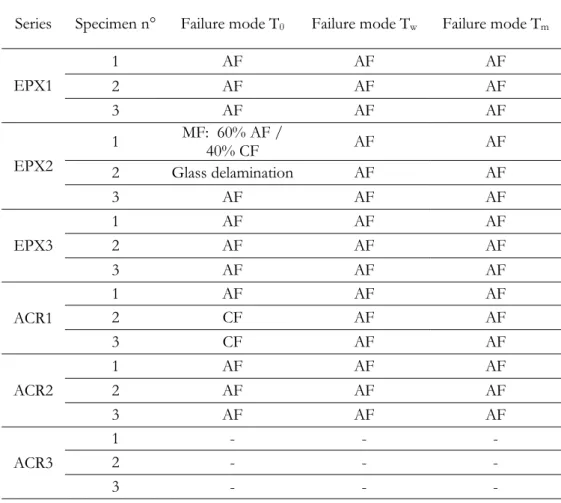
Table 2.XIand Table 2.XIIsummarize the failure modes of glass-aluminum and glass-GFRP joints, respectively.
Glass-Aluminum specimens presented mainly AF, while glass-GFRP showed LFTF or CF, showing a greater compatibility of the bonding system at T0. For both epoxy and acrylic adhesives, the adherence with the laminates is
reduced by the exposition to high temperatures, i.e. the majority of the observed failures became AF.
Table 2.XI Failure modes of aluminum-glass double lap joints
Series Specimen n° Failure mode T0 Failure mode Tw Failure mode Tm
EPX1 1 AF AF AF 2 AF AF AF 3 AF AF AF EPX2 1 MF: 60% AF / 40% CF AF AF 2 Glass delamination AF AF 3 AF AF AF EPX3 1 AF AF AF 2 AF AF AF 3 AF AF AF ACR1 1 AF AF AF 2 CF AF AF 3 CF AF AF ACR2 1 AF AF AF 2 AF AF AF 3 AF AF AF ACR3 1 - - -2 - - -3 - -
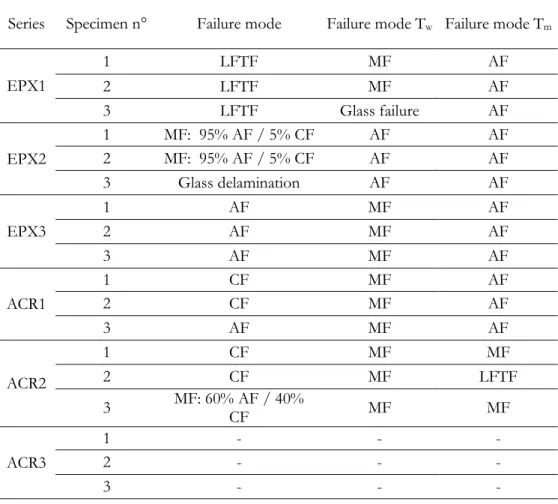
-Table 2.XII Failure modes of GFRP-glass double lap joints
Series Specimen n° Failure mode Failure mode Tw Failure mode Tm
EPX1 1 LFTF MF AF 2 LFTF MF AF 3 LFTF Glass failure AF EPX2 1 MF: 95% AF / 5% CF AF AF 2 MF: 95% AF / 5% CF AF AF 3 Glass delamination AF AF EPX3 1 AF MF AF 2 AF MF AF 3 AF MF AF ACR1 1 CF MF AF 2 CF MF AF 3 AF MF AF ACR2 1 CF MF MF 2 CF MF LFTF 3 MF: 60% AF / 40% CF MF MF ACR3 1 - - -2 - - -3 - - -2.1.4 Discussion
Tensile tests demonstrated the compatibility of the GFRP and glass-aluminum- bonding system, and the best mechanical performance of the first epoxy adhesive (EPX1) was observed, for both adherents. Epoxy joints are influenced by the adherent, in particular the load carrying capacity is higher in GFRP joints with respect to the aluminum ones, due to the GFRP higher superficial roughness; instead, in acrylic joints this influence is less evident.
In an unexpected way EPX3, presented an improvement of the performance at work temperature, which could be explained through a further adhesive catalization with the high temperature. All the adhesives presented a drastic reduction of the load carrying capacity at Tm. Glass-aluminum specimens
presented adhesive failure, while glass-GFRP showed LFTF or CF, showing a greater compatibility of the bonding system at T0. Exposition to high
temperatures deteriorates the adhesion between laminates and adhesive, changing in many cases the failure modes to AF.
In summary both at room temperature and high temperatures the highest load carrying capacity was shown by the epoxy adhesives, while, on the other hand, the highest load elongation was obtained with the acrylic ones. Therefore, if a structural performance is needed, epoxy adhesive are more appropriated hybrid joints with glass-aluminum and glass-GFRP. Furthermore, even if exposition to high temperatures leads to a decay of the joint mechanical performances, which has to be taken into account with an appropriate safety factor in the design phase, the joint elongation for epoxy adhesives is contained within a suitable functionality limit.
2.2 Compatibility and temperature effect on hybrid painted bonded joints made of glass-aluminum
In this second experimental campaign, the mechanical properties of different adhesive joints were investigated. The attention was focused on painted aluminum and cloudy glass. In the field of window frame these materials are much used and it’s important to verify the compatibility between them and the adhesive.
Furthermore, in this work the influence of temperature was investigated in order to evaluate the limit of functionality of adhesive joint. Tensile test on double-lap joints were performed and the results will be discussed in the following sections.
Moreover, in this project, the attention was focused on the adhesive DP460 3MTM (EPX4) and for this reason, a mechanical characterization of the selected
adhesive was done. Tensile test at three temperatures on bone dog shape specimens were performed in order to evaluate the constitutive law.
2.2.1 Materials and methods
In order to verify the compatibility and the temperature effect of painted glass/transparent glass junctions, tensile tests on adhesively bonded double lap joints were carried on. In this section, the used materials and the experimental conditions are shown. The combinations were:
• Painted glass – glossy aluminum • Transparent glass – glossy aluminum
Adherends
Different materials were used in this work, supplied by local producers: float transparent glass, float painted glass and glossy aluminum. The mechanical properties of the materials, provided by the manufacturers, are reported in the following Table 2.XIIIand Table 2.XIV:
Table 2.XIII Glass mechanical properties according to manufacturer’s data sheet Glass
α Et σt
[°C-1] [GPa] [MPa]
9x10⁻⁶ 75 40
Table 2.XIV Aluminum mechanical properties according to manufacturer’s data sheet Aluminum profiles
α Et σyz σt εt
[°C-1] [GPa] [MPa] [MPa] [%]
23.2x10⁻⁶ 69 250 295 8
Adhesives
In the following are summarized the technical, physical and mechanical characteristics (see Table 2.XV and Table 2.XVI) of the selected adhesive reported by manufacturers data sheet. Only available data are reported.
Table 2.XVI Typical cured thermal properties
Experiments
The experimental tests consist in tensile test on adhesively bonded double lap joints according to ASTM D3528-96 (2016). All combinations are tested:
• Painted glass – glossy aluminum • Transparent glass – glossy aluminum.
Such tests allow evaluating the compatibility between glass-aluminum and comparing the mechanical behavior of the double lap joints bonded with an epoxy adhesive, in terms of their load carrying capacity and displacement.
For each experiment at least five repetitions were conducted, therefore five specimens per type of test and adhesive type where produced. The same bonding thickness (t) of 0.3mm was used for two adhesives. Since the study is focused on the shear strength of the joint, in the connections zone, the double-lap specimens are separated by a 2 mm interspace, where the adhesive is not present, in order to avoid the connection between the two adherents.
No surface treatments were applied to the adherents, since the effect of the superficial roughness was not investigated. All surfaces were cleansed with isopropyl alcohol, furthermore, as recommended by manufacturers. The specimens were manufactured under laboratory conditions (temperature of 20°C, relative humidity of 50%).
2.2.2 Test set up and test program
All tests were carried out according to ASTM D3528-96 (2016), under displacements control, with a crosshead speed of 1,27 mm/min. All specimens were loaded up to the joint fracture, identified as a force drop larger than 80% with respect to the maximum one. The load was applied at the same rate of 1.27 mm/min used for the previous test and the specimens were again loaded up to the joint failure. As mentioned before, for each type test five repetitions were performed subdivided according to the temperature conditions; five at room temperature (T0), five at work temperature (Tw, namely 50°C) and five at
maximum service temperature (Tm=80°C) for each of the four adherents. The test
program is summarized in the following Table 2.XVII. Table 2.XVII Test program
Combination DP460 (EPX4) T0 Tw Tm
Painted glass – Glossy aluminum 5 5 5 Transparent glass – Glossy aluminum 5 5 5
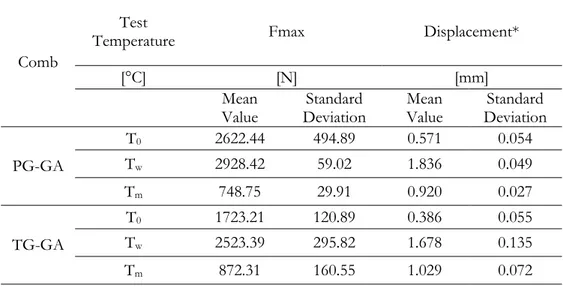
2.2.3 Results and discussion
Tensile tests were conducted on the double lap joints under laboratory conditions. Table 2.XVIIIsummarize the identified mechanical properties of painted glass-glossy aluminum and transparent glass-glossy aluminum double-lap specimens at three test temperatures, in terms of load carrying capacity (N) and maximum elongation (mm).
Table 2.XVIII Mechanical properties of the double-lap specimens at three temperatures.
Comb
Test
Temperature Fmax Displacement*
[°C] [N] [mm]
Mean
Value DeviationStandard Mean Value DeviationStandard PG-GA T0 2622.44 494.89 0.571 0.054 Tw 2928.42 59.02 1.836 0.049 Tm 748.75 29.91 0.920 0.027 TG-GA T0 1723.21 120.89 0.386 0.055 Tw 2523.39 295.82 1.678 0.135 Tm 872.31 160.55 1.029 0.072