DI
Department of Molecular and Developmental Medicine PhD School in Molecular Medicine
Scuola di dottorato in Medicina Molecolare XXXIII Cycle
Coordinator: Prof. Vincenzo Sorrentino
Unraveling tandem repeat variation in
personal genomes with long reads
Academic Discipline: MED/04
Supervisor:
Prof. Alberto Magi Doctoral Dissertation of: Dr. Davide Bolognini
Academic Year: 2019/2020
CN = Bolognini Davide
C = IT
i
Preface
This thesis embraces most of the efforts I put during the last three years as a PhD student.
I have been working under the supervision of professor Alberto Magi, who is also the leader of the research group I am part of. In this time frame I had the wonderful opportunity of being initiated to bioinformatics, which radically changed the way I look at things and led me to discover my natural “thinking outside the box” attitude. I also took part of exciting joint works, with the year II spent at the European Molecular Biology Laboratory (EMBL) being at the first place. The work I am about to discuss in this thesis is not a one-man effort but stems from the collab-oration between my home lab, EMBL’s Genomics Core Facility and EMBL’s Genome Biology Unit, which fits seamlessly into the collaborative spirit I was looking for in science.
This research is all about processing (DNA) strings. Clearly, the way I used to process strings has changed a bit since my classi-cal studies. Still, I can remember me trying to identify prefixes and suffixes of Greek and Latin words to better understand their meaning. At the time, I never thought that processing strings would have been that interesting to me.
There is a humongous amount of people that, directly or indi-rectly, have contributed to my research and, in particular, to this work. Since my first step into the lab, I will not, ever, be thankful enough to Alberto, who, despite my initial skepticism, convinced me to submit that application for the PhD program and trusted me more than I ever did, since the very first moment.
For hosting and supporting my research abroad, I am thankful to Vladimir Benes, Jan O. Korbel and Tobias Rausch, who has been, and still is, an inexhaustible source of inspiration to me.
On the colleagues-side of these acknowledgments, I put all the guys from Alberto’s lab (Roberto Semeraro, Alessandra Mingrino and Gianluca Mattei), the members of the Genomics Core Facil-ity (in particular Jonathan Landry and Jan Provaznik for their meaningful suggestions) and the members of the Genome Biology Unit (in particular Ashley D. Sanders and Hyobin Jeong for our constructive collaborations).
On the friends-side of this list, Marco Cecchi and Simone Romag-noli go first, for being kind of brothers to me.
I have tried to translate in simple words the infinite gratitude I have and will always have to my parents and Iulia for being my fixed point in life.
v
Abstract
Tandem repeats are repeated sequences that occur adjacent to each other in the human genome. Due to their prevalence and their association with a number of genetic diseases, there is a rising interest in developing tools for tandem repeat profiling. Genome-wide discovery approaches are needed to fully understand their roles in health and disease but resolving tandem repeat vari-ation accurately remains a very challenging task. Indeed, while traditional mapping-based and assembly-based approaches using short-read data have severe limitations in the size and type of tan-dem repeats they can resolve, recent third-generation sequencing technologies provide the long reads required to broaden the scope of detectable tandem repeats but exhibit substantially higher se-quencing error rates that complicates repeat resolution.
In order to overcome limitations of prior methods, we developed TRiCoLOR, a freely-available tool for tandem repeat profiling using error-prone long reads from third-generation sequencing technologies.
The method can identify repetitive regions in long-read sequenc-ing data de novo and resolve their motif and multiplicity in a haplotype-specific manner. The tool further includes methods to interactively visualize the identified repeats and to trace their Mendelian consistency in pedigrees.
Tested on synthetic data harboring tandem repeat contractions and expansions, TRiCoLOR demonstrates excellent performances and improved precision and recall compared to alternative tools. For real human whole-genome sequencing data, TRiCoLOR achieves high validation rates, suggesting its suitability to identify tandem repeat variation in personal genomes.
Compared to assembly-based approaches for structural variant detection, TRiCoLOR demonstrates capable to resolve tandem repeats in difficult to assemble regions that are prone to misas-semblies or incorrect repeat assignments.
TRiCoLOR is open-source and implemented in python 3, with sup-porting C++ code and bash scripts. The tool is released through
GitHub (https://github.com/davidebolo1993/TRiCoLOR) and as a
docker image (https://hub.docker.com/r/davidebolo1993/tricolor),
Contents
List of Figures x
List of Tables xv
List of Acronyms xvi
1 Introduction 1
1.1 Sanger Sequencing: The First Generation . . . 2
1.2 Second Generation Sequencing . . . 3
1.2.1 Sequencing By Ligation . . . 5
1.2.2 Sequencing By Synthesis . . . 6
1.3 Third Generation Sequencing . . . 9
1.3.1 Single-Molecule Real-Time Sequencing . . . 10
1.3.2 Nanopore Sequencing . . . 11
1.3.3 Synthetic Long Reads . . . 12
1.4 Repetitive DNA . . . 15
1.4.1 Genome Resequencing . . . 18
1.4.2 De Novo Genome Assembly . . . 20
1.4.3 Short-Read Tandem Repeat Callers . . . . 21
2 Aims And Objectives 28 3 Methods 32 3.1 Pre-processing: Phasing . . . 33 3.2 TRiCoLOR . . . 35 3.2.1 TRiCoLOR SENSoR . . . 36 3.2.2 TRiCoLOR REFER . . . 37 3.2.3 TRiCoLOR ApP . . . 45 3.2.4 TRiCoLOR SAGE . . . 45
4 Results 47 4.1 TRiCoLOR on synthetic data . . . 48 4.2 TRiCoLOR on real data . . . 50
5 Discussion 54
6 Figures 56
7 Tables 78
1 Template amplification strategies. Different strategies used to generate clonal DNA template populations: bead-based generation (a), solid-state generation (b,c), DNA nanoball generation (d). Figure is taken from Coming of age: ten years of next-generation sequencing technologies (Goodwin et al., 2016). . . 57
2 SBL methods. Summary of the SBL approaches by SOLiD
(a) and Complete Genomics (b). Figure is taken from Coming of age: ten years of next-generation sequencing
technologies (Goodwin et al., 2016). . . 58
3 SBS methods: CRT approaches. Summary of the CRT
approaches by Illumina (a) and Qiagen (b). Figure is taken from Coming of age: ten years of next-generation sequencing
technologies (Goodwin et al., 2016). . . 59
4 SBS methods: SNA approaches. Summary of the SNA
approaches by Roche (a) and Thermo Fisher Scientific (b). Figure is taken from Coming of age: ten years of
next-generation sequencing technologies (Goodwin et al., 2016). . 60
5 Long-read sequencing approaches. Different strategies
used to generate long reads: SMRT sequencing by PacBio (Aa), nanopore sequencing by ONT (Ab), Synthetic long-read sequencing by Illumina (Ba) and 10X Genomics (Bb). Figure is taken from Coming of age: ten years of
next-generation sequencing technologies (Goodwin et al., 2016). . 61
6 Detection of base modifications with SMS. Different
strate-gies used to identify nucleotides epigenetically mofified using SMS: SMRT sequencing by PacBio (a,b,c) and nanopore se-quencing by ONT (d,e,f). Figure is taken from Deciphering bacterial epigenomes using modern sequencing technologies (Beaulaurier et al., 2019). . . 62
LIST OF FIGURES xi
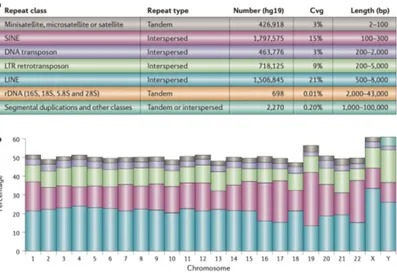
7 Repetitive DNA in the human genome. Named classes of
repeats in the human genome, along with their pattern of occurrence, the percentage of the genome that is covered by each repeat class and the approximate upper and lower bounds on their lengths (a). The percentage of each chromo-some covered by each repeat class is also shown (b). Data are based on the RepeatMasker annotation on release hg19 of the human genome (http://www.repeatmasker.org). Figure is taken from Repetitive DNA and next-generation
sequencing: computational challenges and solutions
(Trean-gen and Salzberg, 2012). . . 63
8 Ambiguities in read mapping. As the difference between
two copies of a repeat increases, the confidence in any read placement within the repeat increases as well (A). When a read maps equally well to two different locations, this is assigned to either the first or the second depending on the score given by the aligner to mismatches and gaps (B). Figure is taken from Repetitive DNA and next-generation
sequencing: computational challenges and solutions
(Trean-gen and Salzberg, 2012). . . 64
9 Assembly errors caused by repeats. Different assembly
errors caused by repeats: a rearrangement error (A), a col-lapsed repeat (B) and a colcol-lapsed interspersed repeat (C). Figure is taken from Repetitive DNA and next-generation
sequencing: computational challenges and solutions
(Trean-gen and Salzberg, 2012). . . 65
10 Shannon entropy of tandem repeats. Negatively- skewed
distribution of Shannon entropy in simulated ONT (A) and PacBio (B) BAM files. A Shannon entropy value of ⇠ 1.23 allows to exclude ⇠ 98% of the alignment informations screened. Read-specific Shannon entropy in simulated ONT (C) and PacBio (D) BAM files. All the reads show a Shannon entropy drop below the ⇠ 1.23 threshold in the repeated region. Figure is taken from TRiCoLOR: tandem repeat profiling using whole-genome long-read sequencing data(Bolognini et al., 2020a). . . 66
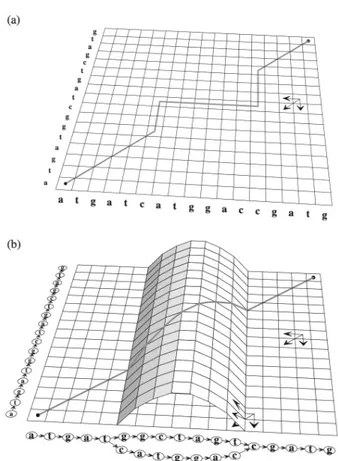
11 Dynamic programming matrix for partial orders.
Dy-namic programming matrix for Needleman–Wunsch se-quence alignment algorithm (a) and for the POA algorithm (b), with the optimal alignment paths shown. Figure is taken from Multiple sequence alignment using partial order
12 Error profiles of ONT and PacBio reads. Error profiles of real ONT (A, C) and PacBio (B, D) alignments from the HG00733, HG00514 and NA19240 HGSVC individuals. SPOA can correct most of the initial error rates of the orig-inal alignments (C, D). Haplotype-resolved alignments for each individual are indicated with the “h1” or “h2” suffixes. Figure is taken from TRiCoLOR: tandem repeat profiling using whole-genome long-read sequencing data(Bolognini et al., 2020a). . . 68
13 Performances of minimap2 and NGMLR. Minimap2 (red line)
and NGMLR (blue line)’s speed (y-axis) when aligning in-creasing number of reads (x-axis). Minimap2 and NGMLR’s accuracy performances (y-axis) on synthetic ONT (B) and PacBio (C) reads having different average lengths (x-axis). Figure is taken from TRiCoLOR: tandem repeat profiling using whole-genome long-read sequencing data(Bolognini et al., 2020a). . . 69
14 HTML file from TRiCoLOR ApP. Home page of the HTML
file generated by TRiCoLOR REFER. Figure is taken from TRiCoLOR: tandem repeat profiling using whole-genome long-read sequencing data(Bolognini et al., 2020a). . . 70
14 HTML file from TRiCoLOR ApP. Higher magnification of
the HTML file generated by TRiCoLOR REFER. Figure is taken from TRiCoLOR: tandem repeat profiling using whole-genome long-read sequencing data(Bolognini et al., 2020a). . . 71
14 HTML file from TRiCoLOR ApP. Further magnification of
the HTML file generated by TRiCoLOR REFER. Figure is taken from TRiCoLOR: tandem repeat profiling using whole-genome long-read sequencing data(Bolognini et al., 2020a). . . 72
LIST OF FIGURES xiii
15 P, R and F1 of TRiCoLOR. TRiCoLOR’s P (x-axis), R
(y-axis) and F1 (dashed lines) on syntethic TR contractions (A) and expansions (B). ONT and PB reads exhibit variable error rates (accuracy ⇠0.85, red; accuracy ⇠0.90, blue; accuracy ⇠0.95, green) and were simulated using variable haplotype-specific depth of coverage. P, R and F1 were calculated allowing no motif discrepancies (circle symbol), 1 motif discrepancy (triangle symbol) or 2 motif discrepancies (rhombus symbol) between TRiCoLOR’s predictions and the number of repeated motifs in the ground truth. Figure is adapted from TRiCoLOR: tandem repeat profiling using whole-genome long-read sequencing data(Bolognini et al., 2020a). . . 73
16 Accuracy of TRiCoLOR on motif prediction. The pie charts
contain the percentage of the motifs correctly (not shifted, green; shifted, orange) and wrongly (violet) predicted by TRiCoLOR on synthetic data from Figure 15. Figure is adapted from TRiCoLOR: tandem repeat profiling using whole-genome long-read sequencing data(Bolognini et al., 2020a). . . 74
17 Correlation results of TRiCoLOR and NCRF on short repeats.
Correlation results between the number of repeated motifs in the ground truth (x-axis) and the number of repeated motifs predicted by TRiCoLOR and NCRF (y-axis) for syntethic TR contractions (A) and expansions (B). Each dot represents the synthetic contraction/expansion of a sin-gle TR. R is the Pearson’s correlation coefficient, p is the p-value of the linear regression analysis, m is the slope of the regression line and the dashed line is the bisector of the first quadrant angle that marks the perfect correspondence between expected and predicted number of TRs. Figure is taken from TRiCoLOR: tandem repeat profiling using
whole-genome long-read sequencing data(Bolognini et al.,
18 Correlation results of TRiCoLOR and NCRF on long repeats. Correlation results between the number of repeated motifs in the ground truth (x-axis) and the number of repeated motifs predicted by TRiCoLOR and NCRF (y-axis) for long syntethic TR expansions. Each dot represents the synthetic contraction/expansion of a single TR. R is the Pearson’s coefficient, p is the p-value of the linear regression analy-sis, m is the slope of the regression line and the dashed line is the bisector of the first quadrant angle that marks the perfect correspondence between expected and predicted number of TRs. Figure is taken from TRiCoLOR: tandem repeat profiling using whole-genome long-read sequencing data(Bolognini et al., 2020a). . . 76
19 Validation ratios. Reference-free validation ratios of
TRiCoLOR calls on the HGSVC individuals HG00733 (ONT and PacBio), HG00514 and NA19240 (total calls, light green; valid calls, green; variants too long to be validated, dark green). Figure is taken from TRiCoLOR: tandem repeat profiling using whole-genome long-read sequencing data(Bolognini et al., 2020a). . . 77
List of Tables
1 Microsatellite loci involved in neurological disorders.
The table contains detailed informations on microsatellite
lociinvolved in neurological disorders associated with repeat
expansions. Inserted repeats do not appear in the reference at the respective locus, thus having repeat number 0. Table is adapted from Recent advances in the detection of re-peat expansions with short-read next-generation sequencing (Bahlo et al., 2018). . . 79
2 Repeats-related tools. The table summarizes the tools
cited in this dissertation that are inherent with the discovery of repeats in genomes. . . 80
3 Comparison of TRiCoLOR and HGSVC calls. Comparison
between TRiCoLOR’s mapping-based and HGSVC’s assembly-based approaches for Mendelian consistent long TRs identi-fied by TRiCoLOR on the HG0733 PacBio individual. . . . 81
ApP Alignment Plotter . . . 33
BAC Bacteria Artificial Chromosome . . . 12
BAM Binary Alignment Map . . . 19
CCS Circular Consensus Sequence . . . 10
CLR Continuous Long Read . . . 10
CRT Cyclic Reversible Termination . . . 6
cPAL Combinatorial Probe–Anchor Ligation . . . 5
cPAS Combinatorial Probe–Anchor Synthesis . . . 5
DAG Directed Acyclic Graph . . . 38
ddTTPs Dideoxythymidine Triphosphates . . . 2
DIRS Dictyostelium Intermediate Repeat Sequence . . . 18
dTTPs Deoxythymidine Triphosphates . . . 2
DTW Dynamic Time Warping. . . .30
dNTPs Deoxyribonucleotide Triphosphates . . . 2
emPCR Emulsion PCR. . . .4
F1 F1 score . . . 48
xvii
FN False Negative . . . 48
FP False Positive . . . 48
FXS Fragile-X Syndrome . . . 14
GEMs Gel Bead-In EMulsions . . . 13
HGSVC Human Genome Structural Variation Consortium . 33 HMM Hidden Markov Model . . . 29
LINEs Long Interspersed Nuclear Elements . . . 18
LTR Long Terminal Repeat. . . .18
MSA Multiple Sequence Alignment . . . 38
MSI Microsatellite Instability . . . 17
NCRF Noise Cancelling Repeats Finder . . . 28
NGS Next Generation Sequencing . . . 1
ONT Oxford Nanopore Technologies . . . 11
P Precision . . . 48
PacBio Pacific Biosciences . . . 10
PCR Polymerase Chain Reaction . . . 3
Pearson’s R Pearson Correlation Coefficient . . . 49
PLE Penelope-Like Element . . . .18
POA Partial Order Alignment . . . 30
R Recall . . . 48
rDNA ribosomal DNA. . . .15
REFER REpeats FindER . . . 32
RegEx Regular Expression . . . 31
SA Suffix Arrays . . . 51
SAGE SAmple GEnotyper. . . .33
SAM Sequence Alignment/Map. . . .19
satDNA satellite DNA . . . 17
SBL Sequencing By Ligation . . . 4
SBS Sequencing By Synthesis . . . 4
SENSoR Shannon ENtropy ScanneR . . . 32
SGS Second Generation Sequencing . . . 4
SIMD Single Instruction Multiple Data . . . 25
SINEs Short Interspersed Nuclear Elements . . . 18
SLR Synthetic Long Reads . . . 12
SMRT Single-Molecule Real-Time . . . 9
SMS Single Molecule Sequencing. . . 9
SNA Single-Nucleotide Addition . . . 6
SNPs Single-Nucleotide Polimorphisms . . . 15
SNVs Single-Nucleotide Variants . . . 9
STRs Short Tandem Repeats . . . 16
SVs Structural Variants . . . 9
TEs Transposable Elements . . . 17
TP True Positive . . . 48
TRF Tandem Repeats Finder . . . 21
TRiCoLOR Tandem Repeats Caller for LOng Reads . . . 28
TRs Tandem Repeats. . . .15
VNTRs Variable Number of Tandem Repeats . . . 17
Introduction
1
DNA sequencing evolves quickly. Barely 40 years have passed since the initial sequencing method has been developed in 1977 by Frederick Sanger and colleagues (Sanger et al., 1977). This revolutionary study triggered the improvement of new methods that have provided great opportunities for fast, low-cost and high-throughput DNA sequencing. Indeed, strikingly after the Human
Genome Project1, the time interval between emerging sequencing
technologies has been substantially reduced while the amount of sequenced data has grown exponentially (Ari and Arikan, 2016). Considering Sanger sequencing as the first generation, new gener-ations of DNA sequencing have been introduced subsequently and are collectively known as Next Generation Sequencing (NGS). Some of the biggest technical challenges that are associated with NGS are caused by repetitive DNA (Alkan et al., 2011), i.e. DNA sequences that are similar or identical to others elsewhere in the genome. From a computational perspective, repeats create ambi-guities in alignment and in genome assembly which, in turn, can produce errors when interpreting results.
The sections below describe the main aspects of the different se-quencing generations as well as the challenges that are posed by
repeats for genome resequencing projects and de novo genome assembly.
1.1 Sanger Sequencing: The First Generation
In 1977, Sanger and colleagues announced a new method for deter-mining the nucleotide sequence in DNA, which is nowadays known as Sanger method. The technique was first applied to the DNA of bacteriophage X174 and significantly improved over the plus and minus method from the same authors (Sanger and Coulson, 1975).The Sanger method takes inspiration from a previous work that demonstrated the inhibitory activity of Dideoxythymidine Triphos-phates (ddTTPs) on DNA polymerase I. Indeed, ddTTPs lack the
30 hydroxyl group needed to form the phosphodiester bond
be-tween one nucleotide and the next during DNA strand elongation and hence cause a chain termination reaction when incorporated into the nascent fragment by the DNA polymerase (Atkinson et al., 1969).
If an oligonucleotide primer and single-stranded target DNA are incubated in the presence of a mixture of Deoxythymidine Triphosphates (dTTPs) and ddTTPs, as well as the other three
Deoxyribonucleotide Triphosphates (dNTPs), one of which 32
P-radiolabeled, a mixture of fragments having all the same 50 and
with a ddTTP residue at the 30 ends is obtained. When this
mixture is fractioned by electophoresis on acrylamide gel, the pattern of bands shows the distribution of dTTPs in the newly synthetized DNA. By using analogous terminators for the other nucleotides in separate incubations and running the samples in parallel on acrylamide gel (i.e. one lane for each type of dNTP), a pattern of bands is obtained, from which the entire sequence of the newly synthetized DNA can be deducted (Metzker, 2005). Significant improvements to the Sanger method have been intro-duced over the years, including: (1) the development of fluorescent terminator dyes to eliminate the risk caused by the radioisotopes used for labelling; (2) the introduction of thermal-cycle sequencing to reduce the quantity of required input DNA and thermostable polymerases to efficiently and accurately incorporate the termi-nator dyes into the growing DNA strands; (3) the replacement
1.2. Second Generation Sequencing of acrylamide gel electophoresis with multichannel capillary elec-trophoresis powered by automated, refillable and reusable capil-laries, and the introduction of electrokinetic sample loading. Since 1987, the leader in automated Sanger sequencing is Applied Biosystems (nowadays part of Thermo Fisher Scientific). Their sequencers all utilize fluorescent dyes and capillary electrophoresis (from 4 to 48–96 capillaries) and generate 600–1000 bases of
accu-rate sequence (Slatko et al., 2018). Automated Sanger sequencing platforms from Applied Biosystems were successfully utilized in the sequencing of the first human genome (Lander et al., 2001), taking into account 13 years of efforts of the Human Genome Project consortium and with an estimated cost of $2.7 billion. Although relatively slow and not as cost-effective for high num-bers of targets when compared to current NGS standards, the Sanger method remains the most appropriate sequencing strat-egy for applications where high throughput is not required (e.g. verify plasmid constructs or Polymerase Chain Reaction (PCR) products). Moreover, Sanger sequencing is currently used to com-plement NGS in regions that are notorously difficult-to-sequence (e.g. GC-rich and low-complexity regions), and to confirm NGS
results (Behdad et al., 2015; Mu et al., 2016).
1.2 Second Generation Sequencing
In the 2000s, the concept of DNA sequencing underwent drastic
changes. Particularly, the shotgun sequencing strategy2, which
was introduced during the Human Genome Project, laid the foun-dation for massively parallel sequencing. At the time, the release of the first truly high-throughput sequencing platform by Lynx Therapeutics (later purchased by Illumina) heralded a 50000-fold drop in the cost of human genome sequencing since the Human
2In shotgun sequencing, the starting DNA is broken up randomly into
many small pieces, sort of in a shotgun fashion, with each of those pieces then sequenced individually. The resulting sequence reads generated from the different pieces are then analyzed by means of dedicated softwares, looking for stretches of sequence from different reads that are identical with one another. When identical regions are identified, they are overlapped with one another, allowing the two sequence reads to be stitched together. This process is repeated over and over and over again, eventually yielding the complete sequence of the starting piece of DNA.
Genome Project and marked the beginning of Second Generation Sequencing (SGS)
The major advance offered by SGS is the ability to produce an enormous volume of data, in several cases in excess of one billion short reads per instrument run, as well as to deliver fast and cost-effective genomic informations if compared to sequencing strategies based on the Sanger method (Barba et al., 2013). SGS approaches can be broadly classified into Sequencing By Liga-tion (SBL) and Sequencing By Synthesis (SBS) approaches. On the one hand, in SBL approaches a probe sequence that is
bound to a fluorophore hybridizes to a template3 and is ligated to
an adjacent oligonucleotide for imaging. The emission spectrum of the fluorophore indicates the identity of the bases complementary to specific positions within the probe. On the other, in SBS ap-proaches, a polymerase is used and a signal, such as a fluorophore or a change in ionic concentration, identifies the incorporation of a nucleotide into the elongating strand.
Both in SBL and SBS approaches the template is first clonally amplified, usually on a solid surface. Indeed, having many thou-sands of identical copies of a DNA fragment in a defined area ensures that the signal can be distinguished from background noise. Moreover,the creation of millions of individual SBL/SBS reaction centres (each having its own clonal template), guarantees massive parallelization (Goodwin et al., 2016). Available strategies for clonal amplification of a template are summarized in Figure 1.
The first step of template generation is fragmentation4 of the
sample DNA followed by ligation to a common adaptor set for clonal amplification and sequencing.
In bead-based preparations (Figure 1, panel A), the template is hybridized to bead-bound primers. By means of Emulsion PCR (emPCR) the template is amplified so that, at the end, thou-sands of clonal DNA fragments are immobilized on a single bead. Beads can in turn be distributed onto a glass surface (Jae et al., 2007) or arrayed on a PicoTiterPlate (Leamon et al., 2003). In solid-state strategies (Figure 1, panel B and C), amplification is achieved directly on a slide. Forward and reverse primers are
3DNA fragment that has to be sequenced.
4Fragmentation of a large DNA fragment into smaller fragments can be
achieved mechanically (e.g. by passing the DNA through a narrow passage), by sonication or enzymatically.
1.2. Second Generation Sequencing covalently bound to the slide surface, either randomly or on a patterned slide (i.e. a flow cell), and provide complementary ends to which template can bind.
The only approach that achieves template enrichment in solution is currently the Complete Genomics technology used by the Beijing Genomics Institute (Figure 1, panel D). Here, DNA undergoes an iterative ligation, circularization and cleavage process to create a circular template, also known as rolling circle amplification, which generates up to 20 billion discrete DNA nanoballs that are in turn distributed onto a patterned slide surface containing features that allow a single nanoball to associate with each location (Drmanac et al., 2010).
1.2.1 Sequencing By Ligation
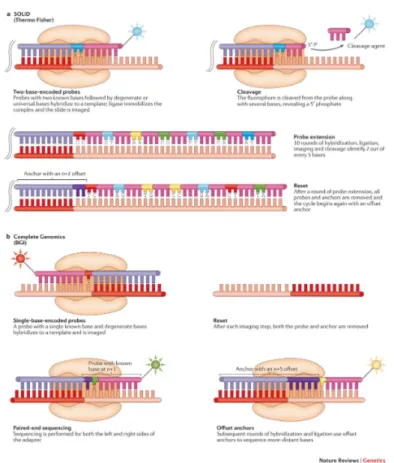
SBL approaches involve the hybridization and ligation of anchor fragments and labelled probes to the template.
In particular, an anchor fragment encodes a known sequence that is complementary to an adaptor sequence on the template and provides a site to initiate ligation. A probe can have either one (i.e. one-base-encoded probes) or two (i.e. two-base-encoded probes) known bases followed by a series of degenerate bases that drive complementarity between probe and template. After liga-tion, the template is imaged and the known base or bases in the probe are identified. A new cycle begins after complete removal of the anchor-probe complex or through cleavage to remove the fluorophore and to regenerate the ligation site. Figure 2 illustrates these details.
SBL sequencing platfroms from SOLiD utilize two-base-encoded probes (Figure 2, panel A). Therefore each fluorometric signal rep-resents a dinucleotide. Because there are 16 possible dinucleotide combinations and these cannot be identified with spectrally-resolvable fluorophores, four signals, each representing a subset of four dinucleotide combinations, are used that are further deconvo-luted during data analysis (Valouev et al., 2008).
Complete Genomics performs DNA sequencing using Combinatorial Probe–Anchor Ligation (cPAL) or Combinatorial Probe–Anchor Synthesis (cPAS), which is a modification of cPAL but very few details about this method are available (Fehlmann et al., 2016). In both approaches, hybridizing probes are from a pool of
one-base-encoded probes (Figure 2, panel B).
1.2.2 Sequencing By Synthesis
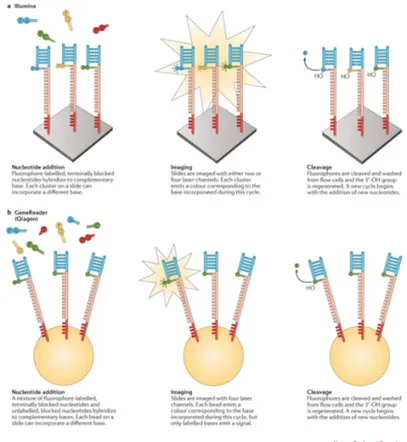
SBS is a term used to describe numerous DNA-polymerase-dependent methods. Following the indications from Goodwin and collegues, SBS methods can be further classified into Cyclic Reversible Termi-nation (CRT) and Single-Nucleotide Addition (SNA) approaches. 1.2.2.1 Cyclic Reversible Termination
In CRT approaches, terminator molecules that are similar to
those used in Sanger sequencing are used, in which the 30 hydroxyl
group is blocked (Guo et al., 2008). To start the process, the template DNA is primed by a sequence that is complementary to an adaptor region, which initiates polymerase binding. In each cycle, a mixture of all four dNTPs, which are individually labelled
and 30-blocked, are added. After the incorporation of a single
dNTP in each reaction center, unbound dNTPs are washed out and the surface is imaged in order to identify which dNTP was incorporated at each cluster. Fluorophore and blocking group are then removed and a new cycle begins.
Illumina CRT sequencers are currently the globally leading se-quencing platforms in the next-generation sese-quencing market (Jeon et al., 2019). In Illumina platforms, dNTP identification is achieved through total internal reflection fluorescence microscopy using either two or four laser channels. In most Illumina platforms (e.g. the HiSeq series), each dNTP is bound to a single fluorophore that is specific to that base type, requiring four different imaging channels, whereas few (i.e. NextSeq and MiniSeq) implement a two-fluorophore system.
Qiagen GeneReader uses approximately the same approach used by Illumina sequencers. However, unlike Illumina platforms, GeneReader is intended to be an all-in-one SGS platform, from sample preparation to variant discovery, as it integrates both the QIAcube sample preparation system and the Qiagen Clinical Insight platform for variant analysis.
Figure 3 illustrates Illumina (Figure 3, panel A) and Qiagen (Figure 3, panel B) CRT approaches more in detail.
1.2. Second Generation Sequencing 1.2.2.2 Single-Nucleotide Addition
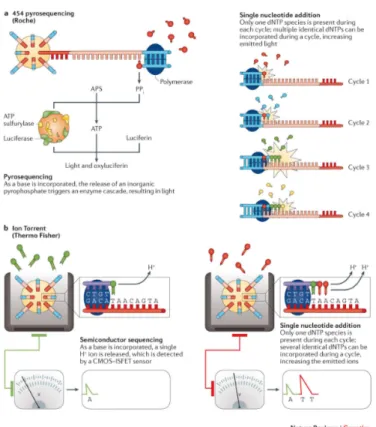
In SNA approaches, a single signal mark the incorporation of a dNTP into the elongating strand. Thus, each of the four nu-cleotides must be added iteratively to the sequencing reaction to ensure only one dNTP is responsible for the generated signal. This does not require the dNTPs to be blocked, as the absence of the next nucleotide in the sequencing reaction prevents elongation. However, in homopolymer regions identical dNTPs are added all together and sequence identification relies on a proportional increase in the incorporation signal. Figure 4 summarizes SNA approaches.
The first SNA platform was a 454 pyrosequencing device, dis-tributed by Roche (Figure 4, panel A). This system distributes template-bound beads into a PicoTiterPlate along with beads con-taining an enzyme cocktail. When a dNTP is incorporeted into a strand, an enzymatic reaction lead to a bioluminescence signal, which is in turn detected by a charge-coupled device camera and traslated into the incorporation of one or more identical dNTPs at a particular bead (Nyrén, 2015).
The Ion Torrent platforms, distributed by Thermo Fisher Scientific
(Figure 4, panel B), detect the H+ions that are released as each
dNTP is incorporated. The resulting change in pH is detected by an integrated complementary metal-oxide-semiconductor and an ion-sensitive field-effect transistor, with pH changes being, theo-retically, proportional to the number of nucleotides detected. Several short-read sequencing platforms exist, each having its own strengths and weaknesses.
SBL approaches by SOLiD and Complete Genomics generate highly accurate data (estimated accuracy is ⇠ 99.99%), as each base is probed multiple times (Liu et al., 2012). However, there are evidence that all under-estimate AT-rich regions (Rieber et al., 2013), with SOLiD devices displaying some substitution errors and some GC-rich under-representation (Harismendy et al., 2009).
Moreover, while Complete Genomics’ latest platform5 extends
the length of the reads generated up to 150 bases for paired-end
sequencing6, the maximum read length for SOLiD platforms is
just 75 bases, strongly limiting their use for genome assembly and structural variant detection applications.
As mentioned above, SBS platforms from Illumina dominate the short-read sequencing industry, mainly thanks to the large variety of available devices that guarantee a wide range of applications including genomics, transcriptomics and epigenomics (Park, 2009; Wang et al., 2009; Buenrostro et al., 2013; Carless, 2015). The suite of Illumina platforms ranges from the low-throughput MiniSeq to the ultra-high-throughput HiSeq X, with a set of 10 HiSeq X devices being capable to deliver over 18000 human genomes to 30X
coverage7 per year, reducing the cost for a single genome down
to $10008. Although the overall accuracy of Illumina platforms is
high (estimated accuracy is ⇠ 99.50%), they do share with SBL approaches some under-representation in AT-rich and GC-rich regions (Nakamura et al., 2011), as well as a tendency towards substitution errors (Minoche et al., 2011). Among SBS platforms, the Qiagen GeneReader is a clinical device with an explicit focus on cancer gene panels (Darwanto et al., 2017). Although this severely limits its possible applications, it is well optimized within its niche.
SNA approaches offer superior read lengths compared to other short-read sequencers, with reads up to an average of 700 bases for the 454 pyrosequencing devices and 400 bases for the Ion Torrent platforms. Despite the overall error rate is comparable to the other SGS platforms in non-homopolymer regions, homopolymers have proven problematic for these platforms, especially those larger than 6–8 bases (Loman et al., 2012). While 454 pyrosequenc-ing platforms have been unable to compete with the others SGS devices and have been discontinued since 2016, the Ion Torrent
6Compared to single-read sequencing, which involves sequencing DNA
from only one end, paired-end sequencing allows users to sequence both ends of a fragment. Standard paired-end sequencing provides a pair of reads, 150 bases in length each, that flank a DNA fragment of about 50 bases in length, which is not sequenced.
7Per-base coverage is the average number of times a base of a genome is
sequenced. The coverage depth of a genome is calculated as the number of bases of all short reads that match a genome divided by the length of this genome.
8 https://www.illumina.com/systems/sequencing-platforms/
1.3. Third Generation Sequencing platforms, thanks to their short runtimes, are currently used for gene-panel sequencing and for point-of-care clinical applications, including transcriptome profiling and splice site identification (Li et al., 2014; Malapelle et al., 2015).
Overall, SGS technologies have become a standard for many ap-plications in basic as well as clinical biology. However, the short length of the reads generated pose several limitations. Indeed, while small variants such as Single-Nucleotide Variants (SNVs) and short indels can be accurately detected using SGS platforms, large Structural Variants (SVs) are challenging to detect and characterize with such technologies, which is an important issue given the high number of diseases related to SVs (Weischenfeldt et al., 2013). In addition, short reads have a limited capacity to link independent variations on the same nucleic acid molecule, thus not being well suited to discriminate and phase alleles to their respective parental homolog, which is important for many aspects of human genetics (Tewhey et al., 2011). Moreover, it has been shown that, despite the use of sophisticated bioinformatic algorithms, it is often impossible to accurately map, or even as-semble, short reads originating from regions harboring repetitive sequences, extreme guanine-cytosine content or sequences with multiple homologous elements within the genome (Mantere et al., 2019).
1.3 Third Generation Sequencing
In the 2010s TGS technologies emerged, which provide reads in excess of several kilobases and allow to overcome limitations of SGS (van Dijk et al., 2018). Among TGS technologies, the Single Molecule Sequencing (SMS) and the synthetic approaches can be distinguished. The SMS approaches differ from short-read approaches in that they do not rely on the amplification of DNA fragments nor do they require chemical cycling for each dNTP added. Alternatively, the synthetic approaches do not generate real long-reads; rather, they represent an approach to library preparation that leverages barcodes to allow computa-tional assembly of larger fragments. The SMS approaches are further classified into Single-Molecule Real-Time (SMRT)-based
and nanopore-based strategies.
1.3.1 Single-Molecule Real-Time Sequencing
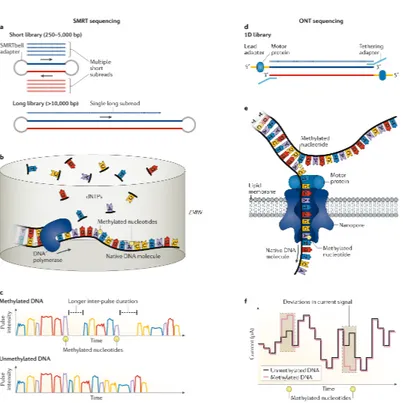
In early 2011 Pacific Biosciences (PacBio) released the PacBio RS sequencer, based on the SMRT sequencing technology (Eid et al., 2009). This technology uses a closed, circular, single-stranded DNA template, called SMRTbell, which is created by ligating hairpin adaptors to both ends of a double-stranded target DNA molecule (Voskoboynik et al., 2013). A primer and a polymerase are annealed to one of the adaptors, followed by library loading
onto a specialized flow cell containing up to 8000000 picolitre wells9
called Zero Mode Waveguides (ZMWs). In each ZMW, a modified DNA polymerase is immobilized at the bottom, where it replicates the target DNA. During the replication process, the incorporation of fluorescently labeled nucleotides produces fluorescence signals upon excitation by a laser and a camera system records the color and duration of the emitted light in real time. An overview of the SMRT sequencing approach is given in panel Aa of Figure 5. The time between nucleotide incorporations is also recorded, which is delayed when a nucleotide epigenetically modified (e.g. 6-methyladenosine) is incorporated, allowing the detection of base modifications. The approach is shown in panels A, B and C of Figure 6.
While initially the average read length was relatively short (⇠1500 bases) and the average error rate high (⇠13%) (Quail et al., 2012), over recent years the average read length has increased more than tenfold and the introduction of the Circular Consensus Sequence (CCS) technology for molecules up to 2 kilobases have strongly improved their overall accuracy (⇠ 99.8%) (Wenger et al., 2019). The CCS technology is based on the idea that, as the SMRTbell forms a closed circle, after the polymerase replicates one strand of the target DNA, it can continue using the adaptor and then the other strand as a template. If the lifetime of the polymerase is long enough, both strands can be sequenced multiple times in a single Continuous Long Read (CLR). CLR sequences originate from multiple passes and can be split into multiple
9https://www.pacb.com/products-and-services/
1.3. Third Generation Sequencing subsequences by simply recognizing and cutting out the adaptor
sequences. A consensus sequence10 of the subsequences can then
be formed (i.e. the CCS).
1.3.2 Nanopore Sequencing
The first attempt at using nanopores in a membrane to sequence single-stranded DNA molecules was done at the end of the 1980s (Deamer et al., 2016) but, due to technical limitations, the first successful sequencing results were reported only in 2012 (Man-rao et al., 2012). In 2014 Oxford Nanopore Technologies (ONT) released the MinION, a pocket-sized sequencing device using nanopores as biosensors (Ip et al., 2015), which lowered the cost
of a sequencing run down to 1000$11.
Nanopore sequencing occurs in a flow cell in which two ionic solution-filled compartments are separated by a membrane with
up to 1200012 individual nanopores incorporated. A costant
volt-age bias is applied, which generates an ionic currentli through each nanopore and, upon translocation of a DNA molecule, changes in the ionic current can be observed and characterized (Bolognini et al., 2019). The first results demonstrating the feasibility of nanopore sequencing were obtained using ↵-hemolysin pores (Jetha et al., 2009) but the first real nanopore sequencing results were obtained using the MspA pores (Laszlo et al., 2016) and currently CsgG pores are used (Carter and Hussain, 2017). After library preparation, where each DNA fragment is
end-repaired and ligated to a proper adaptor13, double-stranded DNA
is unwound at the pore, after which one strand passes in and is translated into an actual sequence of bases. An overview of the nanopore-based sequencing strategy is given in panel Ab of Figure 5.
The observed shifts in voltage depend on which part (i.e.
k-10A DNA consensus sequence is a theoretical representative nucleotide
sequence in which each nucleotide is the one which occurs most frequently at that site in the different sequences which occur in nature.
11https://nanoporetech.com/products/minion
12https://nanoporetech.com/products/promethion.
13DNA–protein complex with a tightly bound helicase enzyme that ensures
mer14) of the DNA molecule flows through the pore at a certain
time. Rather than having four possible signals (i.e. one for each nucleotide), the sequencing device has thousands (i.e. one for each possible k-mer), as it also takes into account signals from epigenetically-modified bases, as shown in panels D, E and F of Figure 6.
In contrast to SMRT sequencing, read length in nanopore sequenc-ing is not limited by the technology itself but rather by the length of the DNA molecules to be sequenced. Thus, by using dedicated protocols, ultra-long reads can been obtained. A major drawback of nanopore sequencing is that the high error rate (⇠13%) of the sequenced reads can’t be reduced by sequencing the same strand multiple times, as with SMRT sequencing. In order to increase the accuracy, ONT developed a method to sequence both strands
of a double-stranded DNA molecule. In this method, called 1D2
as opposed to the 1D system described above, an adaptor with a specialized sequence promotes the entry of the second strand into the pore after the first strand has passed through.
How-ever, a small boost in terms of accuracy15 comes at the cost of a
lower throughput, as both strands of each molecule are sequenced, doubling the consumption of the pore. More interestingly, an approach to mimic CCS from PacBio has been reported, which uses the 29 polymerase to produce a tandem array of copies of the original DNA molecule (Li et al., 2016).
1.3.3 Synthetic Long Reads
Unlike true sequencing platforms, Synthetic Long Reads (SLR) technologies rely on a system of barcoding to associate fragments that are sequenced on existing short-read sequencers. Currently, the Illumina SLR sequencing platform and the 10X Genomics emulsion-based system exist, which show similarities with the the earlier BAC-by-BAC sequencing, where a set of overlapping Bacteria Artificial Chromosome (BAC) clones is ordered along the chromosomes of a target genome followed by shotgun sequencing
14k-mers are subsequences of length k contained within a biological
se-quence. 5-mers signals are currently registered by ONT sequencers (Lu et al., 2016).
15https://nanoporetech.com/about-us/news/
1.3. Third Generation Sequencing of each clone individually (Venter et al., 1996).
With the Illumina SLR system, genomic DNA is sheared into fragments up to 10 kilobases long and ligated to adaptors that are
used to denote the extremities of contigs16 during downstream
short-read assembly. These large fragments are then partitioned into a microtiter plate (⇠3000 fragments per well) and undergo further shearing and barcodes addition through a tagmentation
process17, with each weel containing a single barcode. The DNA
is then pooled and subjected to classical Illumina sequencing fol-lowed by local assembly to reconstruct the original long fragments. The Illumina SLR sequencing approach is illustrated in panel Ba of Figure 5. Although still supported, the Illumina kit for SLR
sequencing has been recently discontinued18.
In the 10X Genomics emulsion-based sequencing, DNA fragments of up to ⇠100 kilobases are formed and mixed into micelles called Gel Bead-In EMulsions (GEMs). Within each GEM, a gel bead dissolves and smaller fragments of DNA are amplified from the original large fragments, each with a barcode identifying the source GEM. Barcoded fragments are then pooled, followed by classical Illumina library preparation and sequencing. The obtained reads are assembled to form a series of anchored fragments that can
span up to ⇠80 kilobases19. Unlike the Illumina system, this
ap-proach does not attempt gapless, end-to-end coverage of a single DNA fragment but relies on linked-reads, with dispersed, small fragments that are derived from a single long molecule sharing a communal barcode. Although these fragments leave segments of the original large molecule without any coverage, the gaps are overcome by ensuring that there are many long fragments from the same genomic region in the initial preparation, thus generating a read cloud wherein linked-reads from each long fragment can be stacked, combining their individual coverage into an overall map. An overview of the SLR sequencing strategy using linked-reads is
16A contig is a series of overlapping DNA sequences used to make a physical
map that reconstructs the original DNA sequence of a chromosome or a region of a chromosome.
17Transposon cleaving and tagging of the double-stranded DNA with a
universal overhang.
18https://emea.illumina.com/science/technology/
next-generation-sequencing/long-read-sequencing.html.
given in panel Bb of Figure 5.
Long-read sequencing methods are frequently used to complement previous short-read strategies in assemblies. A major example is the human genome. Indeed, despite it is considered to be one of the most complete mammalian reference assemblies, more than 160 euchromatic gaps remained after the 1000 Genomes Project (Nothnagel et al., 2011), often enriched for repeated sequences and high GC content (Schmidt and Pearson, 2016). Thanks to SMRT sequencing, most of these were either closed or extended, more than 1 megabase of sequence was added and tens of thousands of structural variants were resolved (Chaisson et al., 2015). SMRT is a great strategy to overcome the low accuracy of SGS in extremely repetitive and GC-rich regions, which is also confirmed by the fact that kilobases-long repeated stretches of CGG implicated in the Fragile-X Syndrome (FXS) have been resolved and further characterized using SMRT sequencing (Loomis et al., 2013; Ardui et al., 2017).
Concerning ONT devices, the low throughput of MinION ini-tially limited its use to the sequencing and assembly of small bacterial genomes (Loman et al., 2015). More recently, with the introduction of higher throughput platforms (i.e. GridION and PromethION), assemblies of larger genomes have been reported, including human (Jain et al., 2018a). In this study, reads up to 882 kilobases long were obtained. Comparative studies suggest that SMRT and nanopore sequencing perform similarly well for de novo genome assembly (Giordano et al., 2017), with the ultra-long nanopore reads enabling the measurement of telomere repeats, which is not possible with the shorter SMRT reads.
Thus, a particular strength of nanopore ultra-long reads is the resolution of extremely long repeated regions that can be resolved with no other technology. In 2004, Rudd and collegues demon-strated that even the most complete human assembly exhibited a lack of centromeric sequences that comprise hundreds or thousands of repeats of ↵-satellite monomers (Rudd and Willard, 2004). Re-cently, Jain and collegues succeeded in producing nanopore reads long enough to cover the hundreds of kilobase-long centromeric sequences of the human Y chromosome (Jain et al., 2018b). Overall, SLR can resolve certain types of repetitive elements
(Mc-1.4. Repetitive DNA Coy et al., 2014) while have difficulties in resolving more tandemly arranged repetitive sequences, as this system relies on the local as-sembly of short reads. Although less suitable for sequencing highly repetitive regions, SLR approaches are well suited for genome phas-ing, where the high level of accuracy is clearly an advantage in phasing Single-Nucleotide Polimorphisms (SNPs).
1.4 Repetitive DNA
Pioneering work by Britten and Kohne revealed that, in addi-tion to unique sequences, the eukaryotic genomes contain large quantities of repetitive DNA, which was initially classified into moderately or highly repetitive sequences according to their degree of repetitiveness (Britten and Kohne, 1968). Later, the repetitive DNA sequences were grouped according to other criteria such as
their organization (tandemly arrayed20 or dispersed21) or their
functional role. Although repetitive DNA sequences include sev-eral types of protein-coding sequences, most of the repetitive part of the genome was earlier considered junk DNA with no known function (López-Flores and Garrido-Ramos, 2012). Today, with many genomes completely sequenced and the background research of more than 40 years, we have ample information on the sig-nificance of the repetitive DNA within eukaryotic genomes and concepts are changing.
As shown in Figure 7, approximately 50% of the human genome is comprised of repeats. Among Tandem Repeats (TRs) there are both moderately repetitive DNA, such as ribosomal DNA (rDNA), and highly repetitive microsatellite, minisatellite and satellite DNA.
rDNA genes are among the best-known examples of multigene
families, i.e. groups of paralogous genes22, and encodes the major
20DNA repeats that are adjacent to each other and can involve as few as
two copies or many thousands of copies.
21Identical or nearly identical DNA sequences that are separated by
hun-dreds, thousands or even millions of nucleotides in the source genome.
22Class of homologous genes (i.e. genes that appear in multiple creatures,
because they derive from a common evolutionary ancestor), resulting from one or more duplication events. After duplication, the paralogous genes can keep the same function (e.g. the rDNA genes) but can also diverge and develop different functions.
ribosomal RNAs (rRNAs).
Microsatellites are TRs in which the repeat unit contains from 1 to 6 bases, thus being also known as Short Tandem Repeats (STRs). Approximately 1 million STR loci have been found in both protein-coding and non-protein-coding regions, including regulatory sequences (Liu et al., 2019). Dinucleotides are the foremost type of
microsatel-lite repeats for many species, with the most common dinucleotide
repeat type in the human genome being (CA)n/(GT)n.
Microsatel-lites have a characteristic mutational behavior and their mutation rates are 10 to 100000 times higher than average mutation rates in other parts of the genome (Gemayel et al., 2010). Mutations are mainly due to contractions or expansions in the number of repeat units, caused either by strand-slippage during DNA replication or unequal crossing over. Moreover, mutation rates vary between different microsatellites depending on: (1) the number of repeat units. In particular, the more repeat units, the more unstable the microsatellite, as longer loci are more likely to mispair during DNA replication (Lai and Sun, 2003). (2) the repeat purity. Inter-rupted microsatellite repeats have lower mutation rates than pure repeats, which might be due to a lower rate of mispairing between non-identical repeat units (Shah et al., 2010). (3) the length of the repeat unit. Microsatellite arrays containing longer repeat units evolve faster than those containing shorter units (Chakraborty et al., 1997), probably due to relatively inefficient repair of larger mismatched segments by cell-repair processes. Thanks to these characteristics, microsatellites provide a tool for the estimation of genetic variability within populations and a valuable approach to analysis of parentage. Indeed, their high mutation rates lead to a large number of alleles existing in a single locus, so that unrelated individuals are unlikely to share alleles, and they are codomi-nant, which allows for exact genotyping and more precise genetic comparisons between individuals, because heterozygotes can be distinguished from homozygotes (Webster and Reichart, 2005). In contrast to their historical definition as nonfunctional DNA, microsatellites are currently known to to play a central role both in physiology and pathology. On the one hand, microsatellites are involved in a range of functions such as chromatin organization, regulation of gene activity, recombination, DNA replication, cell cycle, mismatch repair system (Li et al., 2002). On the other, an expansion of the number of repeats located in coding as well as
1.4. Repetitive DNA in untranslated or regulatory regions of specific genes has been identified as the main cause of several neurological diseases, which are further described in Table 1. Moreover, Microsatellite
Insta-bility (MSI)23 has been reported in the sporadic colon, gastric,
sporadic endometrial and the majority of other cancers, with prognostic and therapeutic implications (Nojadeh et al., 2018). Minisatellites are defined as TRs with a repeat unit longer than 6 bases (Näslund et al., 2005). Minisatellites can be either monomor-phic or polymormonomor-phic, with the latter also known as Variable Num-ber of Tandem Repeats (VNTRs). Although VNTRs were the first highly polymorphic markers described for the genetic anal-ysis of human traits (Nakamura et al., 1987), they have been soon replaced by microsatellite markers mainly beacuse, while microsatellites are widespread in the genome and easier to clone and characterize, VNTRs are concentrated mostly in the telomeric regions of chromosomes (Vergnaud et al., 1993). More recently, there has been renewed interest in VNTRs, with the realization that they might have important functional roles. For example, it has been shown that VNTRs regulates the expression of spe-cific genes (Michelhaugh et al., 2001) and influence tranlsation efficiency (Nakamura et al., 1998).
Lastly, satellite DNA (satDNA) has commonly repeated unit lengths of about 150–180 bases or 300–360 bases and is the main component of the heterochromatin, which is found specifically at pericentromeric and subtelomeric locations of the chromosomes (Garrido-Ramos, 2017). As for microsatellites and minisatellites, in the last few decades results from different studies point to a functional significance of satDNA. These functions include a role in the establishment and maintenance of chromatin states by promot-ing heterochromatin assembly, influencpromot-ing gene expression, and contributing to epigenetic regulatory processes, as satellite repeats transcribe and are a source of short interfering RNA molecules (Ugarkovic, 2005).
Among dispersed repeats, Transposable Elements (TEs) stand out.
Transposable elements are DNA sequences that are able to move
23A unique molecular alteration and hyper-mutable phenotype, which is
the result of a defective DNA mismatch repair system, and can be defined as the presence of alternate sized repetitive DNA sequences which are not present in the corresponding germ line DNA.
from one chromosomal position to another within the same genome and are divided into retrotransposons, which are transposed
through an RNA intermediate24, and DNA transposons, which can
move without any RNA intermediate. Accordingly to Wicker and collegues, retrotransposons can be further classified into: (1) Long Terminal Repeat (LTR) retrotransposons; (2) Dictyostelium Inter-mediate Repeat Sequence (DIRS) retrotransposons; (3) non-LTR retrotransposons or Long Interspersed Nuclear Elements (LINEs); (4) Penelope-Like Element (PLE) retrotransposons; (5) Short In-terspersed Nuclear Elements (SINEs) (Wicker et al., 2007). The most obvious effect of the mobility of TEs is the induction of inser-tional mutations which are a major source of genetic innovation and evolution but have also been found involved in several genetic diseases (Cordaux and Batzer, 2009) and cancer as well (Konkel and Batzer, 2010). In addition, the ectopic recombination be-tween non-allelic homologous elements can generate various types of rearrangements and lead to inversions, deletions, translocations or duplications.
As mentioned above, repeats pose several challenges for both genome resequencing and de novo assembly projects using SGS technologies. A more detailed discussion of these challenges as well as of the computational strategies for solving repeat-induced analysis problems with SGS is given as follows, together with an overview of the most recent TR callers for SGS.
1.4.1 Genome Resequencing
Genome resequencing allows researchers to study genetic variation by mapping reads from a sequenced individual to a high-quality reference genome of the same species. Several aligners for short reads are available, some of which are listed in Table 2. A major problem for short-read aligners is trying to decide what to do with reads that map to multiple locations (i.e. the multi-reads), such as reads coming from repeated regions. The percentage of short reads that map to a unique location on the human genome is typically reported to be ⇠80%, although this number varies depending on the read length, the sequencing protocol (e.g. the
24The RNA is transcribed from the element, then reverse transcribed into
1.4. Repetitive DNA availability of paired-end reads) and and the sensitivity of the aligner used (Treangen and Salzberg, 2012). However, the repeat content in the human genome is ⇠50%. This discrepancy mainly depends on that most repeats are inexact, which implies that they will have a unique best match even if the same sequence occur with slight variations in other locations, as shown in panel A of Figure 8. Assigning reads to the location of their best alignment, is the simplest way to resolve repeats, although it is not always correct. For example, assume that the same read map to two locations, A and B, where the read aligns with one mismatch at A and with one deletion at B. If the aligner considers mismatches more likely to happen than deletions, then it will put the read in location A. However, if the source DNA has a true deletion, then the read would perfectly match position B. This true-to-life problem, that is inherent in the process of aligning reads to a reference genome, is also illustrated in panel B of Figure 8. Indeed, widely-used mappers are mostly based on the Needleman–Wunsch and Smith–Waterman algorithms (Nalbantoğlu, 2014) and each attributes different scores to mismatches, gap opening and gap extending, resulting in different alignments for the same sequences. Another problem comes out when a genome sample is sequenced, but only analysis of the variants that are present in a certain chromosome is required. The most straightforward approach would be to use a short-read aligner to map reads directly to that chromosome, which lead to a large pile up of reads from repetitive regions, because all reads from those repeats would have to go to the same chromosome. In order to avoid this bias, the reads must me mapped against the entire genome and a strategy of random placement of multi-reads to scatter them uniformly across all repeat copies must be applied.
Essentially, aligners have three choices for dealing with multi-reads: (1) ignore multi-reads, meaning that all multi-reads are discarded. This strategy is usually achieved by applying specific filters during the alignment step (e.g. by setting the ambiguous parameter to toss on BBMap (Bushnell, 2014)) or by post-processing the aligned Sequence Alignment/Map (SAM)/Binary Alignment Map
(BAM)25 file (e.g. by filtering on the mapping quality for a
SAM/BAM generated with Bowtie2 (Langmead and Salzberg,
2012) or by retaining only reads with the XT:A:U tag from a SAM/BAM generated with BWA (Li and Durbin, 2009)). This strategy limits analysis to unique regions in the genome, discarding many multigene families as well as all repeats, which might result in biologically important variants being missed. (2) retain the the alignment with the fewest mismatches, i.e. the best match. If there are multiple, equally good matches, then an aligner will either choose one at random or report all of them. By default, most aligners use a pseudo-random number generator to choose which read to retain in a set of equally-good choices but filters can be applied to report all reads in the set (e.g. by using the -a parameter in Bowtie2). This approach is the only one that can provide a reasonable estimate of coverage. (3) report all alignments up to a maximum number, regardless of the total number of alignments found (e.g. by setting an upper limit to the -k parameter in Bowtie2). Allowing multi-reads to map to all possible positions avoids making a possibly erroneous choice about read placement.
Overall, choosing what alignment strategy to use is of fundamental importance, as it influences downstream tools for variant discovery.
1.4.2 De Novo Genome Assembly
Genome assembly algorithms attempt to reconstruct a genome as completely as possible exploiting starting from a set of sequenced reads. As explained in the previos sections, short reads from SGS make assembly extremely difficult in repetitive regions. Indeed, repeats that are longer than the read length create gaps in the assembly and, as a result, genome assemblies based on SGS are much more fragmented than assemblies based on Sanger sequenc-ing (Schatz et al., 2010). In addition to creatsequenc-ing gaps, repeats can be erroneously collapsed on top of one another, causing complex
misassemblies26. However, assemblers that use short reads are
available, which are based either on string-overlap graphs (e.g. SAGE (Ilie et al., 2014)) or De Bruijn graph (e.g. ABySS (Jack-man et al., 2017)). Assemblers from both groups create graphs
26Assembled regions that contain significantly large variations that are
the result of wrong decisions made by the assembly program. These errors can be easily misconstrued as true genetic variation, misleading a range of genomic analyses (Muggli et al., 2015).
1.4. Repetitive DNA from the reads and then traverse these graphs in order to recon-struct the original genome. From a technical perspective, repeats cause branches in these graphs, and assemblers must then make a guess as to which branch to follow, with incorrect guesses creating false joins and erroneous copy numbers. Conservative assemblers break the assembly at branch points, leading to more accurate but fragmented contigs. Some problems assemblers can run into are summarized in Figure 9. A common error is the creation of a rearrangement by joining two chromosomal regions that do not belong near one another (Figure 9, panel A). Even if all the reads align well to the misassembled genome, mate-pair constraints are violated (i.e. wrong expected distance and orientation of the paired-end reads). Other common issues are the creation of collapsed repeats, where read alignments remain consistent but mate-pair distances are compressed (Figure 9, panel B), and the creation of collapsed interspersed repeats (Figure 9, panel C). In addition to using mate-pair information from reads that were sequenced in pairs, assemblers exploits statistics on the depth of coverage, which is useful to identify the repeats themselves. Assuming that a genome is uniformly covered, repetitive regions have substantially deeper coverage, which allows the assemblers to identify and process them differently. In particular, repeats are usually assembled after unique regions, and assemblers may require multiple paired-end reads to link a repetitive contig to a unique one.
1.4.3 Short-Read Tandem Repeat Callers
Standard variant-calling pipelines for genome resequencing (e.g. Pindel (Ye et al., 2009)) and de novo assembly projects (e.g. Fer-miKit (Li, 2012)) classify alterations in repeated regions either as indels or SVs, depending on their size. However, specialized tools that can profile TRs (i.e. identify their motif and multiplicity), have been developed over years, mainly for STRs.
Most STR callers require a previous knowledge of the STR loci to look for. Defined STR loci are available for each release of
the human genome27 and are based on calls from Tandem
Re-27http://hgdownload.cse.ucsc.edu/goldenPath/hg19/bigZips/
peats Finder (TRF) (Benson, 1999). TRF is a robust tool that can detect repeats with pattern size in the range from 1 to 2000
bases from FASTA28 inputs. The program first uses a set of
statistically based criteria to find candidate TRs, then attempts to produce an alignment for each candidate and, if successful, gathers a number of statistics about the alignment (e.g. matching probability and indel probability) and the nucleotide sequence (e.g. base composition and sequence entropy). TRF is based on Bernoulli distribution. In particular, the tool models alignment of two tandem copies of a pattern of length n by a sequence of n independent Bernoulli trials (i.e. coin tosses). Each head in the Bernoulli sequence is interpreted as a match between aligned nucleotides and each tail is a mismatch, an insertion or a deletion. The matching probability represents the average percent identity between the copies, while the indel probability specifies the aver-age percentaver-age of insertions and deletions.
One of the first successful STR profiler for SGS was LobSTR (Gymrek et al., 2012). The algorithm of LobSTR has three steps: (1) scan genomic libraries, flag informative reads that fully en-compass known STR loci, and characterize their sequence. This procedure relies on a signal processing approach that uses rapid entropy measurements to find informative STR-containing reads, followed by a Fast Fourier Transform to characterize the repeat sequence. In practice, each sequenced read is break into over-lapping windows of a fixed length and a fixed nucleotide overlap between consecutive windows. When a read displays a series of windows with entropy below a predefined treshold, then that read is considered informative and further processed through a Fast Fourier Transform to identify the repeat unit size, k. The algo-rithm further determines the actual STR sequence by means of a rolling hash function that records all possible k-mers in the STR region: the most frequently occurring k-mer is set to be the repeat unit of the STR. (2) alignment. The aim of the alignment step is to reveal the identity and the repeat length of a STR-containing read. To this purpose, LobSTR employs a divide-and-conquer approach. It separately anchors the upstream and downstream flanking regions of STR-containing sequence reads, without
map-28https://blast.ncbi.nlm.nih.gov/Blast.cgi?CMD=Web&PAGE_
1.4. Repetitive DNA ping the STR region itself. This procedure identifies the genomic location of the STR and reveals the repeat length by measuring the distance between the flanking regions. (3) allelotyping. The most likely alleles at each STR locus are identified by integrating informations from all aligned reads and the expected stutter noise, calculated through a generative approach based on the repeat unit size.
A major drawback of the first TR profilers for SGS is that they are constrained to STR alleles with repeat lengths smaller than the read length employed in the sequencing (i.e. ⇠150 bases). More re-cently, TR callers for SGS have emerged which have demonstrated the ability to detect repeat expansions where the expanded allele size is greater than the length of standard short-read sequencing reads and even the read pair fragment length. These tools include ExpansionHunter (Dolzhenko et al., 2019), STRetch (Dashnow et al., 2018), exSTRa (Tankard et al., 2018), TREDPARSE (Tang et al., 2017) and GangSTR (Mousavi et al., 2019). All require paired-end alignments and a catalog of known STRs.
ExpansionHunter extracts STR-containing reads from a given alignment file and realigns them using a graph-based model rep-resenting the STR structure at each STR locus. In particular, the STR structure is specified using a restricted subset of the regular expression syntax. For example, the HTT repeat region linked to Huntington Disease (Table 1) can be defined through
the expression (CAG)*CAACAG(CCG)*, which means that it
harbors variable numbers of the CAG and CCG repeats sepa-rated by a CAACAG interruption. Similarly, the FXN repeat
region linked to the FRDA corresponds to expression (A)*(GAA)*
and the ATXN8 repeat region linked to SCA8 corresponds to
(CTA)*(CTG)*. The regular expressions are allowed to contain
degenerate base symbols, making it possible to represent certain classes of imperfect DNA repeats where different bases may occur at the same position. Then, ExpansionHunter translates each regular expression into a sequence graph, with nodes that cor-respond to sequences and directed edges that define how these sequences can be connected together to assemble different alleles. Genotyping of the sequenced individual is performed by analyzing the alignment paths associated with the presence or absence of each constituent allele.