18
3D change detection analysis of a coastal landslide performed
by multi-temporal point cloud comparison
Giuseppe Esposito
1,4*, Riccardo Salvini
2, Maria Danzi
5, Fabio Matano
3, Marco Sacchi
3,
Marcello Seddaiu
2, Renato Somma
4, Umberto Tammaro
4, Claudia Troise
4& Giuseppe De Natale
41Tuscan Earth Sciences PhD program, Centre of Geotechnologies (CGT) - University of Siena, Italy
2Department of Environment, Earth and Physical Sciences and CGT - University of Siena, Italy 3
Institute for Coastal and Marine Environment (IAMC-CNR), Naples, Italy
4 Vesuvius Observatory - National Institute of Geophysics and Volcanology, Naples, Italy 5 Geofotogrammetrica, Via Gemito 3, 80128 Naples, Italy
Key words: photogrammetry, point cloud, change detection, coastal cliff, landslide.
The structure from motion (SfM) photogrammetric technique (FONSTAD et al., 2013) has become a suitable method to obtain high resolution topography data in a wide range of geomorphic environments (PASSALACQUA
et al., 2015). SfM is designed to reconstruct the three-dimensional geometry of buildings and objects from randomly acquired images, and represents a low cost option respect to traditional photogrammetric and lidar techniques (FONSTAD et al., 2013). In this way, also the 3D geometry of complex natural surfaces can be achieved with a horizontal and vertical accuracy which depend on the choice of sensor for images acquisition, platform (e.g., UAV, boat, vehicle), and method of assignment of geodetic coordinates to the digital data. In advanced geomorphic applications, repeated photogrammetric surveys at different times allow to detect topographic changes in order to map or monitor erosion, deposition and develop sediment budgets.
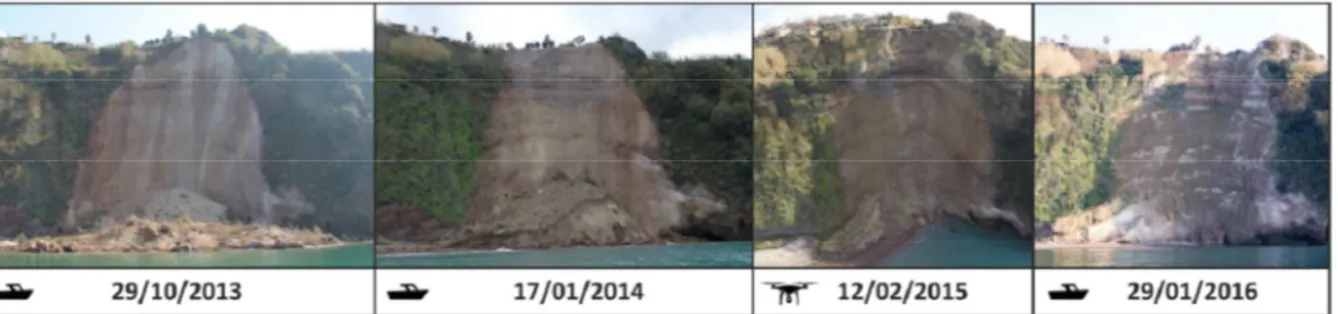
In this work we present a 3D change detection analysis related to a coastal landslide occurred on 27th October 2013 along the coastal sector of the Campi Flegrei volcanic district, Southern Italy (ESPOSITO et al., 2015). A total of four photogrammetric surveys have been carried out in about two years (Fig. 1), by using a UAV platform for one survey and boats for the other three. In order to accurately define the exterior orientation of images, a topographic survey was also carried out, measuring a series of natural and artificial ground control points external to the landslide area with a long-range Total Station. Images were processed using Agisoft PhotoScan® (http://www.agisoft.com), and 3D point clouds were compared through the "Multiscale Model to Model Cloud Comparison (M3C2)" plugin (LAGUE et al., 2013) included in CloudCompare open source software (http://www.danielgm.net/cc/). The plugin allowed us to estimate orthogonal distances between multi-temporal point clouds as well as uncertainty related to each distance measurement.
Figure 1: Some images of the landslide captured during the four photogrammetric surveys. Boat and UAV symbols are included to indicate the type of platform used for image acquisition.
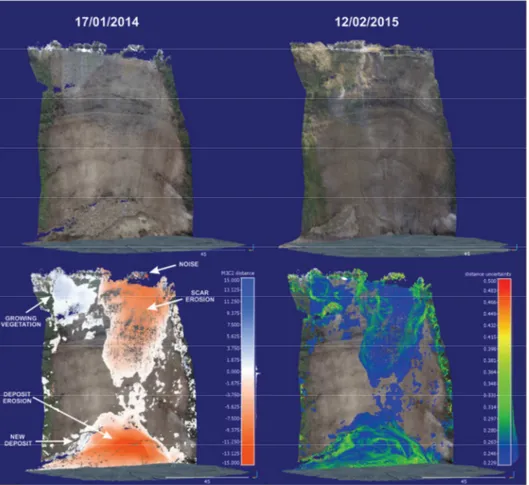
SfM processing of each survey resulted in dense point clouds and high-resolution orthophotos. An average co-registration error between clouds was estimated as 11 cm. As output of the M3C2 distance computation we obtained three new clouds in which each point was characterized by distance and uncertainty attributes (Fig. 2). Points corresponding to statistically significant changes were exported and interpolated in ESRI ArcGis® for volume calculation. Volumetric data show that the landslide deposit at cliff toe was progressively eroded by the sea, while landslide scar was affected by a moderate erosion in the first three months after the 2013 landslide event, as well as by a deep erosion between the second and third surveys.
Nevertheless, a negligible eroded volume between 2015 and 2016 surveys was estimated in this area. Deposited sediments decreased through time in the whole landslide area so that, generally, a geomorphic evolution moving
2nd Virtual Geoscience Conference, Bergen, Norway 21-23 September 2016, Virtual Outcrop Geology Group, Uni Research CIPR
19
towards an equilibrium condition seems to be taking place. The study here described highlights a high potentiality of the SfM and cloud-to-cloud distance computation techniques in geomorphology, both for accurate qualitative and quantitative analysis and for hazard and risk assessment. The studied landslide threats indeed a series of residential buildings located close to the retreating cliff edge.Figure 2: Example of RGB coloured 3D point clouds (top) and M3C2 processed clouds (bottom). Histograms of both distance (bottom left) and uncertainty data (bottom right) from multi-temporal comparison are showed on the right side of the colour scale. White arrows indicate geomorphic features highlighted by the 3D change detection analysis.
References
ESPOSITO, G., SALVINI, R., SACCHI, M. & MATANO, F., 2015. A geomatic approach for emergency mapping of shallow landslides. Rendiconti Online della Società Geologica Italiana, 35: 121-123.
FONSTAD, M.A., DIETRICH, J.T., COURVILLE, B.C., JENSEN, J.L. & CARBONNEAU, P.E., 2013. Topographic structure from motion: a new development in photogrammetric measurement. Earth Surface Processes and Landforms, 38: 421-430. LAGUE, D., BRODU, N. & LEROUX, J., 2013. Accurate 3D comparison of complex topography with terrestrial laser scanner: application to the Rangitikei canyon (N-Z). ISPRS Journal of Photogrammetry and Remote Sensing, 82: 10-26.
PASSALACQUA, P., BELMONT, P., STALEY, D. M., SIMLEY, J. D., ARROWSMITH, J. R., BODE, C. A., CROSBY, C., DELONG, S. B., GLENN, N. F., KELLY, S. A., LAGUE, D., SANGIREDDY, H., SCHAFFRATH, K., TARBOTON, D. G., WASKLEWICZ, T. & WHEATON, J. M., 2015. Analyzing high resolution topography for advancing the understanding of mass and energy transfer through landscapes: A review. Earth Science Reviews, 148: 174-193.