Genome-wide association study between
CNVs and milk production traits in Valle del
Belice sheep
Rosalia Di GerlandoID1*, Anna Maria Sutera1, Salvatore MastrangeloID1, Marco Tolone1, Baldassare Portolano1, Gianluca SottileID2, Alessandro Bagnato3, Maria
Giuseppina StrillacciID3, Maria Teresa Sardina1
1 Universitàdegli Studi di Palermo, Dipartimento di Scienze Agrarie, Alimentari e Forestali, Italy, 2 Università degli Studi di Palermo, Dipartimento di Scienze Economiche, Aziendali e Statistiche, Italy, 3 Universitàdegli Studi di Milano, Dipartimento di Medicina Veterinaria, Italy
Abstract
Copy number variation (CNV) is a major source of genomic structural variation. The aim of this study was to detect genomic CNV regions (CNVR) in Valle del Belice dairy sheep popu-lation and to identify those affecting milk production traits. The GO analysis identified possi-ble candidate genes and pathways related to the selected traits. We identified CNVs in 416 individuals genotyped using the Illumina OvineSNP50 BeadChip array. The CNV associa-tion using a correlaassocia-tion-trend test model was examined with the Golden Helix SVS 8.7.0 tool. Significant CNVs were detected when their adjusted p-value was<0.01 after false dis-covery rate (FDR) correction. We identified 7,208 CNVs, which gave 365 CNVRs after aggregating overlapping CNVs. Thirty-one CNVRs were significantly associated with one or more traits included in the analysis. All CNVRs, except those on OAR19, overlapped with quantitative trait loci (QTL), even if they were not directly related to the traits of interest. A total of 222 genes were annotated within the significantly associated CNVRs, most of which played important roles in biological processes related to milk production and health-related traits. Identification of the genes in the CNVRs associated with the studied traits will provide the basis for further investigation of their role in the metabolic pathways related to milk pro-duction and health traits.
Introduction
The availability of several forms of DNA variants, such as single nucleotide polymorphisms (SNPs) and copy number variants (CNVs), has played an important role in phenotypic varia-tion studies. Most genetic and genome-wide associavaria-tion studies (GWAS) have investigated the associations between SNPs as genetic variants and complex and economically important traits, with the aim of identifying subsets of markers able to explain traits [1–5]. CNVs are polymor-phic genomic regions, including deletions, duplications and insertions that involve DNA seg-ment ranging from 1 kb to several Mb, that vary compared to a reference genome [6]. CNVs
a1111111111 a1111111111 a1111111111 a1111111111 a1111111111 OPEN ACCESS
Citation: Di Gerlando R, Sutera AM, Mastrangelo S, Tolone M, Portolano B, Sottile G, et al. (2019) Genome-wide association study between CNVs and milk production traits in Valle del Belice sheep. PLoS ONE 14(4): e0215204.https://doi.org/ 10.1371/journal.pone.0215204
Editor: Roberta Davoli, Universita degli Studi di Bologna, ITALY
Received: May 29, 2018 Accepted: March 28, 2019 Published: April 23, 2019
Copyright:© 2019 Di Gerlando et al. This is an open access article distributed under the terms of theCreative Commons Attribution License, which permits unrestricted use, distribution, and reproduction in any medium, provided the original author and source are credited.
Data Availability Statement: All relevant data are within the manuscript and its Supporting Information files.
Funding: This work was supported by the Ministero Istruzione Università e Ricerca PON02_00451_3133441, CUP:B61C1200076005 to BP. The funder had no role in study design, data collection and analysis, decision to publish, or preparation of the manuscript.
Competing interests: The authors have declared that no competing interests exist.
have been shown to be associated with complex traits in several species, including chimpanzees [7], rats [8], and mice [9], and in livestock species such as cattle [10–14], goats [15], and pigs [16,17]. Like SNPs, these genomic structural variations are considered as important genetic markers of phenotypic variation for complex traits. CNVs have recently been used as markers of phenotypic variation, environmental adaptability, and for economically important traits or disease susceptibility in livestock species [18–20]. However, few studies on CNVs have been published for sheep. Some previous studies [21–23] analyzed CNVs based on comparative genome hybridization arrays, while others [24–27] detected CNVs using SNP microarrays. GWAS using CNVs and phenotypes have been developed in cattle breeds [19,20,28–31] and in swine [32,33]. However, to the best of our knowledge, no GWAS between CNVs detected using the OvineSNP50K BeadChip array and economically important traits (milk, meat, etc) in sheep breeds have been published.
In the current study, we carried out for the first time a GWAS between CNVs and milk-production traits in sheep, with the aim of detecting genomic regions including CNVs affect-ing these traits.
Methods
Ethics statement
Blood samples were collected from sheep by trained veterinarians. All the procedures were approved by the Organismo Preposto al Benessere Animale of the University of Palermo, in agreement with the recommendations of European Union Directive 2010/63/EU, to ensure appropriate animal care.
Sampling and genotyping
A total of 468 of Valle del Belice sheep from four flocks in Agrigento province (Sicily) were used in this study. About 10 mL of blood was collected from the jugular vein using vacutainer tubes containing EDTA as anticoagulant. Genomic DNA was extracted from blood samples using a salting-out method [34]. DNA amounts for each sample were quantified with Nano-Drop ND-1000 spectrophotometer (NanoNano-Drop Technologies, Wilmington, DE, USA), diluted to a final concentration of 50 ng/μl (as required by the Illumina Infinium protocol), and stored at 4˚C until use. Genotyping was performed using the Illumina OvineSNP50K BeadChip v2 array containing 54,241 SNPs. The positions of the SNPs on the chromosomes were deter-mined from the ovine Oar_v3.1 genome assembly. All the 468 genotyped individuals passed the quality control criteria of call rate > 98%.
Quality control of CNVs. CNVs were detected using Golden Helix SNP & Variation Suite (SVS) 8.7.0 software (Golden Helix, Inc., Bozeman, MT, USA;www.goldenhelix.com). We imported the Log R Ratio (LRR) values for each SNP from GenomeStudio 2.0 software (Illumina Inc.) into SVS.
Unmapped SNPs and sex chromosomes were excluded from the analysis, leaving 52,413 markers for CNV mapping.
Quality assurance of the LRR data and filtering of outlier samples were performed using SVS software, as described by Pinto et al. [35]. The derivate spread log ratio analysis was first used to identify individuals with low-quality LRRs and samples showing genomic waves of LRR signal intensity were subsequently discarded using the genomic wave detection and cor-rection algorithm [36]. Principal component analysis (PCA) was applied to detect and correct for the presence of batch effects and to correct the LRR values. Fifty-two samples were excluded and the remaining 416 were used for CNV detection. All data from GenomeStudio
2.0 software (Illumina Inc.) related to Log R Ratio (LRR) and B allele frequency (BAF) for all individuals are provided in theS1 Dataset.
CNV and CNVR detection. The optimal segmenting (CNAM) module of SVS 8.7.0 was used to identify CNVs using the univariate approach that segments each sample independently [20]. The following options in CNAM were used: univariate outlier removal; maximum num-ber of 100 segments per 10,000 markers; minimum markers per segment 3; 2,000 permutations per pair with a p-value cutoff of 0.005. Individuals with a waviness factor (WF)
−-0.05>WF>0.05 were also excluded, as suggested by Diskin et al. [36]. CNVRs were deter-mined by aggregating overlapping CNVs identified in two or more samples as reported by Redon et al. [37].
Phenotypic data. A total of 5,586 lactation records were collected for 481 Valle del Belice sheep from four different flocks between 2009 and 2015. The following phenotypic data were recorded according to a monthly Test Day (TD) scheme: daily milk yield (MY), milk fat per-centage (FP), fat yield (FY), protein perper-centage (PP), protein yield (PY), and milk somatic cell count (SCC). SCC was log-transformed to give the somatic cell score (SCS), using the formula of Ali and Shook [38]. Data were edited using S.A.S. version 9.2 [39] and individuals with fewer than three test-day records or with missing information for any trait were excluded from the dataset. After editing, the observations were reduced to 5,446 phenotypic measures for each trait for each of the 468 individuals (S2 Dataset).
Breeding values for milk production traits. A single trait repeatability test-day animal model was used to estimate breeding values (EBVs) for the five milk production traits: MY, FY, FP, PY, and PP, and for SCS using the REMLF90 program [40]. Briefly, the model included fixed (i.e. parity, litter size, season of lambing) and random effects (additive genetic, permanent environmental, and herd by test-day interaction effects). Several models were tested to explore how to fit days in milk and to optimize the analysis. Comparisons between the residuals obtained from the different models showed no significant differences (data not shown). Days in milk were then included as a linear covariate in the model to account for lac-tation stage as reported by Leitner et al. [41]. The available pedigree information included 5,175 animals including 180 rams and 2,549 dams. Estimated breeding values for all traits were deregressed (DEBVs) according to Garrick et al. [42] as follows:
DEBV ¼EBV
r2
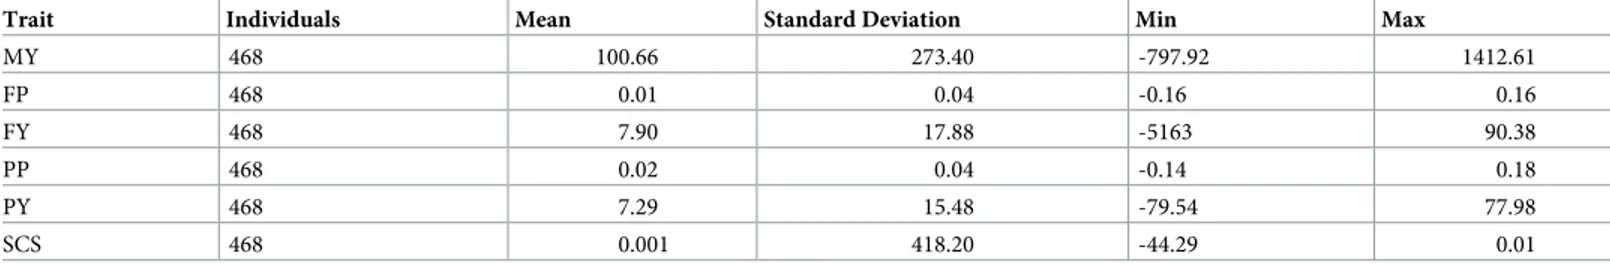
where EBV is the estimated breeding value of each individual considering each milk produc-tion trait and r2is the reliability of that EBV. The DEBVs were considered as more accurate estimates of expected phenotypes and were used as response variables in the GWAS analysis. The descriptive statistics for the DEBVs of each trait are summarized inTable 1.
Genome-wide association study. A total of 416 individuals with both CNVs and DEBVs were applied to the GWAS. Association tests were carried out using the Correlation-trend test’ plugin in SVS 8.7.0 software with PCA correction. Significant CNVs were detected when their adjusted p-value was <0.01 after FDR correction. Only CNVRs from significantly associated CNVs with at least one trait were considered for the annotation step.
Validation of association test. A simulation study to identify/confirm those CNV calls resulted significantly associated with phenotypes of interest was performed by R software 3.5.1 [43]. In order to test the association for each investigated trait, the 70% of observations was randomly sampled from the whole dataset to build a reference dataset. The remaining 30% of observations are used as independent validation dataset useful to identify/confirm the associa-tions or at least the direction of effects. Moreover, for each replicate only those CNVs resulted associated in the reference dataset were used. This splitting procedure was replicated one
hundred times and the association was validated if the CNV was associated both in the refer-ence and the validation dataset at least one time.
Gene contents and functional annotation. The gene content of the CNVRs was assessed usingOvis aries v3.1 in the Genome Data Viewer genome browser (https://www.ncbi.nlm.nih. gov/genome/gdv/browser/?context=gene&acc=101104604).
Moreover, we performed an enrichment analysis using the Sheep Quantitative Trait Locus (QTL) Database (https://www.animalgenome.org/cgi-bin/QTLdb/OA/index) to identify CNVRs that overlapped QTL regions (QTLRs). We removed the QTLRs that were >5 Mb, and only considered those overlapping at least 50% of each CNVR.
We investigated gene function using the DAVID Bioinformatics Resources 6.8 (https:// david.ncifcrf.gov/summary.jsp) for Gene Ontology (GO) analysis and the Kyoto Encyclopedia of Genes and Genomes (KEGG) database (http://www.genome.jp/kegg/pathway.html) for pathway analysis.
Results and discussion
This study investigated a GWAS between CNVs and milk-production traits in sheep. Although this is the first time that a similar study was performed on sheep, several genomic regions including CNVs affecting these traits have been identified. However, considering the relative low number of individuals affecting the power of the association analysis, our results constitute a preliminary report on the association between these markers and quantitative traits in sheep. Therefore, further analysi on a wider sample could provide more robust results and could be of value for future studies.
CNV and CNVR detection
CNAM univariate segmentation of the SVS 8.7.0 with PCA detected 7,208 CNVs (S1 Table) with an average of 17.32 per sample and an average length and median size of 348.1 kb and 231.25 kb, respectively. After aggregating the overlapping CNVs, a total of 365 CNVRs were identified (S2 Table) covering 118.36 Mb, corresponding to 4.8% of the genomic sequence of the autosomes and 4.05% of the total genome length. The average number of CNVs involved in CNVRs was 14.58 per individual, with an average length and median size of 324.27 kb and 172.58 kb, respectively. This is partially due to the fact that the BeadChip SNP50K assay was originally developed for high-throughput SNP genotyping in association studies. Then, the length of the identified CNVRs might be larger due to low density and non-uniform distribu-tion of SNPs in Bead Chip SNP50K as reported by Hou et al. [14]. Forty-three CNVRs only included gains (duplications) and 320 only included losses (deletions). As reported by Prinsen et al. [44] and Liu et al. [24], it is expected that SVS tool detected more losses than gains. This is due to the higher power in methodology to identify homozygous losses (where both copies of a locus are lost) linearly correlated to exponential intensity signals. Similar results in terms
Table 1. Descriptive statistics for DEBVs of the productive and the health traits.
Trait Individuals Mean Standard Deviation Min Max
MY 468 100.66 273.40 -797.92 1412.61 FP 468 0.01 0.04 -0.16 0.16 FY 468 7.90 17.88 -5163 90.38 PP 468 0.02 0.04 -0.14 0.18 PY 468 7.29 15.48 -79.54 77.98 SCS 468 0.001 418.20 -44.29 0.01 https://doi.org/10.1371/journal.pone.0215204.t001
of coverage (141.6 Mb and 5.8% of genomic sequence of autosomes) were obtained by Yan et al. [27] using the Illumina OvineSNP50K BeadChip with SVS software. Moreover, the same authors [27] demonstrated the characteristics of the CNVRs depended on the algorithm used (SVS, PennCNV, and cnvPartition) in terms of the number of detected CNVRs, total length, and percentage of coverage of the autosomal genome. Differences in the array density and soft-ware/algorithm used may thus mean that our results were not totally comparable with other studies on sheep [23–26] and cattle [11–14].
CNV association analyses
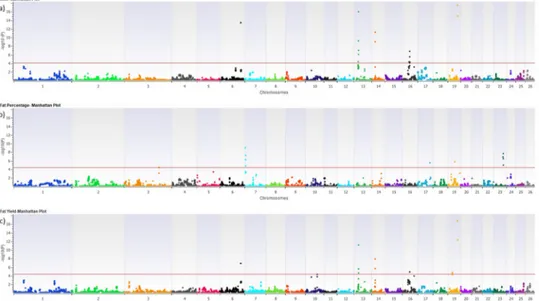
Association analysis for each trait was performed for 416 individuals with both CNV and DEBV information. After the CNVs merge, the results showed 31 significant CNVRs associ-ated with the studied phenotypic traits (FDR corrected p-value<0.01) (Table 2). The results of the CNV-association analyses for milk production and the SCS traits are shown as Manhattan plots in Figs1and2. In the Manhattan plots, the 0.01 FDR significance thresholds were shown with red colored line. Regarding the production traits, 13, 11, 10, and two CNVRs were signifi-cantly associated with MY, FP, FY, and PP, respectively. No CNVR was signifisignifi-cantly associated with PY and SCS, and there is therefore no threshold line in the PY and SCS plots. Of the 31 associated CNVRs, only CNVR_1 identified on chromosome 6 was simultaneously associated with three production traits (MY, FY, PP), three CNVRs on chromosomes 13, 14, and 19 were associated with two traits, while the remaining CNVRs (27) were each associated with only one trait (Table 2).
Association test validation
As expected, PY and SCS traits didn’t show any CNVs associated neither in the original whole dataset nor in the simulated ones.
With regards to MY, all CNVRs associated in the original dataset showed a probability greater than 67% of being associated in the reference dataset and only 6 CNVRs out of 13, i.e., CNVR_1, CNVR_6, CNVR_7 and CNVR_12, CNVR_19; CNVR_26 confirmed the associa-tion in the validaassocia-tion dataset at least one time.
For FY, FP, and PP traits, the CNVRs associated in the original dataset showed a probability greater than 74%, 49%, and 57%, respectively, of being associated in the reference one. More-over, for these traits, 6 CNVRs out of 10 for FY (i.e. CNVR_1, CNVR_7, CNVR_13,
CNVR_16, CNVR_25, CNVR_26), 4 CNVRs out of 11 for FP (i.e. CNVR_20, CNVR_22, CNVR_29, CNVR_31), and one out of two for PP (i.e. CNVR_5) confirmed the association in the validation dataset. Nevertheless, the results of the simulation are partially satisfying but the results of those CNVs associated in both reference and validation datasets probably highlight CNV calls useful for further studies.
Gene content and functional annotations
We investigated the content of the 31 CNVRs showing significant associations with the studies traits in sheep QTL by interrogating the Animal QTL database. All CNVRs, except those on OAR19, overlapped with QTLs, though not directly related to the traits of interest.
A total of 222 genes were annotated within the CNVRs significantly associated with the ana-lyzed traits. However, not all CNVRs contained annotated genes, and two CNVRs did not overlap with any annotated gene. Similar results were reported in previous studies on cattle [30,31]. This may be due to the genome assembly version, especially in non-human species [31]. Several studies have highlighted the genome-wide distribution of CNVs in regions cover-ing non-codcover-ing sequences, thus affectcover-ing the regulation of distant target genes [45]. We
Table 2. List of CNVRs significantly associated with MY, FP, FY and PP traits.
N˚ Chr Start End Length IND Genes MY FP FY PP QTL
CNVR_1 6 98915609 99081950 166342 2 CDS1 6.748E-11 0.000229 0.0006981 QTL:14011 Milk
CNVR_2 7 3206482 3429935 223454 4 7.99E-06
CNVR_3 7 18487054 18787472 300419 2 MYO9A, LOC105615633, LOC105615632, SENP8,
GRAMD2, LOC101110145
0.0008319
CNVR_4 7 22026509 22172957 146449 2 LOC101106264, LOC101106528, LOC105613077,
LOC105613076, LOC105613075
0.0008319
CNVR_5 9 78451353 78529564 78212 7 0.0002436 QTL:16015 Milk Fat
Yield
CNVR_6 13 19401523 20051589 650067 2 MALRD1 6.051E-07
CNVR_7 13 20379081 20547863 168783 2 PLXDC2, LOC105616667 6.051E-07 1.89E-08
CNVR_8 13 32965686 33058560 92875 2 ZEB1 1.89E-08 QTL:57750 Milk
Protein
CNVR_9 13 48832966 49706045 873080 27 LOC101117953, LOC101118207, LOC101110166 6.051E-07
CNVR_10 13 49006951 49706045 699095 41 LOC101117953, LOC101118207, LOC101110166 6.051E-07
CNVR_11 13 62376369 62539468 163100 2 LOC105606911, CBFA2T2, LOC101117009 8.93E-05
CNVR_12 14 14964181 15944658 980478 66 NETO2, TRNAM-CAU, ITFG1, LOC105613342,
PHKB, LOC101110611, LOC105613638, LOC105602056, LOC105602057, LOC105608343
9.693E-09 QTL:57692 Milk Fat
Yield
CNVR_13 14 14964181 15916620 952440 5 NETO2, TRNAM-CAU, ITFG1, LOC105613342,
PHKB, LOC101110611, LOC105613638, LOC105602056, LOC105602057, LOC105608343
9.693E-09 2.57E-05 QTL:57692 Milk Fat
Yield
CNVR_14 14 15008939 15700496 691558 13 NETO2, TRNAM-CAU, ITFG1, LOC105613342,
PHKB, LOC101110611, LOC105613638, LOC105602056, LOC105602057, LOC105608343
9.693E-09 QTL:57692 Milk Fat
Yield
CNVR_15 14 17982653 18259322 276670 11 HEATR3, PAPD5, LOC105616847, ADCY7, BRD7 9.693E-09
CNVR_16 14 43271417 43445098 173682 3 CHST8 2.57E-05 QTL:160872 Somatic
Cell Score
CNVR_17 14 44947626 46765514 1817889 2 FXYD3, LGI4, FXYD1, FXYD7, FXYD5,
LOC101123657, LOC101102084, LSR, USF2, HAMP, MAG, LOC105607576, LOC105602063, CD22, FFAR1, FFAR3, LOC101103344, FFAR2, LOC105607577, KRTDAP, DMKN, SBSN, GAPDHS, TMEM147, ATP4A, LOC101108333, LOC105607579, LOC105607578, LOC101104171, HAUS5, RBM42, ETV2, LOC101121538, TRNAT-UGU, UPK1A, ZBTB32, KMT2B, IGFLR1, U2AF1L4, PSENEN, LIN37, HSPB6, PROSER3, LOC101122717, ARHGAP33, PRODH2, NPHS1, KIRREL2, APLP1, NFKBID, HCST, TYROBP, LRFN3, SDHAF1, SYNE4, ALKBH6, CLIP3, THAP8, WDR62, OVOL3, POLR2I, TBCB, CAPNS1, LOC101121285 2.57E-05 CNVR_18 14 45934555 46765514 830960 2 ZNF565, ZNF146, ZNF567, TRNAW-CCA, ZNF461, ZNF382, LOC105616880, ZNF529, ZNF260, LOC105616879, ZNF566, LOC101102665, LOC105616881, ZFP14, LOC101106873, ZNF568, ZNF829, LOC105607590, ZNF793, LOC101122971, LOC105607591, ZNF383, LOC101105680, LOC105607592, LOC101107890, ZNF527, ZNF569, TRNAE-UUC, LOC105607593, LOC105616882, ZNF570, ZNF420, LOC105616883, LOC101108155, LOC101108415, LOC101108680, ZNF790, LOC101102169
2.57E-05
CNVR_19 16 41463528 41637426 173899 2 PDZD2, LOC105602599 0.0001281
CNVR_20 17 57986988 58424553 437566 4 LOC105602890, LOC105602891, LOC105602892,
MED13L
0.0029188 QTL:57700 Milk Fat
Yield, QTL:14002 Somatic Cell Score
CNVR_21 19 16600046 17485391 885346 15 IRAK2, VHL, LOC105603408, BRK1, FANCD2OS,
FANCD2, EMC3, LOC105603409, PRRT3, CRELD1, IL17RC, IL17RE, JAGN1, CIDEC, RPUSD3, LOC101103096, LOC105603411, LOC105603410, ARPC4, TADA3, OGG1, CAMK1, BRPF1, CPNE9, MTMR14, LOC105603412, LHFPL4, SETD5, LOC105603622, LOC105603415, THUMPD3, LOC105603414, LOC105603416, LOC105603417, SRGAP3
0.0020466
Table 2. (Continued)
N˚ Chr Start End Length IND Genes MY FP FY PP QTL
CNVR_22 19 33480446 34472912 992467 25 LOC105603452, LOC105603453, SUCLG2,
LOC105603455, LOC105603454, LOC105603458, LOC105603456, KBTBD8
0.0020466
CNVR_23 19 40179873 41112452 932580 41 FHIT, LOC105603489 2.491E-14
CNVR_24 19 43721683 43797484 75802 8 DNAH12, LOC105603505, TRNAC-GCA,
LOC105603504
1.48E-13
CNVR_25 19 44994104 45113902 119799 7 ERC2 2.05E-09
CNVR_26 19 46527885 46544501 16617 3 CACNA2D3 2.491E-14 1.48E-13
CNVR_27 23 12624271 13131785 507515 131 LOC101104705, SYT4 9.671E-05
CNVR_28 23 12649375 13131785 482411 22 LOC101104705, SYT4 9.671E-05
CNVR_29 23 37464041 38263780 799740 2 EMILIN2, LPIN2, MYOM1, LOC105604463, MRCL3,
LOC101105123, LOC105604464, LOC105604465, TGIF1, DLGAP1, LOC105604469, LOC105604468, LOC105604467, LOC105604466
9.671E-05
CNVR_30 23 40785469 40920221 134753 57 PTPRM, LOC105604482 9.671E-05
CNVR_31 23 47820944 48653824 832881 11 ZBTB7C, LOC105604508, LOC105604510,
LOC105604509, CTIF, LOC105604511, TRNAS-GGA
9.671E-05 QTL:13906 Milk Yield,
QTL:13907 Milk Fat Yield
N˚: number of CNVR Chr: number of chromosomes Start: start position of CNVR in bp End: end position of CNVR in bp Length: length of the CNVR in bp
IND: number of individuals carrying theper CNVR
Genes: genes symbols identified within of the CNVRs referred to NCBI (www.ncbi.nlm.nih.gov)
MY: milk yield, FP: milk fat percentage, FY: fat yield, PP: protein percentage; phenotypic traits with p-value<0.01 after FDR corrected
QTL: Quantitative Trait Locus overlapped with CNVRs referred to Sheep QTL database (https://www.animalgenome.org/cgi-bin/QTLdb/OA/index)
https://doi.org/10.1371/journal.pone.0215204.t002
Fig 1. Manhattan plots of–Log10 (p-value) for milk yield (a), fat percentage (b) and fat yield (c).
identified several genes that played important roles in biological processes related to the con-sidered milk traits.CIDEC, LPIN2, CDS1, FFAR1, FFAR2, and FFAR3 genes within different
CNVRs, were involved in lipid metabolism.CIDEC (CNVR_21) encodes a member of the cell
death-inducing DNA fragmentation factor-like effector family, and its encoded protein pro-motes lipid droplet formation in adipocytes and may mediate adipocyte apoptosis. TheCIDEC
gene is regulated by insulin and its expression is positively correlated with insulin sensitivity, and mutations in this gene may contribute to insulin resistant diabetes [46–49].Lipins (LPIN2
gene in CNVR_29) have dual functions in lipid metabolism by serving as a phosphatidate phosphatase and transcriptional co-regulators of gene expression [50]. Mouse studies sug-gested thatLPIN2 gene functioned during normal adipose tissue development, and may play a
role in human triglyceride metabolism. This gene represents a candidate gene for human lipo-dystrophy, characterized by loss of body fat, fatty liver, hypertriglyceridemia, and insulin resis-tance. TheCDS1 gene (CNVR_6) is known to regulate phospholipid metabolism along with
other genes [51], by encoding an enzyme that regulates the amount of phosphatidylinositol available for signaling by catalyzing the conversion of phosphatidic acid to CDP-diacylglycerol. A group of free fatty acid (FFA) receptors, encoded by genes including FFAR1, FFAR2, and FFAR3 (CNVR_17), previously known asGPR40, GPR43, and GPR41, respectively, are
recep-tors for FFAs and enable FFAs to act as signal molecules [52]. Mielenz [53] reported the pres-ence of these genes in bovine mammary gland epithelial cells and in different ovine adipose tissues. It is important to highlight that the fatty acid content and milk fat profile affect the technological properties and the nutritional value of dairy products. Sicilian sheep dairy prod-ucts are highly appreciated for their taste and flavor, and dairy production is mainly based on high quality PDO cheese as Vastedda della Valle del Belice and Pecorino Siciliano. Our find-ings could be applied on future selection scheme in Valle del Belice breed oriented towards milk yield and milk composition (protein and fat content) to maintain competitiveness of these products. TheCAPNS1 gene (CNVR_17) showed significant effects on natural drip loss,
lightness and intramuscular fat content in sheep [54].
GO and KEGG analyses showed that the functions of the proteins encoded by these genes included a wide spectrum of biological processes, cellular components, molecular functions,
Fig 2. Manhattan plots of–Log10 (p-value) for protein percentage (a), protein yield (b) and somatic cell score (c).
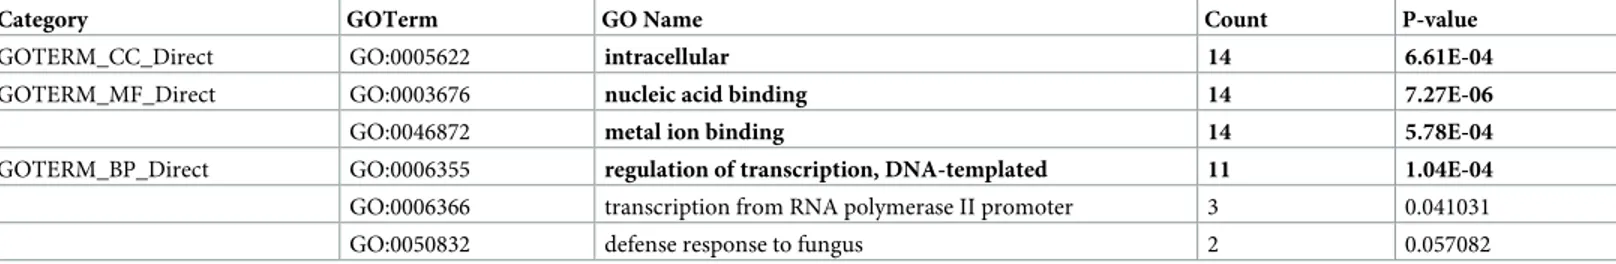
and pathways (Table 3),multiple significant categories (p�0.01). In particular, GO terms for cellular components were strongly represented by GO:0005622 intracellular (14 genes), molec-ular functions by GO:0003676 nucleic acid binding (14 genes) and, GO:0046872 metal ion binding (14 genes), and biological processes by GO:0006355 regulation of transcription (11 genes) (Table 3). KEGG showed five genes related to ‘Regulation of actin cytoskeleton’ and four related to ‘Oxytocin signaling pathway’ with enrichment of genes involved in several GO terms was observed. We have not discussed in detail all the genomic regions within CNVRs associated with the studied traits in detail, but have focused on selected genes in highly GO enriched terms with reported associations with several specific traits related to livestock. We therefore summarize the functions of the candidate genes within significant CNVRs below. Some genes identified by DAVID software participated in biological processes that are related to milk traits considered in this study. For example, the following genes located in CNVRs on OAR14 were associated with MY and FY traits:CLIP3 (CNVR_17), which plays roles in the
positive regulation of protein phosphorylation (GO:0001934) and glucose transport
(GO:0001934) and in fat cell differentiation (GO:0045444);ADCY7 (CNVR_15), involved in
the positive regulation of cAMP biosynthetic process (GO:0030819) and intracellular signal transduction (GO:0035556) directly related to inositol lipid-mediated signaling (GO:0048017);
APLP1 (CNVR_17) involved in the negative regulation of cAMP biosynthetic process
(GO:0030818);CHST8 gene (CNVR_16) involved in carbohydrate biosynthetic process
(GO:0016051);HCST gene (CNVR_17) in protein phosphorylation (GO:0006468) and positive
regulation of phosphatidylinositol 3-kinase signaling (GO:0014068), andPHKB (CNVR_12–
14 range) involved in glycogen metabolic process (GO:0005977). Furthermore,MALRD1 gene
(CNVR_6) on OAR13 was associated with MY and FY traits via roles in cholesterol homeosta-sis (GO:0042632) and negative regulation of bile acid biosynthetic process (GO:0070858), while SUCLG2 (CNVR_22) in OAR19 is involved in metabolic process (GO:0008152), and ZBTB7C (CNVR_31) in OAR23 is involved in the positive regulation of fat cell differentiation
(GO:0045600). These sets of genes, associated to milk traits, possess a wide spectrum of molec-ular function and provide a huge resource for testing hypotheses on the genetic basis of pheno-typic variation within our breed.
Conclusion
At present, limited knowledge is available on association between CNVs and production traits in sheep. To the best of our knowledge, this is the first GWAS of CNVs and milk production traits in dairy sheep breed. Our results indicate that many CNVRs are associated with one or more milk production traits, and probably contribute to phenotypic variation. In particular, the two most significant CNVRs (p-value = 2.49E-14) located on chromosome 19 and associ-ated with MY will be more investigassoci-ated.
Table 3. The enrichment of GO terms associated with the CNVRs genes (P–value < 0.05).
Category GOTerm GO Name Count P-value
GOTERM_CC_Direct GO:0005622 intracellular 14 6.61E-04
GOTERM_MF_Direct GO:0003676 nucleic acid binding 14 7.27E-06
GO:0046872 metal ion binding 14 5.78E-04
GOTERM_BP_Direct GO:0006355 regulation of transcription, DNA-templated 11 1.04E-04 GO:0006366 transcription from RNA polymerase II promoter 3 0.041031
GO:0050832 defense response to fungus 2 0.057082
These findings provide a useful basis for the development of breeding programs. The genes identified in the CNVRs associated with the studied traits may be used for more detailed inves-tigation of their roles in the metabolic pathways related to milk production and health traits in sheep. However, future studies based on a wider sample would be particularly relevant to refine and validate our results.
Supporting information
S1 Dataset. Genotypic dataset from GenomeStudio v2.0 software for 468 individuals of Valle del Belice breed (https://www.animalgenome.org/repository/pub/UPIT2018.0803/). (XLSX)
S2 Dataset. DEBVs for 468 individuals of Valle del Belice breed (https://www. animalgenome.org/repository/pub/UPIT2018.0803/).
(XLSX)
S1 Table. List of identified CNVs. (XLSX)
S2 Table. List of CNVRs determined by aggregating overlapping CNVs. (XLSX)
Author Contributions
Conceptualization: Rosalia Di Gerlando.
Data curation: Rosalia Di Gerlando, Salvatore Mastrangelo, Maria Teresa Sardina.
Formal analysis: Rosalia Di Gerlando, Anna Maria Sutera, Marco Tolone, Gianluca Sottile. Methodology: Rosalia Di Gerlando, Alessandro Bagnato, Maria Giuseppina Strillacci. Project administration: Baldassare Portolano.
Writing – original draft: Rosalia Di Gerlando.
Writing – review & editing: Anna Maria Sutera, Salvatore Mastrangelo, Marco Tolone, Bal-dassare Portolano, Alessandro Bagnato, Maria Giuseppina Strillacci, Maria Teresa Sardina.
References
1. Garcı´a-Ga´mez E, Gutie´rrez-Gil1 B, Goutam S, Juan-Pablo S, Yolanda B, Juan-Jose´ A. GWA Analysis for Milk Production Traits in Dairy Sheep and Genetic Support for a QTN Influencing Milk Protein Per-centage in the LALBA Gene. PLoS One. 2012; 7:e47782.https://doi.org/10.1371/journal.pone. 0047782PMID:23094085
2. Wang Z, Zhang H, Yang H, Wang S, Rong E, Pei, et al. Genome-wide association study for wool pro-duction traits in a Chinese Merino sheep population. PloS One. 2014; 9:e107101.https://doi.org/10. 1371/journal.pone.0107101PMID:25268383
3. Ren X, Yang GL, Peng WF, Zhao YX, Zhang M, Chen ZH, et al. A genome-wide association study iden-tifies a genomic region for the polycerate phenotype in sheep (Ovis aries). Sci. Rep. 2016; 6:21111.
https://doi.org/10.1038/srep21111PMID:26883901
4. Kominakis A, Hager-Theodorides AL, Zoidis E, Saridaki A, Antonakos G, Tsiamis G. Combined GWAS and ‘guilt by association’-based prioritization analysis identifies functional candidate genes for body size in sheep. Genet. Sel. Evol. 2017; 49:41.https://doi.org/10.1186/s12711-017-0316-3PMID:
28454565
5. Peng WF, Xu SS, Ren X, Lv FH, Xie XL, Zhao YX, et al. A genome-wide association study reveals can-didate genes for the supernumerary nipple phenotype in sheep (Ovis aries). Anim. Genet. 2017; 48:570–579.https://doi.org/10.1111/age.12575PMID:28703336
6. Feuk L, Carson AR, Scherer SW. Structural variation in the human genome. Nat. Rev. Genet. 2006; 7:85–97.https://doi.org/10.1038/nrg1767PMID:16418744
7. Perry GH, Yang F, Marques-Bonet T, Murphy C, Fitzgerald T, Lee AS, et al. Copy number variation and evolution in humans and chimpanzees. Genome Res. 2008; 18:1698–1710.https://doi.org/10.1101/gr. 082016.108PMID:18775914
8. Guryev V, Saar K, Adamovic T, Verheul M, Van Heesch SA, Cook S, et al. Distribution and functional impact of DNA copy number variation in the rat. Nat. Genet. 2008; 40:538.https://doi.org/10.1038/ng. 141PMID:18443591
9. Adams DJ, Dermitzakis ET, Cox T, Smith J, Davies R, Banerjee R. Complex haplotypes, copy number polymorphisms and coding variation in two recently divergent mouse strains. Nat. Genet. 2005; 37:532–536.https://doi.org/10.1038/ng1551PMID:15852006
10. Di Gerlando R, Sardina MT, Tolone M, Sutera AM, Mastrangelo S, Portolano B. Genome-wide detection of copy-number variations in local cattle breeds. Anim. Prod. Sci. 2018;https://doi.org/10.1071/AN17603
11. Bae JS, Cheong HS, Kim LH, NamGung S, Park TJ, Chun JY, et al. Identification of copy number varia-tions and common deletion polymorphisms in cattle. BMC Genomics. 2010; 11:232.https://doi.org/10. 1186/1471-2164-11-232PMID:20377913
12. Jiang L, Jiang J, Yang J, Liu X, Wang J, Wang H, et al. Genome-wide detection of copy number varia-tions using high-density SNP genotyping platforms in Holsteins. BMC Genomics. 2013; 14:131.https:// doi.org/10.1186/1471-2164-14-131PMID:23442346
13. Liu GE, Hou Y, Zhu B, Cardone MF, Jiang L, Cellamare A, et al. Analysis of copy number variations among diverse cattle breeds. Genome Res. 2010; 20:693–703.https://doi.org/10.1101/gr.105403.110
PMID:20212021
14. Hou Y, Liu GE, Bickhart DM, Cardone MF, Wang K, Kim E, et al. Genomic characteristics of cattle copy number variations. BMC Genomics. 2011; 12:127.https://doi.org/10.1186/1471-2164-12-127
PMID:21345189
15. Fontanesi L, Martelli PL, Beretti F, Riggio V, Dall’Olio S, Colombo M, et al. An initial comparative map of copy number variations in the goat (Capra hircus) genome. BMC Genomics. 2010; 11:639.https://doi. org/10.1186/1471-2164-11-639PMID:21083884
16. Paudel Y, Madsen O, Megens HJ, Frantz LA, Bosse M, Bastiaansen JW, et al. Evolutionary dynamics of copy number variation in pig genomes in the context of adaptation and domestication. BMC Geno-mics. 2013; 14:449.https://doi.org/10.1186/1471-2164-14-449PMID:23829399
17. Paudel Y, Madsen O, Megens HJ, Frantz LA, Bosse M, Crooijmans RP, et al. Copy number variation in the speciation of pigs: a possible prominent role for olfactory receptors. BMC Genomics. 2015; 16:330.
https://doi.org/10.1186/s12864-015-1449-9PMID:25896665
18. Jiang L, Jiang J, Yang J, Liu X, Wang J, Wang H, et al. Genome-wide detection of copy number varia-tions using high-density SNP genotyping platforms in Holsteins. BMC Genomics. 2013; 14:131.https:// doi.org/10.1186/1471-2164-14-131PMID:23442346
19. Xu L, Cole JB, Bickhart DM, Hou Y, Song J, VanRaden PM, et al. Genome wide CNV analysis reveals additional variants associated with milk production traits in Holsteins. BMC Genomics. 2014; 15:683.
https://doi.org/10.1186/1471-2164-15-683PMID:25128478
20. Dura´n Aguilar M, Roma´ n Ponce SI, Ruiz Lo´pez FJ, Gonza´lez Padilla E, Va´squez Pela´ez CG, Bagnato A, et al. Genome-wide association study for milk somatic cell score in holstein cattle using copy number variation as markers. J. Anim. Breed. Genet. 2017; 134:49–59.https://doi.org/10.1111/jbg.12238
PMID:27578198
21. Fontanesi L, Beretti F, Martelli PL, Colombo M, Dall’Olio S, Occidente M, et al. A first comparative map of copy number variations in the sheep genome. Genomics. 2011; 97:158–165.https://doi.org/10. 1016/j.ygeno.2010.11.005PMID:21111040
22. Hou CL, Meng FH, Wang W, Wang SY, Xing YP, Cao JW, et al. Genome-wide analysis of copy number variations in Chinese sheep using array comparative genomic hybridization. Small Ruminant Res. 2015; 128:19–26.
23. Jenkins GM, Goddard ME, Black MA, Brauning R, Auvray B, Dodds KG, et al. Copy number variants in the sheep genome detected using multiple approaches. BMC Genomics. 2016; 17:441.https://doi.org/ 10.1186/s12864-016-2754-7PMID:27277319
24. Liu J, Zhang L, Xu L, Ren H, Lu J, Zhang X, et al. Analysis of copy number variations in the sheep genome using 50K SNP BeadChip array. BMC Genomics. 2013; 14:229. https://doi.org/10.1186/1471-2164-14-229PMID:23565757
25. Zhu C, Fan H, Yuan Z, Ma X, Xuan J, Wang H, et al. Genome-wide detection of CNVs in Chinese indig-enous sheep with different types of tails using Ovine high-density 600K SNP arrays. Sci. Rep. 2016; 6:27822.https://doi.org/10.1038/srep27822PMID:27282145
26. Ma Q, Liu X, Pan J, Ma L, Ma Y, He X, et al. Genome-wide detection of copy number variation in Chi-nese indigenous sheep using an ovine high-density 600 K SNP array. Sci. Rep. 2017; 7:912.https:// doi.org/10.1038/s41598-017-00847-9PMID:28424525
27. Yan J, Blair HT, Liu M, Li W, He S, Chen L, et al. Genome-wide detection of autosomal copy number variants in several sheep breeds using Illumina OvineSNP50 BeadChips. Small Ruminant Res. 2017; 155:24–32.
28. Seroussi E, Glick G, Shirak A, Yakobson E, Weller JI, Ezra E, et al. Analysis of copy loss and gain varia-tions in Holstein cattle autosomes using BeadChip SNPs. BMC Genomics. 2010; 11:673.https://doi. org/10.1186/1471-2164-11-673PMID:21114805
29. de Almeida Santana MH, Junior GAO, Cesar ASM, Freua MC, da Costa Gomes R, e Silva SDL, et al. Copy number variations and genome-wide associations reveal putative genes and metabolic pathways involved with the feed conversion ratio in beef cattle. J. Appl. Genet. 2016; 57:495–504.https://doi.org/ 10.1007/s13353-016-0344-7PMID:27001052
30. Sassi NB, Gonza´ lez-Recio O´ , De Paz-Del Rı´o R, Rodrı´guez-Ramilo ST, Ferna´ndez AI. Associated effects of copy number variants on economically important traits in Spanish Holstein dairy cattle. J. Dairy Sci. 2016; 99:6371–6380.https://doi.org/10.3168/jds.2015-10487PMID:27209136
31. Prinsen RTMM, Rossoni A, Gredler B, Bieber A, Bagnato A, Strillacci MG. A genome wide association study between CNVs and quantitative traits in Brown Swiss cattle. Livest. Sci. 2017; 202:7–12. 32. Wang L, Xu L, Liu X, Zhang T, Li N, Zhang Y, et al. Copy number variation-based genome wide
associa-tion study reveals addiassocia-tional variants contributing to meat quality in Swine. Sci. Rep. 2015; 5:12535.
https://doi.org/10.1038/srep12535PMID:26234186
33. Long Y, Su Y, Ai H, Zhang Z, Yang B, Ruan G, et al. A genome-wide association study of copy number variations with umbilical hernia in swine. Anim. Genet. 2016; 47:298–305.https://doi.org/10.1111/age. 12402PMID:27028052
34. Miller SA, Dykes DD, Polesky HF. A simple salting out procedure for extracting DNA from human nucle-ated cells. Nucleic Acids Res.1988; 16:1215. PMID:3344216
35. Pinto D, Darvishi K, Shi X, Rajan D, Rigler D, Fitzgerald T, et al. Comprehensive assessment of array-based platforms and calling algorithms for detection of copy number variants. Nat. Biotechnol. 2011; 8:512–520.
36. Diskin SJ, Li M, Hou C, Yang S, Glessner J, Hakonarson H, et al. Adjustment of genomic waves in sig-nal intensities from whole-genome SNP genotyping platforms. Nucleic. Acids. Res. 2008; 36:e126.
https://doi.org/10.1093/nar/gkn556PMID:18784189
37. Redon R, Ishikawa S, Fitch KR, Feuk L, Perry GH, Andrews TD, et al. Global variation in copy number in the human genome. Nature 2006; 444: 444–454.https://doi.org/10.1038/nature05329PMID:
17122850
38. Ali AKA & Shook GE. An optimum transformation for somatic cell concentration in milk1. J. Dairy Sci. 1980; 63:487–490.
39. SAS Institute Inc (2012) Bases SAS®9.2.4 Procedures Guide, Second Edition, Volumes 1, 2, 3, and 4. Cary, NC: SAS Institute Inc.
40. Gilmour AR, Gogel BJ, Cullis BR, Thompson R. ASReml User Guide Release 3.0VSN International Ltd, Hempstead, HP1 1ES, UK. 2009.
41. Leitner G, Chaffer M, Zamir S, Mor T, Glickman A, Winkler M, et al. Udder disease etiology, milk somatic cell counts and NAGase activity in Israeli Assaf sheep throughout lactation. Small Ruminant Res. 2001, 39:107–112.
42. Garrick DJ, Taylor JF, Fernando RL. Deregressing estimated breeding values and weighting informa-tion for genomic regression analyses. Genet. Sel. Evol. 2009; 41:55. https://doi.org/10.1186/1297-9686-41-55PMID:20043827
43. R Development Core Team: R: A language and environment for statistical computing. R Foundation for Statistical Computing. Vienna, Austria. 2011.http://www.R-project.org.
44. Prinsen RTMM, Strillacci MG, Schiavini F, Santus E, Rossoni A, Maurer V, et al. A genome-wide scan of copy number variants using high-density SNPs in Brown Swiss dairy cattle. Livest. Sci. 2016, 191:153–160.
45. Zhang F, Lupski JR. Non-coding genetic variants in human disease. Hum. Mol. Genet. 2015; 24:R102– R110.https://doi.org/10.1093/hmg/ddv259PMID:26152199
46. Bakhtiarizadeh MR, Moradi-Shahrbabak M, Ebrahimie E. Underlying functional genomics of fat deposi-tion in adipose tissue. Gene. 2013; 521:122–128.https://doi.org/10.1016/j.gene.2013.03.045PMID:
47. Guo B, Kongsuwan K, Greenwood PL, Zhou G, Zhang W, Dalrymple BP. A gene expression estimator of intramuscular fat percentage for use in both cattle and sheep. J. Anim Sci. Biotechnol. 2014; 5:35.
https://doi.org/10.1186/2049-1891-5-35PMID:25028604
48. Gao L, Xu R, Zhao W, Yang J, Liang Y, Liu S, et al. Cloning of sheep cell death-inducing DFFA-like effector c (CIDEC) cDNA and its differential expression in tail fat tissue of Altay sheep (Ovis aries) in persistent starvation. J. Agricul. Biotechol. 2015; 23:227–235.
49. Chao T, Wang G, Ji Z, Liu Z, Hou L, Wang J, et al. Transcriptome Analysis of Three Sheep Intestinal Regions reveals Key Pathways and Hub Regulatory Genes of Large Intestinal Lipid Metabolism. Sci. Rep. 2017; 7:5345.https://doi.org/10.1038/s41598-017-05551-2PMID:28706214
50. Jiao XL, Jing JJ, Qiao LY, Liu JH, Li LA, Zhang J, et al. Ontogenetic Expression of Lpin2 and Lpin3 Genes and Their Associations with Traits in Two Breeds of Chinese Fat-tailed Sheep. Asian-Australas. J. Anim. Sci. 2016; 29:333.
51. Fei W, Shui G, Zhang Y, Krahmer N, Ferguson C, Kapterian TS, et al. A role for phosphatidic acid in the formation of “supersized” lipid droplets. PLoS Genet. 2011; 7:e1002201.https://doi.org/10.1371/ journal.pgen.1002201PMID:21829381
52. Friedrichs P, Saremi B, Winand S, Rehage J, Da¨nicke S, Sauerwein H, et al. Energy and metabolic sensing G protein–coupled receptors during lactation-induced changes in energy balance. Domest. Anim. Endocrinol. 2014; 48:33–41.https://doi.org/10.1016/j.domaniend.2014.01.005PMID:24906926
53. Mielenz M. Invited review: nutrient-sensing receptors for free fatty acids and hydroxycarboxylic acids in farm animals. Animal. 2017; 11:1008–1016.https://doi.org/10.1017/S175173111600238XPMID:
27829484
54. Grochowska E, Borys B, Grześkowiak V, Mroczkowski S. Effect of the calpain small subunit 1 gene (CAPNS1) polymorphism on meat quality traits in sheep. Small Ruminant Res. 2017; 150:15–21.