VOLUME89, NUMBER2 P H Y S I C A L R E V I E W L E T T E R S 8 JULY2002
Anomalous Roughening of Hele-Shaw Flows with Quenched Disorder
J. Soriano,1J. J. Ramasco,2,3 M. A. Rodríguez,2 A. Hernández-Machado,1,4 and J. Ortín1 1Departament ECM, Facultat de Física, Universitat de Barcelona, Diagonal 647, E-08028 Barcelona, Spain
2Instituto de Física de Cantabria, CSIC, Avenida Los Castros, E-39005 Santander, Spain 3Departamento de Física Moderna, Universidad de Cantabria, E-39005 Santander, Spain
4Groupe de Physique des Solides, Université Pierre-et-Marie-Curie, Tour 23, 2 place Jussieu, 75251 Paris Cedex 05, France (Received 7 December 2001; published 24 June 2002)
The kinetic roughening of a stable oil-air interface moving in a Hele-Shaw cell that contains a quenched columnar disorder (tracks) has been studied. A capillary effect is responsible for the dynamic evolution of the resulting rough interface, which exhibits anomalous scaling. The three independent exponents needed to characterize the anomalous scaling are determined experimentally. The anomalous scaling is explained in terms of the initial acceleration and subsequent deceleration of the interface tips in the tracks coupled by mass conservation. A phenomenological model that reproduces the measured global and local exponents is introduced.
DOI: 10.1103/PhysRevLett.89.026102 PACS numbers: 68.35.Ct, 05.40. – a, 47.55.Mh
The kinetic roughening of surfaces and interfaces in nonequilibrium conditions has received a great deal of at-tention in last few years. This is a subject of technological importance in surface growth, and it is of fundamental rele-vance as an example of scaling far from equilibrium [1].
Roughening originates from the competition between stabilizing and destabilizing mechanisms at different length scales. As a result of the competition, the cor-relation length of the interfacial fluctuations along an initially flat front increases monotonously with time, until it reaches the system size and the roughness saturates. The statistical properties of the roughening front are usually given in terms of the (rms) width w of the interfacial fluctuations. In the absence of characteristic scales, many systems follow the dynamic scaling hypothesis of Family-Vicsek (FV) [2], in which short and long length scales have the same scaling behavior: w共l兲 ⬃ tb for
t , t3, w共l兲 ⬃ la for t . t3, and t3 ⬃ lz. Here l is the lateral size of the window used to measure w, t3 is the saturation time, b is the growth exponent, a is the roughness exponent, and z is the dynamic exponent. The scaling relation a苷 zb reduces to two the number of independent exponents that characterize the universality class of the problem under study.
In recent years, however, experiments on molecular beam epitaxy [3], sputtering [4], fracture mechanics [5], and electrodeposition [6] have revealed a rich variety of situations in which the scaling of the global and the local interface fluctuations are substantially different. Long length scales are then characterized by the same FV scaling exponents, while short length scales follow the so-called anomalous scaling ansatz [7]: w共l, t兲 ⬃ tb for t , tl, w共l, t兲 ⬃ laloctb
ⴱ
for tl , t , t3, and
w共l, t兲 ⬃ lalocLa2aloc for t
3 , t. The local time tl ⬃ lz,
and the saturation time t3 ⬃ Lz, where L is the sys-tem size in the direction along the front. Here bⴱ and aloc are new local growth and roughness exponents,
respectively, which characterize the scaling at short
length scales 共l ø L兲. There is a new scaling relation a 2 aloc 苷 zbⴱ. Since now there are five exponents
and two scaling relations, the anomalous scaling is char-acterized by three independent exponents. Usually the roughness exponents are determined through the power spectrum, which is less sensitive than w to finite size ef-fects. The spectrum scales as S共k, t兲 苷 k2共2a11兲s
A共kt1兾z兲,
where sA obeys sA共u兲 ⬃ u2a11 when u ø 1 and
sA共u兲 ⬃ u2u when u ¿ 1. Here u 苷 a 2 aloc. The
anomalous scaling leads to the usual FV scaling when u 苷 0 (short and long length scales are characterized by the same roughness exponents) and bⴱ苷 0 (the temporal correlations of the short length scales disappear). Recently it has been shown that the anomalous scaling can be related to the presence of high slopes in the front that have nontrivial dynamics [8].
In this Letter we report the first observations of anoma-lous roughening in experiments of Hele-Shaw flows with quenched disorder. We consider an initially flat front be-tween oil and air, driven at a small constant average ve-locity y in a horizontal Hele-Shaw cell with a columnar quenched disorder. The disorder consists of continuous copper tracks on a fiberglass substrate in the advancing direction of growth and randomly distributed in the per-pendicular direction (Fig. 1). In this situation, the correla-tion of the disorder in the advancing direccorrela-tion is infinite. The local motion relative to the average position of the front is driven by capillary forces, caused by the different curvatures of the advancing front in the third dimension, depending on whether the oil is on a copper track or on the fiberglass substrate. An analysis of the rms width of the rough interface at short and long length scales plus a collapse of the power spectra of the interfacial fluctuations enables an independent determination of the three expo-nents characteristic of anomalous scaling.
We associate the anomalous roughening with the initial acceleration and subsequent deceleration of the liquid on the copper tracks, caused by capillarity, and the coupling
VOLUME89, NUMBER2 P H Y S I C A L R E V I E W L E T T E R S 8 JULY2002 0 20 40 60 80 100 120 140 160 180 0 25 50 350 375 400 425 450 x (mm) h ( m m ) 1 s 200 s 9000 s
FIG. 1. Sequence of typical oil-air interfaces. The silicone oil moves upwards in the picture, and the disorder pattern is repre-sented in grey. The experimental parameters are b苷 0.36 mm and y 苷 0.04 mm兾s.
of the motion over tracks and over fiberglass due to mass conservation. The anomaly decreases as y increases, and disappears when y is large enough to override the local ac-celeration and deac-celeration [9]. To explain the experimen-tal results, we propose a phenomenological model which gives global and local exponents in good agreement with the experimental exponents.
The experiments have been performed in a horizontal Hele-Shaw cell, 190 3 550共L 3 H兲 mm2, made of two glass plates 20 mm thick. A fiberglass substrate with cop-per tracks, manufactured using printed circuit technology, is attached to the bottom plate. The unit copper track is d 苷 0.06 6 0.01 mm high and 1.50 6 0.04 mm wide. The tracks are placed randomly in a grid of 1.5 mm lat-tice spacing, along the x direction, up to a 35% occu-pation. There are no lateral correlations of the disorder at distances larger than the width of the unit track. The distance between the top plate and the substrate defines the gap spacing b, which has been varied in the range 0.16 # b # 0.75 mm. We have used four different dis-order configurations and carried out two identical runs per disorder configuration. A silicone oil (kinematic viscos-ity n 苷 50 mm2兾s, density r 苷 998 kg兾m3, and surface tension oil-air s 苷 20.7 mN兾m at room temperature) is injected into one side of the cell at a constant volumetric in-jection rate. The oil wets similarly and almost completely the surfaces which it is in contact with (glass, substrate, and copper). The evolution of the interface is moni-tored using two charge-coupled device cameras mounted along the growth direction and fixed. The final resolu-tion is 0.37 3 0.37 mm2兾pixel, providing four pixels per unit track in the x direction. We have carried out a series of reference experiments to calibrate sidewall effects and possible inhomogeneities in gap spacing. Our results make us confident that these disturbances do not have a relevant effect on the dynamic scaling presented in this work. Ex-tensive details of the experimental setup will be given in a forthcoming publication [10].
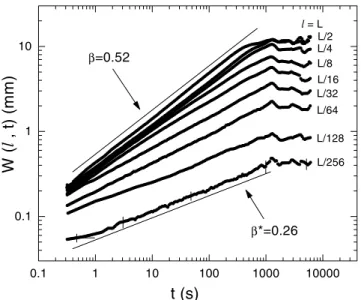
In Fig. 2 we present the results for the interfacial width as a function of time at different length scales l, from L to L兾256. We plot W共l, t兲 苷 关w2共l, t兲 2 w2共l, 0兲兴1兾2 to minimize the influence of the initial condition [4,11].
0.1 1 10 100 1000 10000 0.1 1 10 L/256 L/128 L/64 L/32 L/16 L/8 L/4 L/2 l = L β*=0.26 β=0.52 W ( l , t) ( m m ) t (s)
FIG. 2. Experimental determination of b and bⴱ. The window size l decreases from L to L兾256. The experimental parameters are b 苷 0.36 mm and y 苷 0.08 mm兾s.
We obtain clear power law dependencies, providing b 苷 0.52 6 0.02 at the longest length scales and bⴱ苷 0.26 6 0.03 at the two shortest length scales. It is worth mentioning that a different method, based on the growth of the local slopes [8], gives the same value of bⴱ. The fact that this local exponent is significantly different from 0 is a sign of anomalous scaling of the measured fronts.
The temporal evolution of the power spectrum is pre-sented in Fig. 3(a). At very short times we observe a regime with S共k兲 ⬃ k23.4. It is a superrough transient regime created when the fluid on the tracks reaches its maximum velocity after coming into contact with the dis-order. The main regime appears further on, with S共k兲 ⬃
k22.1, and a vertical shift that progressively decreases with time and disappears at saturation 共t * 450 s兲. The vertical shift of the power spectra is a sign of intrinsic anomalous scaling, in which the spectral exponent [12] can be identified with the local roughness exponent, so that aloc 苷 0.55 6 0.10.
Using the above procedure, the three independent ex-ponents b, bⴱ, aloc have been obtained directly from the
experiments. The other two exponents a, z can be ob-tained from the scaling relations. In order to verify the whole scaling, however, we prefer to determine the critical exponents by performing the best collapse of the spectra compatible with the experimental results. The collapse, presented in Fig. 3(b), leads to the following set of scaling exponents:
b 苷 0.50 6 0.04, bⴱ苷 0.25 6 0.03 , a 苷 1.0 6 0.1, aloc 苷 0.5 6 0.1, z 苷 2.0 6 0.2 .
(1)
We have also looked into the possibility of multiscaling [13] through the scaling of the generalized correlations
VOLUME89, NUMBER2 P H Y S I C A L R E V I E W L E T T E R S 8 JULY2002 0.01 0.1 1 100 102 104 106 (a) -2.1 -3.4 1000 100 10 t = 1 s 6000 S ( k , t) k (mm -1) 0.1 1 10 100 10-2 100 102 104 (c) t=50 s 100 s 1000 s 6000 s (b) S ( k , t ) k 2 α + 1 1 3 k t 1/z 0.01 0.1 1 10 10-5 10-3 10-1 3 1 S ( k , t) k 2 α + 1 k t 1/z
FIG. 3. (a) Temporal evolution of the power spectrum for the same experiments as Fig. 2. The vertical line gives the value of k associated with the lateral size of the unit copper track. (b) Collapse of the experimental power spectra for t . 10 s. (c) Collapse of the power spectra obtained from numerical simulations of the interfacial equation (2).
of order q, of the form 兵关h共x 1 l, t兲 2 h共x, t兲兴q其1兾q ⬃
laq. Different exponents for a
q, a2⯝ 0.6, a4 ⯝ 0.3, and a6⯝ 0.2, were obtained, which confirm the existence of multiscaling in the experiment.
To understand the origin of anomalous scaling, we should look at the interfacial dynamics in greater detail. An initially flat oil-air interface, moving at a nominal average velocity y, experiences local accelerations at
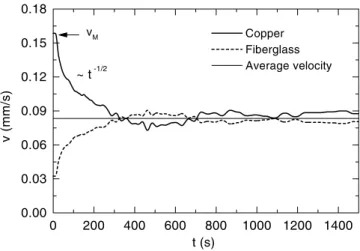
those points that touch a copper track for the first time. The local velocity of these points jumps to a maximum in a characteristic time of 1 s and then relaxes as t21兾2 to y. The maximum velocity reached in a copper track increases with track width and decreases with gap spac-ing. As shown in Fig. 4, the average interface velocity over copper tracks or over fiberglass channels follows y6 苷 y 6 共yM 2 y兲t21兾2, respectively, where yM is
the maximum of the average velocity over tracks. This functionality varies slightly with gap spacing due to the increasing correlation between neighboring tracks. It does not apply for b * 0.6 mm. This behavior of different velocities y1 and y2 is directly correlated with the shift of the power spectra, indicative of anomalous scaling: the shift is maximum at very short times and disappears close to saturation, similar to the difference between the average velocities shown in Fig. 4. When we inhibit the relaxation of the velocity over copper tracks by either injecting at y . yM or using large b, the anomalous scaling
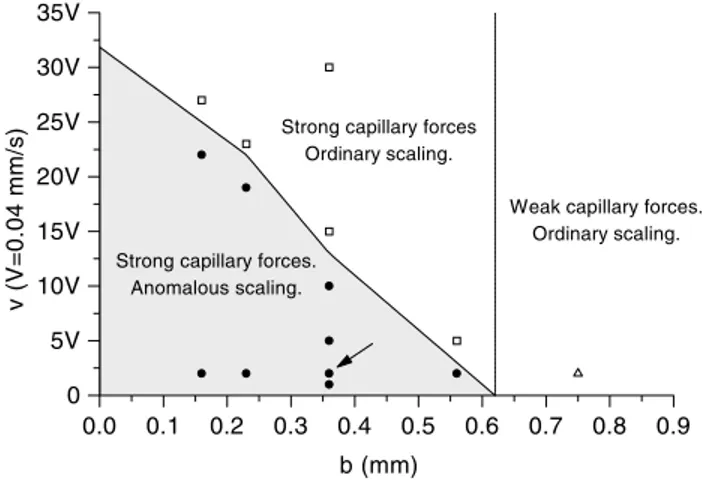
disap-pears. This scenario has been studied experimentally by exploring different velocities and gap spacings. Figure 5 shows a phase diagram representing the regions where the anomalous scaling is present (grey region, u fi 0) or not (white regions, u 苷 0). The solid line represents the function yM共b兲, and the vertical line the limit between
strong and weak capillary forces.
The critical exponents of the anomalous scaling depend on gap spacing and velocity. We have seen that the anoma-lous exponent u tends to u 苷 0 as we increase either the velocity or the gap spacing. This exponent is par-ticularly sensitive to variations of the gap spacing. For
b * 0.6 mm, u 苷 0 at any velocity. The experimental
pa-rameters b 苷 0.36 mm and y 苷 0.08 mm兾s, deep in the grey region of Fig. 5, give the appropriate conditions to fully characterize the anomalous scaling experimentally. Smaller gap spacings mean that the correlation length in the x direction cannot grow to scales larger than the aver-age track width, and larger gap spacings give too weak an
0 200 400 600 800 1000 1200 1400 0.00 0.03 0.06 0.09 0.12 0.15 0.18 vM ~ t -1/2 Copper Fiberglass Average velocity t (s) v (mm/s)
FIG. 4. Average interface velocity over copper tracks and over fiberglass, for b苷 0.36 mm and y 苷 0.08 mm兾s.
VOLUME89, NUMBER2 P H Y S I C A L R E V I E W L E T T E R S 8 JULY2002 0.0 0.1 0.2 0.3 0.4 0.5 0.6 0.7 0.8 0.9 0 5V 10V 15V 20V 25V 30V 35V
Strong capillary forces Ordinary scaling.
Strong capillary forces. Anomalous scaling.
Weak capillary forces. Ordinary scaling.
v (V=0.04 mm/s)
b (mm)
FIG. 5. Phase diagram y共b兲 indicating the regions where the anomalous scaling is observable. The symbols represent the dif-ferent regions explored experimentally, and the arrow indicates the parameters used in this Letter.
anomalous scaling because the t21兾2 law is obeyed only on the widest tracks.
Finally, in order to reproduce the experimental behavior in a phenomenological way, we have developed an inter-facial equation of the form
≠th 苷 ≠xD共x兲≠xh 1 y 1共yM 2 y兲t21兾2h共x兲 , (2)
where h苷 h共x, t兲, and h共x兲 is a dichotomous noise with values 11 and 21 (columnar disorder). The diffusive coupling accounts for the dynamics with z 苷 2 found in experiments, and the other two terms account for the be-havior of y6 observed experimentally. Although the term
t21兾2introduces some nonlocality in the model, this is es-sentially different from nonlocal models [14] introduced recently to account for mass conservation. The simplest version (constant D) reproduces the experimental behav-ior at long length scales共a 苷 1, b 苷 0.5, z 苷 2兲, but not at short length scales, since numerical simulations of the model give bⴱ 苷 0 and aloc 苷 a 苷 1. The reason is that
the simulated interfaces do not display the large fluctu-ations at the copper track edges observed in the experi-mental fronts (Fig. 1). This can be imposed analytically in Eq. (2) through an inhomogeneous diffusion coefficient
D共x兲. Numerically, we have introduced this effect by
spa-tially averaging the interface inside each track once each
ntime steps. We thus recover interfaces that are morpho-logically analogous to experimental interfaces. Now the exponents derived from the scaling of the power spectra, shown in Fig. 3(c), and the multiscaling exponents, repro-duce the values determined experimentally. In summary, Eq. (2) enables the relevant effects in the experiment to be both identified and calibrated.
In conclusion, we have presented the first experimental evidence of anomalous scaling in the dynamic roughen-ing of a fluid interface in a Hele-Shaw cell with quenched disorder, and we have studied the experimental conditions for the appearance of the observed anomaly. The expo-nents b, bⴱ, and aloc have been measured independently
and their value has been refined by imposing the scaling relations through a collapse of the power spectra. Finally we have introduced an interfacial equation (2) that models the capillary phenomena observed in the experiments, at a phenomenological level. The model reproduces both the morphology of the interfaces and the values of the anoma-lous scaling exponents.
We are grateful to J. M. López for fruitful discussions. The research has received financial support from the Dirección General de Investigación (MCT, Spain) under Projects No. 0628-C03-01 and No. BFM2000-0628-C03-02. J. S. and J. J. R. have received financial support from the Spanish Ministry of Science and the Spanish Ministry of Education, respectively.
[1] P. Meakin, Fractals, Scaling and Growth Far from Equi-librium (Cambridge University Press, Cambridge, 1998); M. Kardar, Phys. Rep. 301,85 (1998); J. Krug, Adv. Phys.
46, 139 (1997).
[2] F. Family and T. Vicsek, J. Phys. A 18,L75 (1985). [3] H.-N. Yang et al., Phys. Rev. Lett. 73,2348 (1994). [4] J. H. Jeffries et al., Phys. Rev. Lett. 76,4931 (1996). [5] S. Morel et al., Phys. Rev. E 58,6999 (1998); Phys. Rev.
Lett. 85, 1678 (2000); J. M. López and J. Schmittbuhl, Phys. Rev. E 57, 6405 (1998).
[6] S. Huo and W. Schwarzacher, Phys. Rev. Lett. 86, 256 (2001).
[7] J. M. López and M. A. Rodríguez, Phys. Rev. E 54,R2189 (1996); J. M. López et al., Physica (Amsterdam) 246A,329 (1997).
[8] J. M. López, Phys. Rev. Lett. 83,4594 (1999).
[9] The anomaly also decreases as the persistence of the disor-der in the advancing direction is reduced, e.g., when tracks are replaced by square islands [10].
[10] J. Soriano, J. Ortín, and A. Hernández-Machado, Phys. Rev. E (to be published).
[11] G. Tripathy and W. van Saarloos, Phys. Rev. Lett. 85,3556 (2000).
[12] J. J. Ramasco et al., Phys. Rev. Lett. 84,2199 (2000). [13] J. Krug, Phys. Rev. Lett. 72,2907 (1994).
[14] V. Ganesan and H. Brenner, Phys. Rev. Lett. 81, 578 (1998); M. Dubé et al., Phys. Rev. Lett. 83,1628 (1999); A. Hernández-Machado et al., Europhys. Lett. 55, 194 (2001).