1
Dipartimento Di Produzioni Animali
DOTTORATO DI RICERCA IN GENETICA E BIOLOGIA CELLULARE
XXIII CICLO
Analysis of the Genetic Expression in
Livestock Breeds Through Proteomic Methods
AGR/17
Coordinatore:
Prof. Giorgio Prantera
Tutor:
Dr. Lorraine Pariset
Dottorando:
2
AIM OF THE STUDY. ……….…. 5
Part I 2D IEF SDS PAGE – A Breakdown……….…..…….….9
1. SETTING EXTRACTION METHODS……….……...….10
1.1. Reagents………...…….…....10 1.1.1. Samples………...……….10 1.1.2. Extraction Buffers…….………...…………10 1.1.3. Precipitation ……….………...…………10 1.1.4. Electrophoresis………..………...………10 1.1.5. Protein Quantification……….……...……….12 1.1.6. Image Analyss………...………..12 1.2. Methods………....………...12 1.2.1 Extraction………...………12 1.2.2 Quantification………...………..15 1.2.3 Gel Casting………...……….……….…15 1.2.4 Electrophoresis………...………..…….….18 1.2.5 Staining………...………...24 2. ISOELECTROFOCUSING………...……….……30 2.1. Reagents ………...………32 2.2. Procedure………...………..…….…………..40 3. SECOND DIMENSION……….……….39 3.1. Reagents………..…………...……….39 3.2. Procedure…………...…………...………..39 3.3. Image Analysis…………..……...………...……42 3.4. In Gel Digestion………...………44
3
Part II
1. DIFFERENTIAL EXPRESSION IN BOVINE LIVER PROTEOME…...…..46
1.1. Introduction……..………..………46
1.2. Material and Methods…..………...…….47
1.2.1. Sample preparation:………..………...………....……47
1.2.2. 2D-IEF-SDS PAGE :…………..……….………47
1.2.3. Image Analysis………...…....……..48
1.2.4. In-Gel Digestion...48
1.2.5. Protein identification by Nano-RP-HPLC-ESI-MS/MS...49
1.2.6. RNA samples Collection…………..………...50
1.2.7. Microarray Experiment...50
1.2.8. Microarray data analysis...50
1.2.9. Network analyses ………-………51
1.3. Results………...………...……….52
1.4. Discussion……….……56
2 . DIFFERENTIAL EXPRESSION IN PIG MUSCLE PROTEOME…...…..62
2.1. Introduction………....……..62
2.2. Material and Methods………..………...…64
2.2.1. Sample preparation……….……….………….64
2.2.2. Semiquantitative IEF-SDS PAGE ………….………....……….64
2.2.3. Pig Longissimus lumborum gels……….………….65
2.2.4. In-Gel Digestion ………...……..66
2.2.5. Protein identification by Nano-RP-HPLC-ESI-MS/MS...66
2.2.6. Phosphorylated proteins identification...67
2.2.7. RNA Samples Collection...67
2.2.8. Microarray experiments...67
2.2.9. Microarray data analysis ………...….68
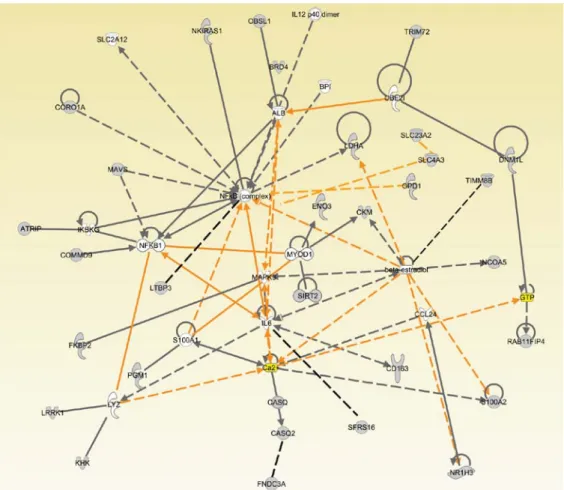
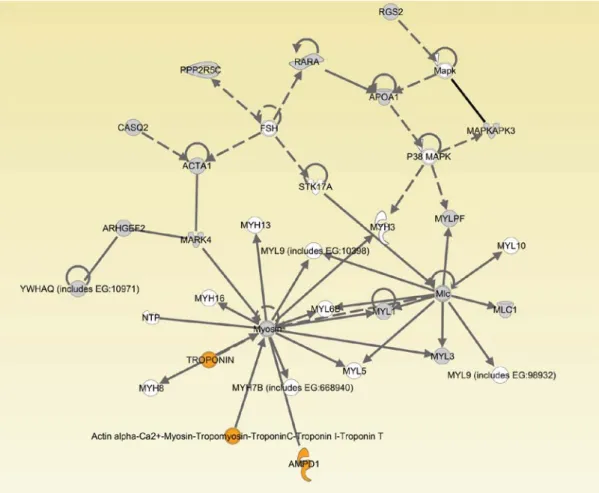
2.2.10. Network analyses ………...…68
2.3. Results………...………..70
2.4. Discussion…………...………...………..83
4
3.1. Introduction…………...………...……….92
3.2. Material and Methods………...………93
3.2.1. Sample Preparation:……… ……...………....93
3.2.2. IEF-SDS PAGE of MFGM protein fraction...94
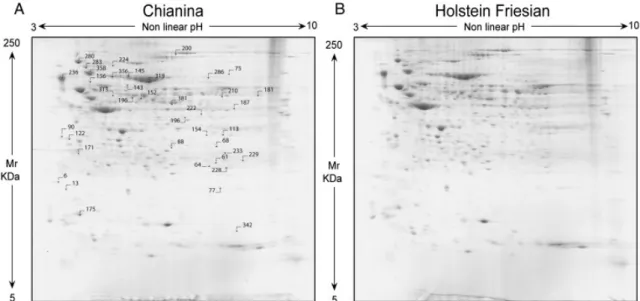
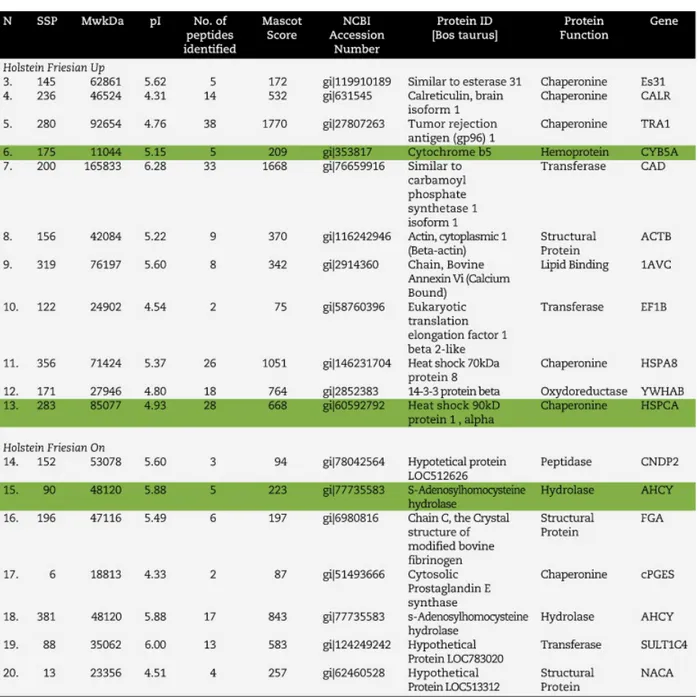
3.2.3. Friesian versus Chianina gels...95
3.2.4. In-Gel Digestion...95
3.2.5. Protein identification by Nano-RP-HPLC-ESI-MS/MS...96
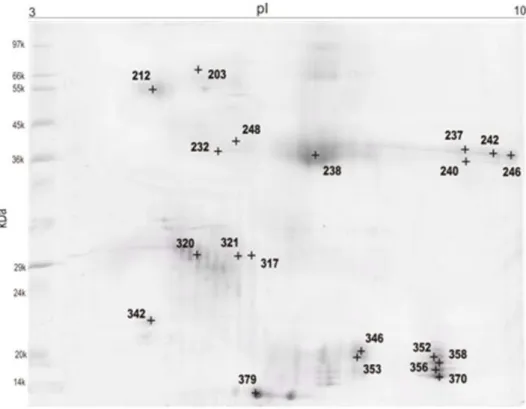
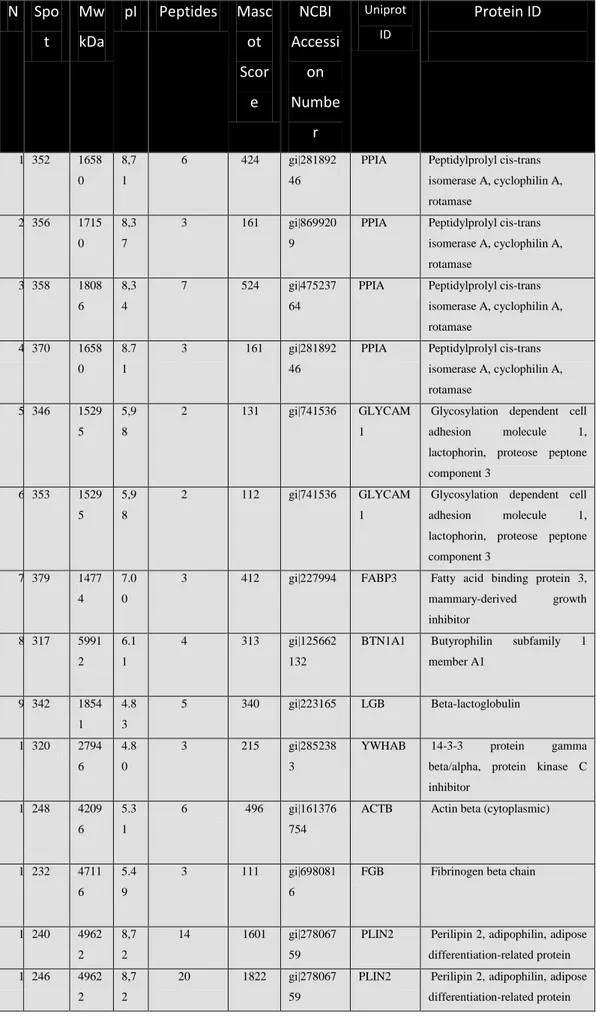
3.3. Results...97
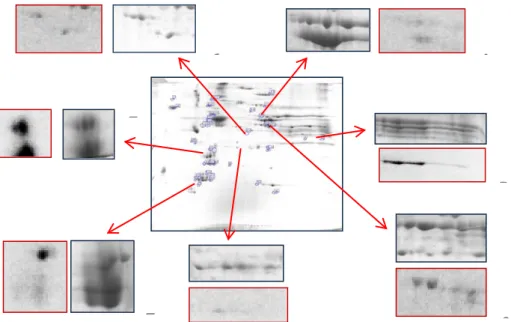
3.3.1. Intra Breed Comparison:……… ……...…………...102
3.3.2. Lactation Phase Comparison:……… ……...………....103
3.4. Discussion...103
4. CONCLUSIONS...111
ACKNOWLEDGEMENTS...113
5
AIM OF THE STUDY
During the last decade, the application of genetics to livestock production increased and the improvement of relevant traits is at present an essential element to support meat and milk consumption and to satisfy the consumer’s demands regarding eating, health and nutritional quality. The increasing consumer’s awareness of food quality and the development of the field of genomics have driven breeding companies to consider with more attention meat and milk quality, and to include quality traits as an integral part of selection programmes, where genomic markers can be incorporated. Meat quality is influenced by a large number of factors including muscle characteristics, but genetic effects play a crucial role in ‘designing’ livestock animals carcass composition and quality, although the heritability of quality traits is quite low1. Generally, between 10% and 30% of the variation in meat products quality, such as ultimate pH, colour, water-holding capacity, drip loss, tenderness, marbling, etc. is determined by the genetic background of the animal1,2. As for dairy products, Milk fat globule membrane (MFGM) represents an important milk fraction, which is rich in bioactive proteins. In order to better understand functionality of milk fractions and, thereby, enhance the benefits of milk products, detailed qualitative and quantitative protein knowledge of fractions such as MFGM
Proteomics is a powerful tool to identify relevant proteins in milk, liver and muscle. Identification of proteins associated with the various aspects of milk production and of liver can provide a baseline for new research relative to the biology of lactation and of musclular tissue.
is required.
In agricultural sciences as in all other areas of life science, the implementation of proteomics and other post-genomic tools is an important step towards more detailed understanding of the complex biological systems that control physiology and pathology of living beings. Farm animals are raised in large-scale operations, with the aim to obtain animal products for human consumption. Hence, understanding the biological traits that impact yield and quality of these products is the specific aim of much biological experimentation. However, most of the data gathered from experiments on swine and cattle are relevant not only to farm animal sciences, but also to our understanding of complex biological mechanisms of human health and diseases. In a recent review, Bendixen et al 3 point out the progress in understanding the Proteome markers for meat and milk quality in the context of individuation of these important traits. Authors intriguingly go further this
6 concept, suggesting farm animals as new generation Proteome markers for meat and milk quality, especially regarding obesity and metabolism.
Liver is considered a very interesting subject because it displays functions of synthesis, homeostasis, excretion, and defense. Two dimensional electrophoresis analyses indicated that the differentially expressed proteins correspond to liver-specific enzymes4
Proteomics has been shown an useful tool in the investigation of human liver, and examples exist especially in the pathology field
, with a major role in the metabolism of fatty acids, carbohydrates, AA, and the urea cycle.
5,6
Proteomics has been used extensively as a tool for the investigation of skeletal muscle differentiation, neuromuscular disorders and fiber aging
. On a similar route, Xu and Wang published a Comparative proteomics analysis of livers from ketotic cows. More recently, Miarelli and Signorelli investigated into the Differential expression of liver proteins in Chianina and Friesian young bulls. The latter study was more oriented on an actual characterization of the differences between the two breeds and more related on production traits.
7
Proteomics has been, and still are, used in numerous studies on skeletal muscle of livestock. Recent articles we focused on its use in the study of livestock muscle development and meat quality. Changes in protein profiles during myogenesis are described in cattle, pigs and fowl using comparative analyses across different ontogenetic stages
. Knowledge in these fields (especially the former) is undoubtley essential in the study of genomic traits in livestock.
8
. This approach allows a better understanding of the key stages of myogenesis and helps identifying processes that are similar or divergent between species. Genetic variability of muscle properties analysed by the study of hypertrophied cattle and sheep9, and even chicken10 has been discussed. Regarding pigs, Bendixen et al again pointed out interesting implications11
Studies of low birth weight offspring have a long history in pig science. These pigs have reduced growth potential and poor carcass quality compared to their higher birth weight littermates. In contemporary commercial sows with between 10 and 15 total pigs born/litter, between-litter differences in average birth weight appear to make the largest contribution to variation in postnatal growth performance, independent of numbers born
.
12 . Complementary to the raw muscle studies, intramuscular fat content studies is important for many meat quality parameters. Identifying functional categories of genes associated with natural variation among individuals in intramuscular fat content to help the design of genetic schemes for high marbling potential13.
7 Moreover, more commons are studies related to a comparison between two or more breeds with the purpose of identifying relevant markers14-16. Comparison at the level of both age and race has been performed as well
Proteomics is a valid strategy for the identification of proteins in complex mixtures, has gained popularity as a means to characterize proteins in various bovine milk fractions, both under normal physiological conditions and during clinical mastitis
17.
18
Milk fat globule membrane Fraction, in particular, has been subject of interest both as a whole-analysis subject and in comparative analysis related to mammary gland development
. The biological complexity of bovine milk has, however, precluded the complete annotation of the bovine milk proteome. Conventional approaches to reducing sample complexity, including fractionation and the removal of high abundance proteins, has improved proteome coverage, but the dynamic range of proteins present, and abundance of a relatively small number of proteins, continues to hinder comparative proteomic analyses of bovine milk.
19,20 .
It should be pointed out that cattle milk is not the only one been analysed – as an example, sow milk in different zone of the mammary gland has been successfully studied21
Ths PhD thesis is aimed to investigate through proteomics methods protein expression in livestock products (pig muscle, cattle milk and cattle liver, organ strictly related with milk production).
.
Samples provided for each esperiment belong to breeds significantly different in the specific production trait examined (Chianina has been selected for meat while Friesian has been selected for milk; Casertana has a different lean/fat mass ratio than Large White). Data obtained can be useful for the understanding of physiological mechanisms behind livestock products, for breed selection and comparison of genetic traits in livestock.
It should be pointed out that interesting results accomplished are of interest in systems biology research in terms of integration and analysis of high-throughput expression data from mammalian tissues. These studies confirm the reliability of high output expression data in genomics study22. In a recent study, Davoli et al pointed out that among the new fields of genomics recently developed, functional genomics and proteomics that allow considering many genes and proteins at the same time are very useful tools for a better understanding of the function and regulation of genes, and reported how these participate in complex networks controlling the phenotypic characteristics of a trait1. In particular, global gene expression profiling at the mRNA and protein level can provide a better understanding of gene regulation that underlies biological functions and physiology related
8 to the delivery of a better pig meat quality. Moreover, the possibility to realize an integrated approach of genomics and proteomics with bioinformatics tools is essential to obtain a complete exploitation of the available molecular genetics information. The development of this knowledge will benefit scientists, industry and breeders considering that the efficiency and accuracy of the traditional pig selection schemes will be improved by the implementation of molecular data into breeding programs1
This PhD thesis integrated proteomics data with data from post translactional analysis experiments and from transcriptomics experiments. Informatic tools are used extensively to assure a proper handling of the huge data output.
9
Part I
2D IEF SDS PAGE ANALYSIS – A BREAKDOWN
2D gel electrophoresis is generally used as a component of proteomics and is the step used for the isolation of proteins for further characterization by mass spectroscopy. In this work of Thesis the use of this technique is differential expression the comparison of two or more samples to find differences in their protein expression. The procedure shown is a comparison the tissues of Longissimus lumborum pig muscle samples.
A preliminary analysis with the purpose of optimize extraction method is shown along with principles of 1-Dimensional Sodium Dodecyl Sulphate Polyacrilamide Gel Electrophoresis. After the selection of the best extraction technique, treatment of the sample and first dimension Isoelectrofocusing separation is shown, as well as successive second dimension separation through SDS PAGE.
Procedures reported in Part I are part of the personal laboratory experience of this PhD thesis. Source literature is wide but a breakdown can be provided23-42.
10
1. SETTING EXTRACTION METHODS.
First and foremost, sample extraction must be optimized for the experiment. Sample preparation is a key factor in successful 2DE, with complete solubilisation and denaturation of sample proteins being the ultimate aim.
Comparison of the 1D SDS PAGE gel protein lanes of 10 samples of the same Longissimus lumborum muscle follows, each result of five extraction methods per two protein precipitation methods.
1.1. Reagents
1.1.1. Samples
Longissimus lumborum samples gathered as described in methods (see pag 64).
1.1.2. Extraction Buffers
Extraction Buffer (1): PBS; 0.9% (w/v), NaCl, 50 mMsodium phosphate, (pH 7.4) and 2ml of 10% (v/v) Triton X-100 in Double Deionized H2
Extraction Buffer (2): 8 mol urea, 4% w/v CHAPS, 40 mmol Tris base in Double Deionized H
O.
2
Extraction Buffer (3): 40 mMTris (pH 8), 2 mMEDTA in Double Deionized H O.
2
Extraction Buffer (4): 10 mM Tris, pH 7.6, 1 mM EDTA, and 0.25 M sucrose in Double Deionized H
O.
2
Extraction Buffer (5): 0.175 M tris/HCl pH 8.8, 5% (w/v) SDS, 15% (v/v) glycerol, 0.3 M dithiothreitol in Double Deionized H
O.
2O.
1.1.3. Precipitation
Precipitation solution 1: Precipitation solution is composed by100% Acetone.
Precipitation solution 2: Precipitation solution is composed by 12 volumes of Acetone (85,71 % of total solution), 1 Volume of Methanol (7,14 %) and 1 volume of Tributhylphosphate (7,14 %).
Resuspention Buffer: 7M Urea 2M Thiourea 4% CHAPS. In Double Deionized H2O.
1.1.4. Electrophoresis. Acrylammide: 30% T 3% C.
11 Stacking Gel Buffe(SGB)r: 25 mM Tris, 192 mM glycine, 0.1% SDS, pH 6.8 in Deionized H2
Stacking gel: for 20 ml: 5 ml SGB, 2,66 ml Acrylamide, 12,33 Deionized Water. O.
Storage Buffer: SGB 5 ml, Deionized Water 15 ml.
Running Gel Buffer (RGB): 25 mM Tris, 192 mM glycine, 0.1% SDS, pH 8.8 in Deionized H2
5% Running Gel: per 40 ml: RGB 10 ml, 6,66 ml Acrylamide, 23,33 Deionized Water. O.
17% Stacking Gel: 10 ml RGB 22,6 ml Acrylamide, 7,33 Deionizzed Water.
Sample Buffer: 4M Urea, 200 mM Dithiothreithol, 12% Sucrose, 50 mM HCl, 4% SDS, 0.01% Bromophenol Blue in Deionized H2
Cathode Buffer: 0.025 M Tris, 0.192 Glycine, 0.1% SDS in Deionized H O.
2 Anode Buffer: 0.025 M Tris, 0.192 Glycine in Deionized H
O 2
Fixing Solution 50% H
O 2
Mother Staining Solution :10% (w/v) Ammonium Sulphate, 11.8 % Phosphoric Acid, 0.1% Coomassie G250 in Deionized H
O, 40% Methanol, 10% Acetic Acid
2
Staining Solution: 80% Mother, 20% Methanol O
Caveat: Roles of Chemical Ingredients:
• Tris (tris (hydroxy methyl) aminomethane) It has been used as a buffer because it is an innocuous substance to most proteins. Its pKa is 8.3 at 20°C, making it a very satisfactory buffer in the pH range from roughly 7 to 9.
• Glycine (Amino Acetic Acid) Glycine has been used as the source of trailing ion or slow ion because its pKa is 9.69 and mobility of glycinate are such that the effective mobility can be set at a value below that of the slowest known proteins of net negative charge in the pH range. The minimum pH of this range is approximately 8.0.
• Acrylamide It is a white crystalline powder. While dissolving in water, autopolymerization of acrylamide takes place. It is a slow spontaneous process by which acrylamide molecules join together by head on tail fashion. But in presence of free radicals generating system, acrylamide monomers are activated into a free-radical state. These activated monomers polymerise quickly and form long chain polymers. This kind of reaction is known as Vinyl addition polymerisation. A solution of these polymer chains becomes viscous but does not form a gel, because the chains simply slide over one another. Gel formation requires hooking various chains together. Acrylamide is a neurotoxin. It is also essential to store acrylamide in a cool dark and dry place to reduce autopolymerisation and hydrolysis.
12
• Bisacrylamide (N,N'-Methylenebisacrylamide) Bisacrylamide is the most frequently used cross linking agent for poly acrylamide gels. Chemically it is thought of having two-acrylamide molecules coupled head to head at their non-reactive ends.
• Sodium Dodecyl Sulfate (SDS) SDS is the most common dissociating agent used to denature native proteins to individual polypeptides. When a protein mixture is heated to 100°C in presence of SDS, the detergent wraps around the polypeptide backbone. It binds to polypeptides in a constant weight ratio of 1.4 g/g of polypeptide. In this process, the intrinsic charges of polypeptides becomes negligible when compared to the negative charges contributed by SDS. Thus polypeptides after treatment becomes a rod like structure possessing a uniform charge density, that is same net negative charge per unit length. Mobilities of these proteins will be a linear function of the logarithms of their molecular weights.
• Ammonium persulfate must be made fresh as it decomposes in water. The other solutions can be pre-made and stored at 4°C. Fixing solution and staining solution are stored at room temperature.
• Urea-containing buffers should not be heat > 37°C; otherwise protein carbamylation may occur.
1.1.5. Protein Quantification
2D Quanti-Kit Amersham Biosciences
1.1.6. Image Analysis QuantityOne, Biorad.
1.2. Methods
1.2.1. Extractions Extraction one (1):
A particular care has been used to be sure that the fragmentation of the tissue could be as fine as possible.
Frozen sample of cattle Longissimus lumborum from, approximately 20 mg, were crushed in a mortar containing liquid nitrogen.
After the crushing, the material has been gathered and inserted in a 2 ml eppendorf for approximately 500 ul of volume. The remnant volume has been filled with the extraction buffer 1, added at ice-cold temperature.
After 5 minutes of violent vortexing, the sample has been left overnight (16 h) at 4°C on a rotary shaker.
The suspended samples were centrifuged at 20,000 g for 60 min at 4°C to remove tissue debris.
13 The supernatant has been centrifuged a second time at 20,000 for 60 min room temperature (25°). Lasting supernatant has been quantified and then frozen at -20°.
Extraction two (2
A particular care has been used to be sure that the fragmentation of the tissue could be as fine as possible.
): Frozen sample of cattle Longissimus lumborum from, approximately 20 mg, were crushed in a mortar containing liquid nitrogen.
After the crushing, the material has been gathered and inserted in a 2 ml eppendorf for approximately 500 ul of volume. The remnant volume has been filled with the extraction buffer 2, added at ice-cold temperature.
After 5 minutes of violent vortexing, the sample have been left on a rotary shaker at room temperature for 2 hour. Samples were taken and violently vortexed once every 15 minutes.
The suspended samples were centrifuged at 20,000 g for 60 min at 4°C to remove tissue debris.
The supernatant has been centrifuged a second time at 20,000 for 60 min at 4°C. Lasting supernatant has been quantified and then frozen at -20°.
Extraction three (3):
The volume has been gathered into a 2 ml eppendorf. Eventually, the eppendorf has been re-filled if the volume did not reach 2 ml.
Muscle was homogenized, using a potter on ice, adding progressively extraction buffer 3 up to a volume of approximatively 2 ml. Proteins has been potted in ice for approximatively 15 minutes, paying attention to finely crush the muscle as much as possible.
After 5 minutes of violent vortexing, the sample has been left on a rotary shaker at room temperature for 2 hour. Samples were taken and violently vortexed once every 15 minutes.
After that period, samples have been centrifuged at 20,000 g for 60 min at 4°C to remove tissue debris.
The supernatant has been centrifuged a second time at 20,000 for 60 min at 25°C. Lasting supernatant has been quantified and then frozen at -20°.
Extraction four (4): Muscle was homogenized, using a potter on ice, adding progressively extraction buffer 4 up to a volume of approximatively 2 ml. Proteins has been potted in
14 ice for approximatively 15 minutes, paying attention to finely crush the muscle as much as possible.
10 minutes of violent vortexing has been performed 6 times, the sample was cooled in ice after each session for approximately 5 minutes. Vortex and support were cooled at 4°C as well.
Samples were leftt on a rotary shaker at room temperature for 1 hour. Samples were taken and violently vortexed once every 15 minutes.
After that period, samples have been centrifugued 20,000 g for 60 min at 4°C to remove tissue debris.
The supernatant has been centrifuged a second time at 10,000 RPM for 60 min at 4°C. Lasting supernatant has been quantified and then frozen at -20°.
Extraction five (5):
A particular care has been used to be sure that the fragmentation of the tissue could be as fine as possible.
Frozen sample of cattle Longissimus lumborum from, approximately 20 mg, were crushed in a mortar containing liquid nitrogen.
After the crushing, the material has been gathered and inserted in a 2 ml eppendorf for approximately 500 ul of volume. The remnant volume has been filled with the extraction buffer 1, added at ice-cold temperature.
After 5 minutes of violent vortexing, the sample has been left for 2 hours at 25°C on a rotary shaker.
The suspended samples were centrifuged at 20,000 g for 60 min at 4°C to remove tissue debris.
The supernatant has been centrifuged a second time at 20,000 for 60 min at 4°C. Lasting supernatant has been quantified and then frozen at -20°C.
NOTE: Hot SDS can be used to increase initial protein solubilisation. However, before electrophoresis it must be removed by competitive displacement in SD buffer. Post solubilisation TCA/acetone extraction may be required to remove problematic components and this can be combined with SDS solubilisation.
Urea solutions, , on the other hand, CANNOT raise in temperatureif proteins are present to avoid risk of carbamylations.
15 1.2.2. Precipitations
Addition of miscible solvents such as ethanol or methanol to a solution may cause proteins in the solution to precipitate. The solvation layer around the protein will decrease as the organic solvent progressively displaces water from the protein surface and binds it in hydration layers around the organic solvent molecules. With smaller hydration layers, the proteins can aggregate by attractive electrostatic and dipole forces. Important parameters to consider are temperature, which should be less than 0°C to avoid denaturation, pH and protein concentration in solution. Miscible organic solvents decrease the dielectric constant of water, which in effect allows two proteins to come close together.
Precipitation method 1: Precipitation solution 1 has been added to an amount (300 ul) of the extracted protein solution. Precipitation solution 1 has been added in a 4:1 ration respect to the protein solution (1,200 ul, for 1,500 ul in total). Samples were kept overnight (16 h) at a temperature of -20°C. After this period, samples were centrifugued at 20,000 g for 20 minutes, 4°C. Surnatant has been decanted and dryed in vacuum at room temperature for 15 minutes.
Precipitation method 2
Resuspention: Samples have been resuspended in a volume of 500 ul of Resuspention Buffer through strong agitation. In some case, overnight agitation on rotary shaker was needed.
: Precipitation solution 2 has been added to an amount (300 ul) of the extracted protein solution. Precipitation solution 2 has been added in a 4:1 ratio respect to the protein solution (1200 ul, for 1500 ul in total). Samples were kept on a rotary shaker for 1.5 h at a temperature of 4°C. After this period, samples were centrifugued at 20,000 g for 20 minutes, 4°C. Surnatant has been decanted and dryed in vacuum at room temperature for 15 minutes.
1.2.2. Quantification
Resuspended samples have been quantified by 2D Quanti-Kit Amersham Biosciences following strictly the protocol suggested by the producers.
1.2.3. Gel Casting
Electrophoresis gel has been cast using 20x20 (front) and 20x22 cm (rear) glasses. Plastic tight spacer 1.5 thick has been used (Biorad). Glasses has been cleaned with ethanol (70% ethanol at least) and placed on support. Cleaning of and completely drying the glass
16 plates, combs, and any other pertinent materials is very important to avoid contaminations, especially of keratin.
Deionized water (followed by drying though absorbent paper) has been used to check the tight of the structure.
To insure proper alignment and casting, the glass plates, spacers, combs and casting stand gaskets must be clean and dry. Glass plates are whashed with detergent and then submerged in deionized water. Periodical wash with nitric acid assures removal of residues. The glass plates should be cleaned with 70% ethanol.
Glass plates must be assembled on a clean surface. The longest glass plate is layed down asv first, and then two spacers are placed. Spacers vary from 0.5 to 1.5 mm in thickness. One dimensional gel was 1 mm thick and 2D gels (see later) were 1.5 mm. Next, the shorter glass plate is placed on top of the spacers so that the bottom ends of the spacers and glass plates are aligned (see Fig 1).
Fig. 1.
The structure is put vertical and is slightly tighten. Then with a firm grasp the glass plate sandwich with the longer plate facing away from the operator, and gently slide into into the clamp assembly, to check alignment. If a spacer is not aligned, an extra one can be used to move it toward the border of the structure. The whole structure is tighten and then a perfect and constant pressure of support is assured to avoid dangerous, glass-breaking imbalances.
Structure hold must be tested before adding gel solution – in fact, a preemptive test with wather can avoid the chance of material loss. It should be noted that for extra safety, the bottom line of the glasses can be anointed with siliconic grease.
17 Structure could be also sealed with a 5% agarose solution, but this method has been avoided because less pratical of the siliconic grease. It is very important, after water removal, cleaning residues with laboratory absorbing paper because water residuals can alter the gel solution composition.
Running Gel has been cast using a Hoefer 15 ml gradient maker, connected to a MasterFlex C/L aspiration pump by a rubber tube. Gradient maker has been placed on a so that the bottom of the chambers are higher than the top of the gel cassette, and a stir has been placed on each chamber. Tube has been clamped into position so that the outflow is directed into the cassette from the top center. The opposite side of the rubber tube (tipped by a syringe needle) has been inserted into the glasses.
The stopcock between the gradient maker chambers and the outlet from the gradient maker has been closed. The low percentage gel solution is poured into the non-outlet (reservoir) side of the gradient maker. Opening stopcock between the two chambers and allows 0.1 - 0.3 ml of solution to flow through to clear any bubbles. Sometimes it is necessary to remove excess of gel solution with a pipette and replace it in the original chamber. Then the high percentage gel solution into the outlet side (mixing chamber) of the gradient chamber and mixing Start mixing in the gradient maker is initiated activating the mixer. A 10% Ammonium Persulfate in water (w/v) is prepared and temporarily stored in ice. Following steps need rapidity and preparation because must be carried out quickly to avoid premature polymerization.
9,5 ml of 5% (light) and 9.5 ml of 17% (heavy) gel buffer has been put into the cylinders (heavy near the pump aspiration).
When ready to pour the gel, per 100 ml of solution, 1.0 ml of 10% APS and 0.1 ml TEMED are added. Particular care should be taken to be sure to have both APS and TEMED wholly introduced into the gel solution, without spreading on the gradient maker walls.
The stopcock between the chambers can be opened. Best results are reached opening at a flow rate which will drain the solutions in 3-5 minutes. Faster flow will cause turbulence in the gel which will disrupt the gradient. Slower flow rates will allow polymerization to occur before pouring is complete Order of opening is shonw in the figure below. Gel descent has been followed up near the end of the process, where the gradient maker has been inclined to grant the remaining gel buffer being aspired and inserted between the glass walls.
18 When all of the solution is dispensed, remove the syringe tip can be removed from the top of the cassette. Running Gel reached the level suggested by the company. A 1:1 Water/2-propanol solution has been added to grant safe and streamlined gel solidification.
It is critically important to wash immediately the gradient apparatus with water to prevent polymerization within the system. Polymerization happens in about one hour (Fig 2).
Fig. 2.
After the polymerization, gel upper surface must be washed at least three times with deionized water to remove trace of isopropanol. Even in this case, absorbing paper must be used to remove residual water.
The water/2-propanol mix has been washed 5 times with deionized water and then the glass above Running Gel has been dried with absorbent paper. Stacking gel filled the structure up to the top. A 15 wells 1 cm well comb of the same thickness of the spacers has been inserted. Stacking gel has been poured in a becker with no need of special handling. It should be noted that for an optimal polymerization and to obtain straight, well defined gels, the amount of TEMED and APS per volume compared to the Running Gel cast has been doubled.
Ater solidification, wells has been washed thrice with deionized water. Wells has been filled thereafter with storage buffers, protected by dehidratation covering them with wet paper and plastic membranes, and stored overnight at 4°C. It should be noted that the purpose of the storage buffer is to maintain the chemical and osmotic conditions of the stacking gel without adding acrylamide.
1.2.4. Electrophoresis
Wells has been washed twice with deionized water and then three times with catode buffer. This has the purpose of removing every residual acrylamide filament unneeded.
19 Last iteration left cathode buffer in the wells. Samples were solubilized using sample buffer in a 1:1 ratio. Solubilization occurred for 30 minutes, with vortexing once every 5 minutes. Samples where centrifugued at 14,000 rpm for 5 minutes thereafter and supernatant containing solubilized proteins has been loaded in the wells as explained in picture 1, in an amount of 40 ug per well.
SDS in the sample buffer binds to all proteins and breaks up the weak (non-covalent) bonds of the proteins, "smoothing" them out so that they exist in long rope-like SDS-polypeptide micellular chains. Each SDS molecule has 1 negative charge. Also, SDS binds at a rate of 1.4g SDS per 1g Protein which gives all SDS-bound proteins roughly the same charge to mass ratio, and hence equal mobilities in an electric field. Focused IPG strips, before separating the proteins by mass, are treated with sodium dodecyl sulfate (SDS) along with other reagents (equilibration buffer). This denatures the proteins (that is, it unfolds them into long, straight molecules) and binds a number of SDS molecules roughly proportional to the protein's length. Because a protein's length (when unfolded) is roughly proportional to its mass, this is equivalent to saying that it attaches a number of SDS molecules roughly proportional to the protein's mass. Since the SDS molecules are negatively charged, the result of this is that all of the proteins will have approximately the same mass-to-charge ratio as each other. In addition, proteins will not migrate when they have no charge (a result of the isoelectric focusing step) therefore the coating of the protein in SDS (negatively charged) allows migration of the proteins in the second dimension (NB SDS is not compatible for use in the first dimension as it is charged and a nonionic or zwitterionic detergent needs to be used).
Prior of the connection to the power source to start the Run, the gel has been assembled on the gel cassette. Upper buffer is poured into the cathode chamber and the tank is filled with the Lower (cathode) buffer. Silicone grease is used to assure tight enclosure and avoid cathode buffer loss during the run. This is always important, but is critical especially during overnight run because if Cathode becomes dry current is stopped, proteins diffuse. After a certain amount of time, the run would be wasted even if reprised because of this diffusion (see Fig 3 for a complete schematization).
20 Fig. 3.
Gel has been set on the Electrophoresis apparatus and run at constant amperage of 40 mA per gel. Bromophenol blue present in the sample buffer has been used as a tracker. Run expired after six hours.
An electric field is applied across the gel, causing the negatively-charged proteins to migrate across the gel towards the positive (+) electrode (anode).
There are three important "current-carrying" anions in SDS PAGE: 1.) glycine from the Tris-Glycine buffer found in the buffer above the stacking gel and below the resolving gel; 2.) chloride ions from the Tris-Cl buffer in the sample buffer, the stacking gel, and the resolving gel; and 3.) SDS/protein micelles (from sample buffer, above). When the electric field is applied a "current-carrying" anion race through the gel is initiated.
Polyacrylamide gel has been known as a potential embedding medium for sectioning tissues as early as 1964. Two independent groups, Davis and Raymond, employed PAG in electrophoresis in 1959. It possesses several electrophoretically desirable features that make it a versatile medium. PAGE separates protein molecules according to both size and charge. It is a synthetic gel, thermo-stable, transparent, strong, relatively chemically inert, can be prepared with a wide range of average pore sizes. The pore size of a gel is determined by two factors, the total amount of acrylamide present (%T) (T = Total acrylamide-bisacrylamide monomer concentration) and the amount of cross-linker (%C) (C = Crosslinker concentration). Pore size decreases with increasing %T; with cross-linking, 5%C gives the smallest pore size.
This gel material can also withstand high voltage gradients, feasible for various staining and destaining procedures, and can be digested to extract separated fractions or dried for autoradiography and permanent recording. DISC electrophoresis utilizes gels of different pore sizes. The name DISC was derived from the discontinuities in the electrophoretic
21 matrix and coincidentally from the discoid shape of the separated zones of ions. There are two layers of gel, namely stacking or spacer gel, and resolving or separating gel.
Fig. 4.
Fig 4 is a Transmission-Electron Microscopic image of a polyacrylamide gel. A polyacrylamide gel is a labyrinth of tunnels, the pore size is determined by the total amount of monomer present (%T) and the amount of cross-linker (%C).
Depending on its size, each protein will move differently through the gel matrix: short proteins will more easily fit through the gel pores, while larger ones will have more difficulty (they encounter more resistance). After a set amount of time (usually a few hours- though this depends on the voltage applied across the gel; higher voltages run faster but tend to produce somewhat poorer resolution), the proteins will have differentially migrated based on their size; smaller proteins will have traveled farther down the gel, while larger ones will have remained closer to the point of origin.
An example of several run of the same example at different T percentages is reported in Fig 5.
22 Fig. 5.
Stacking gel is a large pore PAG (4%T). This gel is prepared with Tris/HCl buffer pH 6.8 of about 2 pH units lower than that of electrophoresis buffer (Tris/Glycine). These conditions provide an environment for Kohlrausch reactions determining molar conductivity, as a result, SDS-coated proteins are concentrated to several folds and a thin starting zone of the order of 19 μm is achieved in a few minutes. This gel is cast over the resolving gel. The height of the stacking gel region is always maintained more than double the height and the volume of the sample to be applied.
Stacking occurs as a result of the differential rate of migration of the protein-micelles in the presence and absence of chloride ion "clouds" that initially surround and shield the SDS/protein micelles. To achieve this clearing of the chloride cloud, the titrate-ability of the glycine anion is employed. When the electric field is turned on, glycine, in the running buffer at pH 8.3 is slightly negatively charged and as such it carries the current in the buffer until it enters the sample buffer, pH 6.8, where the glycine becomes neutral as the amino group becomes totally protonated and the carboxyl group remains de-protonated (Fig 6 and 7).
23 Fig. 6.
Fig. 7.
Chloride ions in the sample buffer and the gels create a "cloud" through which the SDS/proteins micelles can migrate only relatively slowly in the electric field. It is as if the chloride ions shield the micelle strings from experiencing the full force of the applied electric field (they don't move very fast). However, the chloride ions in the sample buffer and the gel buffers carry the current in these parts of the system initially, and start their migration toward the positive electrode upon the application of the electric field. As the
24 fastest moving species in the mix, the chloride ions, clear from the top of the sample buffer moving toward the positive electrode at the bottom of the gel, the slower moving SDS/protein micelles are left "out of the cloud of chloride". The entering glycine changes from negatively charged to neutral upon entering the pH 6.8 environment, leaving the protein-micelles unshielded so they now move faster toward the positive electrode than the micelles still in the chloride cloud lower in the sample buffer or in the gel. By the time the loaded sample reaches the Resolving (or Running) gel, the protein-micelles have managed to form a nice tight band < 1mm wide. This accounts for one component of the stacking phenomenon. The other components result from the slowing of the micelles upon encountering the various buffer-gel interfaces.
1.2.5. Staining
Gel has been removed from the support and then protein has been fixed using Fixing Solution. Gels have been inserted in to a container filled with 200 ml of fixing solution and kept 1 hour in slight agitation. After the fixation, gel has been washed three times with deionized water for approximately 15 minutes per wash.
Removal has been performed using a spacer to separate the two glasses, carfully letting the gele adhere to the larger glass (see Fig 8).
Fig. 8.
Then such spacer has been used to separate the stacking gel from the running. Stacking gel is useless from this point and is removed. Gel is thereafter submerged into a Bowl for fixation. Alimentary Bowls are perfectly suitable if endowed with hermetic enclosure (Fig 9).
25 Fig. 9.
Bowls are left floating on a Agitaror for 1 hour. Gels of lesser size, should be noted, are fixed in about 30 minutes, but for this kind of experiment 1 h is the best amount of time (Fig 10).
Fig. 10.
Fixing (or fixation) is the process whereby proteins are denatured and precipitated in large insoluble aggregates within the gel matrix. Fixation accomplishes several goals. Primarily, fixation prevents the diffusion of proteins, thus keeping the protein bands sharp and resolved during the staining process. In addition, fixation removes gel buffer components, most importantly SDS, which may interfere in the staining process. In some cases, fixatives are used which modify the proteins to enhance the staining reaction. Fixing both native and SDS denatured proteins with acetic acid and alcohol results in an uncoiling of the peptide chains to produce insoluble complexes and monomers (see Fig. 11).
26 Fig. 11.
All fixatives operate by causing precipitation of the protein by converting it to an insoluble form. The most commonly used fixatives are solutions of short chain alcohols and acetic acid in water. The combination of low pH and high organic solvent content disrupts the hydrogen bonding which holds protein structures together, and exposes hydrophobic portions of the protein core. The result is an uncoiling of the peptide chain, followed by an essentially irreversible association between chains, producing a high molecular weight complex which is trapped inside the gel.
Fixation has been performed with the fixation solution described above. After the 1-hour time of fixation, gel has been washed using the same procedure described above. Each washing has been performed with 200 ml of Deionized Water. Three washing has been performed, 15 minutes long each. Washing is dramatically important because fingin solutions decrease the performance of the staining.
27 Several staining methods for SDS PAGE gels exist. Zinc or copper staining is a negatively staining technique able to detect Detects 6-12ng of protein. The background of the gel is stained whilst the proteins leave clear spots that can be visualised against an appropriate background, but is unstable. Silver staining can give excellent results (detecting 0.5-1.2 ng proteins). Just lately a lot of new protocols have been described that are compatible with mass spectroscopy, but is a time consuming and expensive staining technique that is not suitable for a large amount of gels present in semiquantitative analysis without special equipment.. It also suffers from a lack of dynamic range, making quantification of protein in spots highly unreliable, this can be noted in some negatively stained proteins that might appear on your gel Fluorescent stains like SYPRO ruby are very sensitive (detecting 1-2 ng proteins) but are very expensive and need special equipment.
Coomassie staining are quick, easy and cheap although making even if less sensible (Detect 36-47ng). It is important to make up fresh stain regularly as it loses its sensitivity as it gets older. It should be noted that greater sensitivity in not necessary in most cases, because a greater amount of protein should be anyway needed for successive MS analysis.
A modified Neuhoff's colloidal Coomassie Blue G-250 stain with a level of detection similar to conventional silver staining, dubbed "blue silver" on account of its considerably higher sensibility, has been reported. The main modifications, as compared to Neuhoff's protocol, were: a 20% increment in dye concentration (from 0.1% up to 0.12%) and a much higher level of phosphoric acid in the recipe (from 2% up to 10%). The "blue silver" exhibits a much faster dye uptake (80% during the first hour of coloration, vs. none with a commercial preparation from Sigma). Even at equilibrium (24h staining), the "blue silver" exhibits a much higher sensitivity than all other recipes, approaching (but lower than) the classical silver stain. Measurements of stain sensitivity after sodium dodecyl sulfate-polyacrylamide gel electrophoresis (SDS-PAGE) of bovine serum albumin (BSA) gave a detection limit (signal-to-noise ratio > 3) of 1 ng in a single zone. The somewhat lower sensitivity of "blue silver" as compared to classical silvering protocols in the presence of aldehydes is amply compensated for by its full compatibility with mass spectrometry of eluted polypeptide chains, after a two-dimensional map analysis, thus confirming that no dye is covalently bound (or permanently modifies) to any residue in the proteinaceous material. It is believed that the higher level of phosphoric acid in the recipe, thus its lower final pH, helps in protonating the last
28 dissociated residues of Asp and Glu in the polypeptide coils, thus greatly favoring ionic anchoring of dye molecules to the protein moiety. Such a binding, though, must be followed by considerable hydrophobic association with the aromatic and hydrophobic residues along the polypeptide backbone.
Thus, the final decision for the staining has been for the modified Coomassie Staining Blue Silver.
After the washes, the bowl is filled with 200 ml of Staining solution and left overnight floating as described above. To avoid lost of methanol by evaporation (thus altering the methanol/mother solution ratio other than being unsafe) the bowls are sealed with plastic for the overnight staining.
After the staining, gels are submerged in deionized water and let floating one whole day. Simple absorbing paper has been added (2 pieces) to the floating bowls to ensure quick removal of the coomassie excess. Water has been changed 1 time for the same purpose. After complete destaining and background removal, gels can be scanned and analysed.
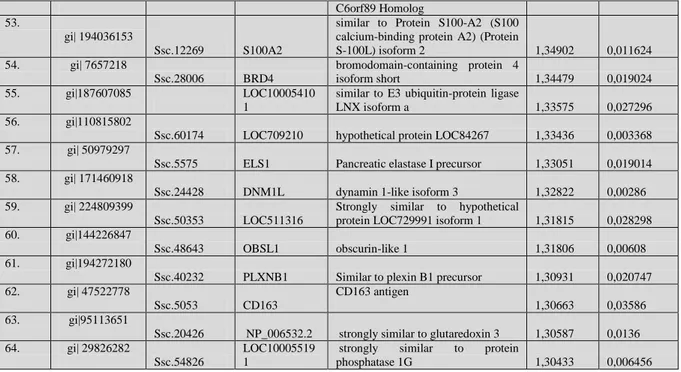
29 De-stained gels, with background staining removed, has been scanned by an Epson V700 photo scanner (Fig 12) and then the image has been analised by the software Progenesis Samespot. Results of the same extraction (1, 2, 3, 4, 5) and different precipitation (1, 2) has been matched in parallel to discover differencies among precipitation methods. Spot count has been used to identify the bands for each lane. A gel representative of all the kind of samples is shown above. There are 5 rows for each of the two precitpitaiton methods, separated by the marker. Molecular weight marker values have been added through graphic software. Spots count, per lane: 1-39; 2-54; 3-44; 4-45 5; 52. No difference has been found among precipitation methods (note: the image is B&W because even if Coomassien staining is blue, scanning is for image analysis is performed B&W at 8 or 16 bits- 8 in this case). Final selection is for Extraction method 2.
30
2. ISOELECTROFOCUSING
To separate the proteins by isoelectric point is called isoelectric focusing (IEF). Thereby, a gradient of pH is applied to a gel and an electric potential is applied across the gel, making one end more positive than the other. At all pH other than their isoelectric point, proteins will be charged. If they are positively charged, they will be pulled towards the more negative end of the gel and if they are negatively charged they will be pulled to the more positive end of the gel. The proteins applied in the first dimension will move along the gel and will accumulate at their isoelectric point; that is, the point at which the overall charge on the protein is 0 (a neutral charge).
The Immobilized pH gradient (IPG) gels are the acrylamide gel matrix co-polymerized
with the pH gradient, which result a completely stable gradients except the most alkaline (>12) pH values. The immobilized pH gradient is obtained by the continuous change in the ratio of Immobilines. This alternative method eliminated the problems of gradient instability and poor sample loading capacity associated with carrier ampholyte pH gradient.Commercial precast IPG gels are available as the image shows. Use immobiline gels is important because avoids pre-focusing (see Fig.13).
Fig. 13.
IPG strips are plastic backed, come in various lengths, but are usually 3.0mm wide and about 0.5mm thick when rehydrated. They come, dehydrated, in a variety of pH ranges. For use they must first be rehydrated, this is generally done under silicone oil. As mentioned earlier it can be beneficial to rehydrate the strips in the presence of your sample (in gel rehydration) and this is the loading method of choice in our lab and
31 enables us to load large quantities of protein. PH Range of precast IPG strips varies immensely and apholyte chosen should vary accordingly.
The standard procedure adopted up to the present proteome analysis calls for just reduction prior to the isoelectric focusing/immobilized pH gradient (IEF/IPG) step, followed by a second reduction/alkylation step in between the first and second dimension, in preparation for the sodium dodecyl sulfate-polyacrylamide gel electrophoresis (SDS-PAGE) step. This protocol is far from being optimal. It is here demonstrated, by matrix assisted laser desorption/ionization-time of flight (MALDI-TOF)-mass spectrometry, that failure to reduce and alkylate proteins prior to any electrophoretic step (including the first dimension) results in a large number of spurious spots in the alkaline pH region, due to “scrambled” disulfide bridges among like and unlike chains. This series of artefactual spots comprises not only dimers, but an impressive series of oligomers (up to nonamers) in the case of simple polypeptides such as the human α- and β-globin chains, which possess only one (α-) or two (β-) -SH groups. As a result, misplaced spots are to be found in the resulting two-dimensional (2-D) map, if performed with the wrong protocol. The number of such artefactual spots can be impressively large. In the case of analysis of complex samples, such as human plasma, it is additionally shown that failure to alkylate proteins results in a substantial loss of spots in the alkaline gel region, possibly due to the fact that these proteins, at their pI
To overcome this problem, a pre-IEF reduction and alkylation method has been used. , regenerate their disulfide bridges with concomitant formation of macroaggregates which become entangled with and trapped within the polyacrylamide gel fibers. This strongly quenches their transfer in the subsequent SDS-PAGE step.
2.1. Reagents
2.1.1. Buffers
IEF Cocktail 1(CIEF1): 7M Urea, 2M Thiourea, 2% CHAPS
IEF Cocktail 2(CIEF2): 7M Urea, 2M Thiourea, 4% CHAPS, 0.1 % EDTA, 0.85 M Tris-HCl
Iodoacetamide Cocktail: 150 ul of cockatil 2 55mM IAA Dithioerythrol Cocktail : 150 ul of cockatil 2 55mM DTE
Strip Rehydratation Cocktail: 7M Urea 2M Thiourea 2% CHAPS 5mM DTE 1% Ampholyte
32 Cup Loading Cocktail: 7M Urea 2M Thiourea 4% CHAPS 1% Ampholyte
Caveat: Is dramatically important that every solution used for IEF must be prepared with DOUBLE deionized water. Failing to do this invalidates the run due to high currents.
2.2. Procedure
Sample has been extracted and precipitated with the slected method.
IEF Cocktail 1 is prepared beforehand and stored. IEF Cocktail 2 is prepared from the 1 immediately before use. Samples are resuspended into the IEF cocktail 2, in an amount of 1mg per 1,5 ml Epepndorf vial. The vial is not filled with the CIEF2, but only 250 ul are inserted for the subsequent operations relevant for the reduction and alkylation. It should be noted that the empty space is vital for the procedure since the buffer must be put in agitation three times on a rotary shaker (Fig.14).
Tris, Urea and Thiourea purpose has been explained above, whereas EDTA has the role of being a protease inhibitor. Should be noted that in CIEF2 can be added 1% ampholite, but this option is useful for helping resuspension only.
Fig. 14.
Once the sample has been resuspended (it can last several minutes in the case of muscle samples like the ones of Longissimus lumborum) the first step of the procedure has been performed. It should be noted that before this passage, and before the successive ones, is dramatically important spin the sample after every vortexing to be sure that minuscule drops of the sample wouldn’t go dispersed after the opening of the cup – altering therefore the protein amount processed. This is even more important in the case of semiquantitative analysis.
In this study, tributyl phosphine has be used as reducing agent in the sample solution for the first-dimensional isoelectric focusing. Tributyl phosphine improves protein solubility during isoelectric focusing, which results in shorter run times and increased resolution.
33 Tributyl phosphine is nonionic and thus does not migrate in the IPG, therefore maintaining reducing conditions during the course of the first-dimensional separation.
Tributylphosphine is a tertiary phosphine, most commonly encountered as a ligand in
transition metal complexes. It is an oily liquid at room temperature, with a nauseating odor. It reacts slowly with atmospheric oxygen, and rapidly with other oxidizing agents, to give the corresponding phosphine oxide. It is usually handled using air-free techniques, in particular aimmision of an inert gas used to counterflow additions, where air-stable reagents are added to the reaction vessel against a flow of inert gas (Fig. 15).
Fig. 15.
TBP is taken with a syringe and hastily inserted into a 500 ul vial. Then very quickly 0.56 ul of TBP is inserted in every vial of sample. After a brief vortexing, sample vials are protected with parafilm and inserted in a specially modified 50 ml falcon vial (covered with black insulation adhesive tape) and kept 1 hour on the rotary shaker.
TBP assures reduction (thus separation) of disulphide bonds in proteins cistheinic groups. first step to reduces all of the cysteines present in the protein, this step is undertaken to reduce any disulphide bridges that may have formed between adjacent cysteine residues (Fig 16). For this reason, once we have carried out the reduction step we then treat the sample with iodoacetamide.
34 During the 1 hour step, Iodoacetamide Solution is prepared, but right near before recovering the sample(s). This is because the solution has a very high concentration and tends to precipitate very soon (Fig. 17).
After the spinning, 5 ul of the alkylating reagent Idoacetamide Solution per sample are added, and the rotary shaker procedure is repeated. Iodoacetamide purpose is to alkylate irreversibly the reduced SH groups. A non-reversible reaction occurs that places a functional group on the sulphide group, blocking it and ensuring that no further reactions can occur.
Fig. 17.
Iodoacetamide Alkylation reaction step is 1 hour long. After that, the sample is recovered from the rotary shaker as previously described. 5 ul of DTE Solution is added to proceed with the elimination of the Iodoacetamide excess. Dithioerythritol (DTE) is a sulfur containing sugar derived from the corresponding 4-carbon monosaccharide erythrose. It is an epimer of dithiothreitol (DTT), both molecules have a quite powerful reducing power per se.
The sample is precipitated with the precipitation solution above (since apparently no differences among the two precipitation methods were present, the less time-consuming one has been chosen). Precipitated proteins has been dried with a vacuum heat dryer and resuspended with cup loading cocktail and left shaking overnight.
Cup loading cocktail contains ampholite. As immobilines, Ampholytes are zwitterionic molecules able to act both as base and acids. Ampholytes have several properties; even
35 conductivity, high buffering capacity, soluble at isoelectric point, minimum interaction with focused proteins. All the properties help in the focusing.
Meanwhile, IPG strip rehydratation buffer is prepared. Rehydratation buffer contains ampholite. Since the pH range selected for the experiment is 3-10, every ampholyte mix added has the same pH extention. Reswelling tray is cleaned and prepared, carefully cheking balance. Rinse thoroughly with double distilled water. Use a cotton swab or a lint-free tissue to dry the holder or allow it to air-dry. Handle clean holders with gloves to avoid contamination. Note: The holder must be completely dry before use (Fig 18).
Fig.18.
Each Reaselling tray that will store a strip is filled with a variable volume of rehydratation buffer. Exact volume value is indicated by the company, but in case of cup loading method here used, since no protein is present in the rehydratation, is completely safe advised use greater values. Hence, each tray has been filled with 700 ul of buffer (400 was the minimum value). In case of passive rehydratation, ensuring complete sample uptake, without applying excess rehydration solution is important.
After that, IPG strips are removed from the storing box (Fig.19) (they are generally stored at -20°C) and carefully separated from their protective plastic layer and quickly placed in the trays. Act rapidly is dramatically important in this step because the buffer evaporates quickly invalidating the concentrations and then the experiment. Pipette the appropriate volume of rehydration solution into each well of the focusing tray. Deliver the solution slowly at a central point in the well. Remove any large bubbles.
36 Fig. 19.
IPG strips are placed downside into the trails using a pincer. Is vital remove carefully every bubble to grant a coherent rehidratation. IPG strips are then covered with mineral oil (to avoid dehydratation) and the tray cup is replaced. Pipette the fluid dropwise into one end of the well until one-half of the IPG strip is covered. Then pipette the fluid dropwise into the other end of the well, adding fluid until the entire IPG strip is covered. Finally, the wole structure is covered with a black drape to avoid light (since ampholites are light-sensitive).
After strips are rehydrated and samples dissolved, when the rehydration cassette had been thoroughly emptied and opened, the strips were transferred to the support. The support is a plastic grooved surface which is placed with an oiled ceramic surface able to assure cooling (the horizontal gels on their glass or plastic sheets are arranged on water-cooled plates since this allows the heat generated by electrophoresis to be readily dissipated and so avoid distortion of the separating protein bands. As with vertical polyacrylamide slab gels, multiple samples can be analysed side by side.). The support has connectrion for the current (anode and cathode, Fig. 20).
37 IPG strips are placed with the gel side up, having care of putting the sign up, then paper electrode wicks are wet with double deiionized water (excess is removed through laboratory absorbing water). Paper wicks are placed over the strips and then electrodes are placed on them, fimmobilizing the strips. Paper whicks purpose is to enhance and assure the current passage from the electrode to the IPG strip. Pressure blocks on the underside of the cover ensure that the IPG strip maintains good contact with the electrodes as the gel swells. A third support is added – the support for cups. Cups are small supports which vehicle the protein transfers from the buffer to the IPG strips through application of voltage (Fig 21).
Fig. 21.
This passage is dramatically important because if the cup does not adhere completely to the strip, the sample is lost but if the strip is penetrated the runs is wasted. Hence, the cups are placed with care, and prior of the run the hold is chcked with some buffer without sample. Then sample is placed into the cups (is very recommendable sing up the order). To maximize reproducibility among samples and to be sure that all the sample is loaded, vials are spinned twice and pipette tips are slowly de-filled.
Then, a current chek is performed. If positive, cups and thereafter the whole structure are covered with mineral oil to avoid buffer dehydratation and to help cooling system and the run can start.
It advantagious to run our strips at low voltage first, then ramp up to higher voltages after the current has settled down. For strips of this length and pH range, the complete breakdown is: 150 V 1h, 300 V 1h, 500 V 1h, 800 v 1,5 h, 1500 V 1h, 2,000 V 1h, 3,000 V 1h, 3,500 V up to 85,000 V/h total (more than an overnight run generally).
All this equipment has a number of guidelines which must be adhered to. Temperatures of around 20oC should be used and this should be kept constant as it is a variable and may affect the pI of sample proteins. Increasing the temperature too much above this may result in carbamylation of the proteins. Much lower temperatures may cause precipitation
38 of components such as urea. Cooling systems can be air or water based – in the case of the ceramic support shown, cooling is water based.
Is optimal to limit the run by amperage if possible, Bio-Rads Protean IEF is set to 50mA per gel as standard. Optimisation of each system will undoubtably be required; however, as there are so many variables you may be required to take some "leaps of faith." A good tip to ensure that the IEF is running correctly is to watch the bromophenol blue front carefully. It should slowly migrate toward the anode. If it does not migrate discretely or breaks down into a number of bands be very suspicious, you may have a problem. Should be notetd that the bromophenol blue migration cannot be used to measure the progress of the IEF run, it simply gives you a point of reference. Once the run is complete the strips can either be used immediately or frozen down at -70o
Focusing time depends on gel length, pH-gradient and gel additives (carrier ampholytes etc.). Focusing time is shorter when separation distance is shorter, or when wide-range pH-gradients are used, or when carrier ampholytes are added to the reswelling solution.
C for use later.
After the run, strips are ready for 2D electrophoresis, but can be strored in plastic layers and frozed (-20°C minimum), for days before the run.
As an alternative, when using the reswelling tray for in-gel rehydration, the sample volume has to be limited to the size of the IPG strip so that no superfluous sample solution is left in the tray. For a 180 mm long and 3 mm wide IPG strip, the correct sample volume is about 350 μl. When the reswelling tray is used for sample application, one should be aware that high molecular weight, alkaline and/or membrane proteins may not enter the IPG gel matrix properly
39
3. SECOND DIMENSION
2-D electrophoresis begins with 1-D electrophoresis but then separates the molecules by a second property in direction 90 degrees from the first. In 1-D electrophoresis, proteins (or other molecules) are separated in one dimension, so that all the proteins/molecules will lie along a lane but that the molecules are spread out across a 2-D gel (Fig. 22). Because it is unlikely that two molecules will be similar in two distinct properties, molecules are more effectively separated in 2-D electrophoresis than in 1-D electrophoresis.
Fig. 22.
3.1. Reagents
Essentially, the mechanism is very similar to 1D SDS PAGE – Gel Casting, Run and correspondent buffers are the same. Additional reagents are:
Equilibration Buffer: 8M Urea, 30% Glycerol, 50 mM Tris-HCl, 1% SDS. Sealing Buffer: 0.5% Agarose in Cathode Buffer, 0.2% Bromophenol Blue.
3.2. Procedure
The strips must be equilibrated before they can be used for SDS-PAGE. In fact, the equivalent of the well for 1D SDS PAGE is the focused protein band in the IPG strip. This is necessary for a number of reasons which are reflected in the components of the equilibration buffer. As the second dimension is SDS-PAGE it is important that the proteins are treated with SDS to give them a negative charge.
40 The pH 6.8 comes from conventional protocols, when a stacking gel was employed. Most of 2-D separations are run without a stacking gel, because it is not needed. an equilibration buffer with a higher pH works better because of several reasons: 1. The proteins are higher charged and stick thus better to the charges of the immobilized pH gradient in the IPG strips, thus you lose less proteins during equilibration. 2. The SDS sticks better to the proteins at higher pH. This is particularly important when iodoacetamide is used in the second equilibration step, considerably lowering the pH of teh buffer (even if not relevant in our case).
At this stage, equlibration should be splitted in reduction and alkylation, but since this has been already addressed before IEF, a single 30 min equilibration will occur. Glycerol (37%) are incorporated into thestacking gel to suppress electroendosmotic effects
After the equilibration, the IPG gel strips are washed with Upper Buffer and placed on a glass before being loaded on gels. Wetting the plastic back of the IPG strip with running buffer, other than stop the equilibration, makes them slide easily on the glass. The equilibrated strips with the plastic backing on the glass are placed and gently pushed the strip down onto the gel surface.
It is important not to compress the soft acrylamide strip against the opposite side of the glass, which will interfere with the protein transfer. Is optimal use carefully a spacer for this, ideally of lesser tightness compared to the Ensure that there are no air bubbles between the IPG strip and the resolving gel interface. Add a molecular weight marker that has been blotted onto a small piece of filter paper if desired. (Fig. 23).
Fig. 23.
Strips are loaded on 2D gel and sealed with an agarose buffer. In the second dimension, proteins on the basis of their molecular weight with larger proteins being retained higher
41 in the gel and smaller proteins being able to pass through the sieve and reach lower regions of the gel (Fig. 24). Run is performed as above, but since semiquantitative electrophoresis needs several replicates, several gels are cast in the same time.
Fig. 24.
Gel multicast follows the comunicant vessels principle. Gradients are cast inserting the rubber tube in the orifice below (see figure, right) and inverting the order of the heavy and Light gel buffer. In this case, since the acrylamide percentage chosen is constant, the gel has been poured from above. Being a second dimension gel, the thickness chosen for the spacer is 1,5 mm (Fig. 25).
Fig. 25. Since for reproducibility of the experiment is strongly suggested run all the gels together, or at least in comparable conditions. All the replicates of the experiment has been run with a multiple parralele run device (Fig. 27) Since gel thickness is higher, the current per gel chosen has been 40 mA. Should be noted that an even greater care should be taken to assure that there is not Upper Buffer loss – the run instead of simply stop for every gel,
42 would stop fo a couple and continua at an ahigh, unsitable amperage for other gels, for disateful consequences.
Fig.27
At the end of the run, the gels are handled in the same way as described above, staining and de-staining included. Should be noted that for statistical accuracy an huge amount of run and replicates must be performed (Fig.28).
Fig. 28.
3.3. Image analysis.
43
Fig. 29.
Software helps in the analysis of gel images through a process of image quality assessment with feedback to help you optimise image capture - vital for accurate image analysis (Fig 29). An image intensity histogram provides feedback on intensity levels in use and dynamic range of each image captured. Any positional errors introduced during scanning can be corrected using in-built tools (Fig. 30).
Fig. 30.
The visual tool helps the operator to perform automated image alignment. The result is perfectly aligned images at the pixel level, with 100% matching and no missing values, which radically reduces the need for editing spot detection and re-matching.
44 Fig. 31.
The software is endowed of a tool that allows you to apply a statistical analysis and make reliable conclusions. Principal Components Analysis (PCA), Correlation Analysis, Power Analysis and q-values (false discovery rate adjusted p-values) are included to explore the trends in data acquired (Fig. 31).
The final output points out relevant and significantly different spots eligible for excision and mass spectrometry analysis.
3.4. In Gel Digestion
The in-gel digestion is part of the sample preparation for the mass spectrometric identification of proteins in course of proteomic analysis.
Spot are picked using a surgeon scalpel or a custom cut pipette tip (very useful because one canset the radius of the cut gel piece (Fig. 32).