Index
INDEX ... I LIST OF FIGURES ... IV LIST OF TABLES ... IX SYMBOLS AND ABBREVIATIONS ... X
ABSTRACT ... 1
RIASSUNTO ... 1
PREFACE ... 3
CHAPTER 1. BIOGAS AS AN ALTERNATIVE AND RENEWABLE ENERGY SOURCE ... 4
1.1 FOSSIL FUELS ... 4
1.2 BIOGAS AS A RENEWABLE SOURCE OF ENERGY ... 5
1.2.1 Environmental benefits ... 5
1.2.2 Health and social benefits ... 6
1.3 BIOGAS STATUS IN THE EUROPEAN CONTEXT ... 7
1.4 BIOGAS APPLICATIONS ... 8
1.4.1 Heating ... 8
1.4.2 Electricity ... 9
1.4.3 Power co-generation ... 9
1.4.4 Fuel for transportation ... 10
1.5 BIOGAS PRODUCTION VIA ANAEROBIC DIGESTION ... 10
1.6 PURIFICATION PROCESS: TRANSFORMING BIOGAS INTO BIOMETHANE ... 14
1.6.1 Cleaning ... 15
1.6.2 Upgrading: Removal of CO2 ... 16
CHAPTER 2. MEMBRANES FOR CO2 REMOVAL ...19
2.1 INTRODUCTION ... 19
2.2 MEMBRANE DEFINITION AND CLASSIFICATION ON THE BASIS OR MORPHOLOGY ... 19
2.2.1 Membrane morphology ... 20
2.2.2 Transport properties in relation to the membrane morphology ... 20
2.3 DENSE POLYMERIC MEMBRANES: STRUCTURE AND PREPARATION ... 22
2.3.1 Membrane structure ... 22
2.3.2 Dense polymer membrane materials ... 24
2.4.1 The solution-diffusion mechanism in homogeneous membranes ... 27
2.4.2 Dual mode sorption ... 31
2.4.3 Facilitated transport membrane ... 33
2.4.4 Mixed matrix membranes ... 35
CHAPTER 3. PEBAX®/PAN HOLLOW FIBRE MEMBRANES FOR CO 2/CH4 SEPARATION ...39
3.1 INTRODUCTION ... 39
3.2 EXPERIMENTAL ... 41
3.2.1 Materials ... 41
3.3 MEMBRANE PREPARATION ... 41
3.3.1 Hollow fibre preparation ... 41
3.3.2 Composite Pebax ® /PAN membrane preparation by dynamic coating method ... 42
3.4 CHARACTERIZATION TECHNIQUES ... 43
3.4.1 Chemical and morphological analysis ... 43
3.4.2 Rheological characterization of the Pebax ®1657 solution ... 43
3.5 TRANSPORT PROPERTIES ... 44
3.5.1 Water permeability ... 44
3.5.2 Gas permeability ... 45
3.6 RESULTS AND DISCUSSION ... 46
3.6.1 Porous hollow fibre supports ... 46
3.7 THIN FILM COMPOSITE HOLLOW FIBRE MEMBRANES ... 47
3.7.1 Membrane preparation ... 47
3.7.2 Membrane morphology and structure ... 49
3.7.3 Transport properties of Pebax® /PAN composite hollow fibre membranes ... 50
3.7.4 Effect of the Pebax® concentration ... 51
3.7.5 Effect of Pebax® solution viscosity... 52
3.7.6 Effect of Pebax® solution temperature ... 54
3.8 MODELLING OF THE TRANSPORT PROPERTIES ... 56
3.8.1 Setup of an Artificial Neural Network ... 56
3.8.2 Construction of a hybrid model for model validation and determination of the effective thickness of the dense layer in the case of pinhole defects ... 60
3.9 CONCLUSIONS ... 63
CHAPTER 4. PRELIMINARY STUDY ON THE POTENTIAL USE OF MEMBRANE CONTACTORS FOR CO2/CH4 SEPARATION BY FACILITATED CO2 TRANSPORT IN IONIC LIQUIDS ...65
4.1 ABSTRACT ... 65
4.2 INTRODUCTION ... 65
4.3.2 Pure gas sorption experiments ... 68
4.4 RESULTS AND DISCUSSION ... 71
4.4.1 Comparison of the CO2 solubility in different ionic liquids ... 71
4.4.2 Comparison of the interaction between the enzyme and hydrophilic and hydrophobic ILs ... 73
4.4.3 CO2 sorption in IL with different water activity ... 76
4.4.4 CO2 and CH4 sorption results on [BMIM][OTf] IL with carbonic anhydrase ... 77
4.4.5 CO2 and CH4 adsorption in a Membrane Contactor with stagnant IL ... 78
4.4.6 Pure CO2 sorption in membrane contactor with recirculation of the IL ... 79
4.5 CONCLUSIONS ... 80
CHAPTER 5. MIXED MATRIX MEMBRANES WITH ZR/CR-BASED MOFS DISPERSED IN PIM-1 FOR CO2/CH4 SEPARATION 82 5.1 INTRODUCTION ... 82
5.2 EXPERIMENTAL ... 84
5.2.1 Materials ... 84
5.2.2 Membrane preparation ... 86
5.2.3 Gas permeation measurements ... 87
5.3 RESULTS AND DISCUSSION ... 90
5.3.1 Theory for gas transport in mixed-matrix membranes ... 90
5.3.2 Gas permeation data ... 94
5.3.3 Comparative study based on the Robeson diagram ... 101
5.4 CONCLUSIONS ... 102
CHAPTER 6. GENERAL CONCLUSIONS ... 104
6.1 ADVANTAGES AND LIMITATIONS OF PEBAX®/PANHOLLOW FIBRE MEMBRANES ... 104
6.1.1 Cost of membrane and their marketing ... 104
6.1.2 Mechanical and performance stability ... 105
6.1.3 Processability and scale-up ... 106
6.2 ADVANTAGES AND LIMITATIONS OF MEMBRANE CONTACTORS FOR CO2/CH4 SEPARATION BY FACILITATED CO2TRANSPORT IN IONIC LIQUIDS ... 106
6.3 ADVANTAGES OF MIXED MATRIX MEMBRANES ... 107
6.4 COMPARISON BETWEEN DIFFERENT KIND OF MEMBRANES AND FUTURE DIRECTIONS ... 107
BIBLIOGRAPHY ... 110
ACKNOWLEDGEMENTS ... 118
PERSONAL ACKNOWLEDGEMENTS ... 118
RINGRAZIAMENTI... 120
List of Figures
Figure 1.1. Energy Supply in the world [2] ... 4
Figure 1.2. Schematic representation of the sustainable cycle of anaerobic co-digestion of animal manure and organic wastes [8]. ... 6
Figure 1.3. Biogas production in the EU countries [12] [13] [14] ... 8
Figure 1.4. Steps of anaerobic digestion and microbial enzymes catalyzed carbon flow during anaerobic digestion [16]. ... 11
Figure 2.1. Membrane for CO2/CH4 gas separation ... 19
Figure 2.2. Gas permeation mechanisms through membranes ... 21
Figure 2.3. a) Dense membrane; b) asymmetric integrally skinned membrane; c) thin film composite membrane. ... 22
Figure 2.4. Robeson plot showing the rubbery and glassy membrane performances for CO2/CH4 separation (a) 1991 and (b) 2008 . ... 26
Figure 2.5. Representation of the concentration profile of a gas across a dense polymer membrane governed by Fick's law. ... 28
Figure 2.6. Diffusion coefficient as a function of molecules dimension [21]. ... 30
Figure 2.7. Solubility coefficient as a function of the molecular dimension, expressed as the Van der Waals volume [21]. ... 31
Figure 2.8. Schematic representation of a dual-mode sorption [21]. ... 32
Figure 2.9. a) Schematic representation of a facilitated transport with a fixed carrier. b) Schematic representation of a facilitated transport with a mobile carrier. ... 34
Figure 2.10. Carbonic Anhydrase Enzyme structure and schematic representation of the catalytic reaction ... 35
Figure 2.11. Several examples of the molecular sieving materials: a) zeolite; b) carbon molecular sieves (CMS); c) carbon nanotubes (CNTs); d) metal–organic frameworks (MOFs). ... 36
Figure 3.1. Scheme of the cross-flow filtration coating setup: 1) Pebax® solution tank; 2) circulation pump; 3) PAN hollow fibre module; 4) permeate; 5) manometer 6) pressure control valve. ... 43
Figure 3.3. Transport properties of the hollow fibre porous support. a) Water permeability. b) Gas permeance of He, CH4, N2, CO2 at room temperature
and ΔP = 0.5 bar. ... 47
Figure 3.4. Permeation rate of Pebax® solution at different concentration (left side) and
of the EtOH/water mixture (right side) through a PAN porous support during coating process. ... 48
Figure 3.5. SEM images of the cross section of: a) C3 composite hollow fibre membrane; b) detail of the Pebax® coating layer on the inner surface. ... 49
Figure 3.6. a) Structure of the polymers; b) FTIR spectra of PAN porous support and of a Pebax® composite membrane. ... 50
Figure 3.7. a) CO2/CH4 permselectivity vs. concentration and number of coating for
Pebax®/PAN composite membranes; b) Influence of feed pressure on gas permeability of CO2, He, CH4, and N2 at room temperature for membrane
C3; c) Permeance through C3 membrane vs. the permeability of different gases through a neat Pebax® dense membrane [24]. ... 51
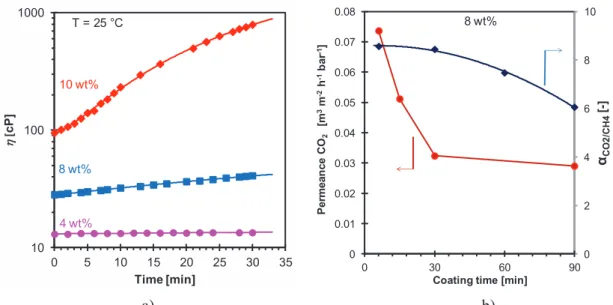
Figure 3.8. a) Viscosity (T = 25°C) as a function of time for Pebax®1657 solutions with different concentrations. b) Resulting permeability and permselectivity of membranes coated with the 8 wt.% solution for different coating times . ... 53
Figure 3.9. Influence of time on the rheological properties of a 8wt.% Pebax® solution at 25°C. ... 54
Figure 3.10. Effect of temperature on: a) Viscosity of 10 wt.% Pebax®1657 solutions. b) CO2/CH4 permselectivity and c) CO2 permeance of composite membranes
coated with a 10 %wt solution at three different temperatures ( 25 °C; 35 °C; 45 °C). ... 55
Figure 3.11. Structure of the implemented ANN model ... 57
Figure 3.12. The flow diagram of the ANN algorithm. ... 58
Figure 3.13. Neural model performance referred to training and structure of the test data. 59
Figure 3.14. Comparison between experimental values and neural model predictions using as input variables: a) a single coating, 30 min coating time and membrane pressure bar. b) a single coating, 60 min coating time and trans-membrane pressure bar. ... 59
Figure 3.15. Graphical visualization of the determination of the effective membrane thickness for two representative thin film composite membrane according to
the fitting procedure with Eq. 3.11 described in the text. Graphs (A, C) represent a selective membrane with negligible pinhole defects; graphs (B,D) represent a moderately selective membrane with pinhole defects. Neat Pebax® 1657 data are taken from Ref. [61]. ... 63
Figure 4.1. Imidazolium cation structure used in this work and specific structures ... 67
Figure 4.2. Pressure-decay experimental setup: FV feed volume, AC gas absorption compartment, TC temperature controller, PI pressure transducer. ... 68
Figure 4.3. Gas experimental with mixture set-up: GMT Gas mixture tank, MC membrane contactor, GC Gas chromatograph with computer. ... 70
Figure 4.4. CO2 solubility for [BMIM][NTf2]and [EMIM][NTf2] ILs with the same anion
and different cation. ... 71
Figure 4.5. a) CO2 solubility and b) CO2 Diffusion for [BMIM][BF4], [EMIM][NTf2],
[EMIM][dca]. ILs with different anions and same [EMIM] cation... 72
Figure 4.6. a) CO2 solubility; b) CO2 Diffusion and permeability for different ILs with
same cation and different anions ([BMIM][PF6], [BMIM][NTf2] and
[BMIM][OTf]). ... 73
Figure 4.7. The equilibrium reaction of CO2 to bicarbonate by carbonic anhydrase. ... 74
Figure 4.8. CO2 solubility for all ionic liquids in the present studies. ... 74
Figure 4.9. CO2 solubility (a), CO2 Diffusion (b), CO2 Permeability (c) for [EMIM][BF4]
and [BMIM][OTf] pure and with 0.5% of enzyme. ... 75
Figure 4.10. CO2 solubility for the [BMIM][OTf] as function of different water activity.
The curve is indicated as a guide to the eye. ... 77
Figure 4.11. a) CO2 solubility and b) CO2 diffusion coefficient in [BMIM][OTf] as
function of the enzyme concentration. ... 78
Figure 4.12. Gas composition in the shell side for membrane contactor with PAN hollow fibres and [BMIM][OTf]. ... 79
Figure 4.13. Trend in the gas concentration as a function of time, and calculated solubility of CO2 and CH4 in the IL [BMIM][OTf]. ... 80
Figure 5.1. Chemical structure of PIM-1 ... 84
Figure 5.2. a) Illustration of Octahedral (left) and tetrahedral (right) cages of UiO-66 Color scheme: Zr (cyan); O (red); C (gray); H (white), adapted from [99]; b) non-functionalized benzene-1,4-dicarboxylates and functionalized with (-NH2) and (COOH)2 ligands . c) Zeotype architecture of MIL-101 showing
pentagonal (A) and 15 Å hexagonal (B) windows of cages. d) ethylene diamine (ED) ligand used to functionalize the MIL-101... 85
Figure 5.3. Schematic representation of a permeation measurement with the determination of the time lag from the tangent to the steady state pressure increase curve. ... 88
Figure 5.4. Example of the pressure increase curves with indication of the time lag determination for six permanent gases He, H2, N2, O2, CH4 and CO2 in
membrane Uio-66-(COOH)2 10:1 ... 89
Figure 5.5. Schematic representation of the gas permeation trough the mixed-matrix membrane: a) According the first case Pd » Pc;b)According the second case
Pd « Pc; c) According the Maxwell-model (0 < Pd < ∞) (figures adapted from
[107]); ... 90
Figure 5.6. Graphic representation of gas transport properties of the previous cases for different filler concentrations. The dashed lines delimit the range of permeabilities predicted by the Maxwell model. The points indicate an example where the filler in the MMM slightly increases the permeability of the polymer matrix. ... 92
Figure 5.7. Summary of relationship between the morphology at the interface and gas transport properties of a generic mixed matrix membrane. Adapted from [105] ... 94
Figure 5.8. a) Permeabilities for CO2, H2, He, O2, CH4, N2, of MMMs as a function of
MOF ED-MIL-101 loading (wt%), compared to that of neat PIM-1; b) CO2
and CH4 permeabilities as a function of ED-MIL-101(wt %) concentration.
The lines correspond to the fit of the experimental data with Maxwell equation for the lower limit and the upper limit with Pd=0 and Pd = ∞, respectively; c) Diffusion and d) Solubility coefficient as a function of the MOFs concentration. Except in figure b), the lines are solely reported ad a guide to the eye. ... 95
Figure 5.9. a) Permeabilities for CO2, H2, He, O2, CH4, N2, of MMMs as a function of the
UiO-66(Zr) loading (wt%), compared to that of neat PIM-1; b) CO2 and CH4
permeabilities as a function of the UiO-66(Zr) concentration. The lines correspond to the fit of the experimental data with Maxwell equation for the lower limit and the upper limit with Pd=0 and Pd = ∞, respectively; c)
Diffusion and d) Solubility coefficient as a function of the MOFs concentration. The lines are solely reported ad a guide to the eye. ... 97
Figure 5.10. a) Permeabilities for CO2, H2, He, O2, CH4, N2, of MMMs as a function of the
UiO-66-NH2 loading, compared to that of neat PIM-1; b) CO2 and CH4
permeabilities as a function of the UiO-66-NH2 concentration. The lines
correspond to the fit of the experimental data with Maxwell equation for the lower limit and the upper limit with Pd=0 and Pd = ∞, respectively; c) Diffusion and d) Solubility coefficient as a function of the MOFs concentration. The lines are solely reported ad a guide to the eye. ... 98
Figure 5.11. a) Permeabilities for CO2, H2, He, O2, CH4, N2, of MMMs as a function of the
UiO-66-(COOH)2 loading (wt%), compared to that of neat PIM-1; b) CO2
and CH4 permeabilities as a function of the UiO-66-(COOH)2 concentration.
The lines correspond to the fit of the experimental data with Maxwell equation for the lower limit and the upper limit with Pd=0 and Pd = ∞, respectively; c) Diffusion and d) Solubility coefficient as a function of the MOFs concentration. The lines are solely reported ad a guide to the eye. ... 99
Figure 5.12. CO2 and CH4 permeability as cast (black) and MeOH (white). a) increasing
the ED-MIL-101 loaded; b) increasing the UiO-66 loaded; c) increasing the UiO-66-(NH2) loaded; d) increasing the UiO-66-(COOH)2 loaded. ... 100
Figure 5.13. Robeson’s plot of CO2/CH4 selectivity for a) ED-MIL101 b) UiO-66-(NH2)
c) UiO-66 d) UiO-66-(COOH)2/PIM-1 membranes with 9wt % (yellow), 17
wt% (blue), 23wt% (green), 30 wt% (red). PIM-1 data are reported for comparison (open symbols). The red line represents the Robeson 2008 upper bound [109]. ... 102
Figure 6.1. Aging effect on the a) CO2/CH4 selectivity and b) in the CO2 permeance of
List of Tables
Table 1.1. Quantification of the yield of biogas as function of m3 of biomass [6] ... 13
Table 1.2. Composition of the biogas by landfill and of the biogas by digestor compared with the composition of natural gas extracted from North Sea and from the Slochteren gas field in The Netherlands [17]. ... 13
Table 1.3. Amount of biogas produced per m3 of biomass. ... 14
Table 1.4. The raw biogas composition [8] ... 15
Table 1.5 Comparison of the requirements and performance of different upgrading techniques ... 18
Table 2.1. Permeability and selectivity of polymeric membranes ... 26
Table 2.2. Kinetic diameter and molecular weight of various gases [33] ... 30
Table 3.1. Summary of spinning conditions for the preparation of PAN hollow fibres. ... 42
Table 3.2. Transport properties of composite hollow fibre membranes coated at different conditions. ... 50
Table 4.1. Chemical structures and conventional codes of the ionic liquids studied ... 67
Table 4.2. Characteristics of ionic liquids studied ... 75
Table 5.1. Composition of the membranes studied in the present chapter ... 86
Table 6.1. Principal Suppliers of membrane natural gas separation system [111] ... 105
Table 6.2. Comparison of different types of membranes for CO2/CH4 separation adapted from [111] ... 108
Symbols and abbreviations
Symbol Quantity Common units
R Universal gas costant J / mol × K
T Temperature K
d Diameter of molecule m
rp Pore radius m
J Permeate flux L/h m2
C1 Concentration at feed side mol/L
C2 Concentration at permeate side mol/L
D Diffusion coefficient cm2/sec
S Solubility coefficient cm3/cm3 bar
l Membrane thickness cm
Kd Henry’s costant mol/atm·L
f Gas fugacity bar
CH Gas concentration in microvoids mol/L
MW Molecular weight g/mol
Kd Kinetic diameter Å
Peff Effective permeability Barrer
Pd Permeability of discontinuous phase Barrer
Pc Permeability of continuous phase Barrer
PMMM Effective permeability of the mixed matrix membrane Barrer G’ G prime Pa G’’ G double prime Pa Jw Water flux L/h m2 Vp Permeate volume cm3 t time sec A Membrane areae cm2
Pw Water permeance L/h m2 bar
Qp Permeate flow rate cm3/sec
P Permeability m3 m/m2 h ba
a Activity -
p Pressure bar
p0 Saturated vapour pressure bar
pt Permeate pressure bar
pf Feed pressure bar
Leff Effective thickness µm
Cgas Gas concentration mol/dm3
z Vertical position in the solvent m
Hgas Henry’s costant in the solvent bar
Greek
symbol Quantity Common units
a Selectivity -
l Knudsen Flux L/h m2
Q Time lag s
Δp Pressure difference bar
F Volume fraction -
tan(δ) Loss angle -
h Viscosity cP
π Gas vapour permeance m3/m2 h bar
r Density g/cm3
Abbreviation Full name
PAN Polyacrilonitrile PVP Polyvinylpyrrolidone DMF Dimethylformamide PEO Polythyleneoxide EtOH Ethanol EO Ethylenoxide PEI Polyetherimide PDMS Polydimethylsiloxane PTMSP Poly(1-trimethylsilyl propyne)
PMP Poly(4-methyl-2-pentyne)
Pfs Polysulfone
PPO Polyphenyleneoxide
SLMs Supported liquid membranes
FCMs Fixed carrier membranes
MCMs Mobile carrier membranes
MMMs Mixed Matrix membranes
CMS Carbon molecular sieves
CNTs Carbon nanotubes
COFs Covalent organic framework
MOFs Metal-organic frameworks
SEM Scanning electron microscopy
FTIR Infrared spectroscopy
ANN Artificial Neural Network
MLP Multilayer perception
[EMIM][BF4] 1-Ethyl-3-Methylimidazolium Tetrafluoroborate
[EMIM][NTf2] 1-ethyl-3-methylimidazolium bis(trifluoromethylsulfonyl)imide)
[EMIM][dca] 1-ethyl-3-methylimidazolium dicyanimide
[BMIM][PF6] 1-Butyl-3-methylimidazolium hexafluorophosphate
[BMIM][NTf2] 1-Butyl-3-methylimidazolium bis(trifluoromethanesulfonyl)imide
[BMIM][OTf] 1-Butyl-3-methylimidazolium trifluoromethansulfonate
CA Carbonic anhydrase enzyme
FV Feed volume
AC Absorption compartment
PIM-1 Polymer of intrinsic microporosity 1, a polymer of 5,5,6,6-tetrahydroxy-3,3,3,3-tetramethyl-1,1-spirobisindane and tetrafluoroterephtalonitrile
ZIF-8 zeolitic imidazolate framework
ED-MIL-101 Ethylene diamine Cr-terephthalate based metal–organic frameworks UiO-66 Zr-terephthalate based metal–organic frameworks
UiO-66-(COOH)2 Oxalic acid Zr-terephthalate based metal–organic frameworks
Abstract
The objective of this work is to compare different membrane materials and different operation modes for the separation of CO2 from CH4. In this context, the working principles in terms of gas
transport properties will be evaluated for three different systems. The discussion concerns: (1) poly(ether-b-amide) (PEBAX®1657)/polyacrylonitrile (PAN) composite hollow fibre
membranes, (2) CO2-selective facilitated transport membranes, and (3) mixed matrix membranes
based on Polymers of Intrinsic Microporosity (PIMs).
The Pebax/PAN hollow fibre membranes were prepared by a new continuous coating method based on cross flow-filtration of a PEBAX solution. This allows simultaneous internal coating of a large number of the porous hollow fibres with a thin selective dense layer of PEBAX®, directly
inside the module. The membrane preparation was optimized by modulating different parameters, such as coating time, polymer concentration and viscosity. The second approach discusses the potential use of ionic liquids as a vehicle for facilitated CO2 transport in membrane
contactors for CO2/CH4 separation. The increase of the CO2 absorption in the ionic liquid
[BMIM][OTf] by the use of the enzyme Carbonic Anhydrase (CA) was evaluated. The third approach analyzes the effect of Metal Organic Frameworks (MOFs) on the performance PIM-1 based mixed matrix membranes, provided by the School of Chemistry, University of Manchester (UK). Single gas permeation measurements were carried out to determine the gas separation performance of the membranes. In conclusion, the different types of membranes for CO2/CH4
separation will be compared, discussing the limitations and the advantages of all membranes and methods.
Riassunto
L’obiettivo di questo lavoro è comparare differenti materiali e processi a membrana per la separazione di CO2 dal metano. Le proprietà di trasporto dei gas e i principi di funzionamento
dei processi di separazione per le differenti tipologie di membrane sono stati valutati. Tre differenti tipologie di membrane sono state studiate: membrane composite a fibre cave a base di poli(etere-b-ammide) (PEBAX®1657)/poliacrilonitrile (PAN), membrane con trasporto selettivo-facilitato per la CO2, e membrane a matrice mista preparate disperdendo fillers con struttura
metallo-organica (MOFs) in un polimero a elevata microporosità intrinseca (PIMs). Le membrane composite a fibra cava di Pebax/PAN sono state preparate con un nuovo metodo di
“coating” che si basa sulla permeazione in flusso trasversale di una soluzione di PEBAX attraverso supporti porosi in PAN. L’innovativo processo di ricoprimento permette la preparazione simultanea di un gran numero di membrane composite a fibra cava, direttamente quando i supporti porosi sono stati già alloggiati all'interno del modulo. Il processo di preparazione è stato ottimizzato cambiando diversi parametri, come il tempo di rivestimento, concentrazione del polimero e la viscosità. Il secondo approccio discute il potenziale uso di contattori a membrana per il trasporto facilitato di CO2 in liquido ionico. Il trasporto della CO2
sarà facilitato dalla presenza nel liquido ionico dell’enzima anidrasi carbonica. L’anidrasi carbonica catalizza la reazione di idratazione della CO2, permettendo un trasporto facilitato della
CO2 in forma di ione bicarbonato. Nel terzo approccio è valutato l’effetto dell’aggiunta di fillers
in membrane a base di PIM-1, sulle proprietà di trasporto della coppia di gas CH4 e CO2. Misure
di permeazione per i gas puri sono state effettuate in modo da studiare le prestazioni di ogni tipologia di membrane nei processi di separazione CO2/CH4. Limiti e vantaggi per ogni tipologia
Preface
Nowadays energy systems play an important role in economic and social development and in the quality of the people’s life. The energy demand is continuously increasing and the energy supply plays an important role in the world economy. The global environmental issues could significantly affect patterns of energy use around the world. Some new governmental policies have been adopted to encourage the introduction of energy efficiency measures, via technological changes and via the use of renewable and sustainable energy. In this context, waste biomass is one of the most promising alternative sources of energy. It is possible to obtain from biomass by anaerobic digestion a mixture of gases, commonly called biogas. Biogas is an example of a gaseous biofuel containing energy in the form of methane that can be exploited as hear or as fuel for vehicles, for other engines or for energy production.
Biogas typically contains saturated water vapour, 50-65% of methane, 30-40% of CO2, traces of
hydrogen sulphide, oxygen, nitrogen, ammonia, siloxanes and volatile organic compounds. The heating value of biogas is proportional to the methane concentration and for a higher efficiency, the removal of CO2 and other impurities is required. Furthermore, these components can cause
corrosion and freezing problems in pipes and connections. Cleaning and upgrading of biogas can be carried out either by conventional separation techniques, such as pressure swing adsorption, water scrubbing and absorption with organic solvents, or by innovative techniques, such as separation and purification of biomethane by membrane processes. The membrane process presents various advantages with respect to the traditional techniques, such as low energy consumption, ease of operation and low environmental impact. One of the most important aspects in the biogas treatment with membrane processes is the separation of CH4 and CO2,
which are the gases present at the highest concentrations. Over the past decades, research groups and commercial companies active in gas separation processes by membranes have dedicated major attention to this field, aiming at a good outcome in this kind of separation. Different membranes have been designed and developed for the CO2/CH4 separation
The aim of the present thesis was to study and further develop different types of membranes for CO2/CH4 separation, and to compare the limitations and the advantages of all membranes and
Chapter 1.
Biogas as an alternative and renewable energy
source
1.1 Fossil Fuels
Today the energy supply in the world still depends for the about 90% on traditional sources and the use of renewable energy has not yet had a strong development (Figure 1.1). Carbon and petroleum are currently the main fuels used. In the world, 25% of electricity is produced in coal-fired plants. Instead, 35% of fossil fuel is represented by petroleum and the daily consumption is about 87 million barrels. The enormous fossil fuels consumption has various environmental consequences. In the last several years, carbon has been recognized a one of the most polluting energy sources, because during the extraction and combustion process, it emits a lot of CO2,
sulfur dioxide and in addition heavy metals. The impact of petroleum in this respect is slightly less, but assuming that the rate and type of energy consumption can remain constant, numerous studies claim that the petroleum will be exhausted in the next four decades and coal in about two centuries [1].
Petroleum Carbon Gas Nuclear Water Renewable fuel and waste Other 35% 23% 21.2% 6.9% 2.2% 10.9% 0.5%
Figure 1.1. Energy Supply in the world [2]
Natural gas is the third important source of fossil energy, extracted from underground reservoirs. Depending on the location of its extraction, it can be composed of methane and variable amounts of nitrogen or carbon dioxide, as well as hydrogen sulphide, higher hydrocarbons and minor other contaminants. Methane has probably the lowest impact in terms of environmental
problems, because of the relatively easy separation of the main contaminants via conventional separation techniques, to yield relatively pure methane. An unexpected side effect of methane extraction, which is currently compromising its extraction in for instance the North of The Netherlands, is the occurrence of earthquakes due to the reduction of the pressure in the gas bubble, with significant effect on the surface above.
It is generally recognized that upon the combustion of fossil fuels the emission of toxic chemical substances, greenhouse gases like CO2, and other air pollutants causes climate change and
environmental pollution of air, land and water. This has a negative impact on the health and the living quality of humans, animals, plants and other living species on earth. From here derives the need for look to the development and expansion of new energy sources that are green and renewable.
1.2 Biogas as a renewable source of energy
Biogas is a renewable energy source, generally referred to as the gas produced from organic matter by anaerobic digestion. Biogas is indicated by the U.E as an energy source that can provide a gradual reduction of the current state of pollution and it is a viable answer to the growing global energy demand [3].
1.2.1 Environmental benefits
The use of biogas as source of energy decreases the dependency on the traditional fossil fuels carbon, petroleum and natural gas, and can offer a large range of environmental benefits. The main dangerous greenhouse gases are CO2 and methane and in natural degradation of biomass,
these are produced in an uncontrolled way. In the biogas generation process, the CO2 production
is natural and the methane production is controlled. In fact, the emission of CO2 during the
process of anaerobic digestion is lower than the amount of CO2 absorbed by plants during
photosynthesis because part of the biomass is converted into methane. On the contrary, the CO2
emitted by the combustion of fossil fuels is ex-novo. Different studies [4–7], demonstrated that the biogas technology can be reduce the amount of greenhouse gas emission about 2.4 billion tons for year. Furthermore, the regulated anaerobic digestion, during the biogas production, can prevent the uncontrolled emissions of the methane released naturally during the decomposition of carcasses or organic material. In fact, methane is one of the most potent greenhouse gases and
it is therefore desirable to control its formation in an anaerobic digester rather than in open field composting, and to assure its subsequent conversion into CO2 and water by controlled
combustion with energy recovery.
Figure 1.2. Schematic representation of the sustainable cycle of anaerobic co-digestion of animal manure and organic wastes [8].
Another important aspect is that the use of organic materials as substrate for biogas production can be a promising solution to the organic garbage disposal. Moreover the organic solid materials digested during the biogas production, generally have a high content of nitrates which can be added to the soil as fertilizer. This allows the increase of the soil productivity, reducing the necessity to expand the croplands and helping the soil conservation. In addition, biogas production via anaerobic digestion can be carried out via relatively small-scale processes outside industrialized areas. Especially in such areas the use of biogas as a source of energy decreases the dependency on the traditional fuels like wood, avoiding the problem of deforestation and related problems. The preservation of the forest, promoting the natural CO2 adsorption by the
plants, decreases the concentration of this greenhouse gas into the atmosphere, thus mitigating the process of global warming.
1.2.2 Health and social benefits
spread of contagious diseases, especially in developing countries. The diffusion of the bio-digesters and of a biogas policy reduces this risk directly and can furthermore prevent the pollution of the air and as a consequence improve the quality of the life. Moreover the construction of biogas installations, starting from their first design, construction and the exploitation and use of the entire production system promotes employment and job opportunities [9].
1.3 Biogas status in the European context
Recently, the world Energy council and the United Nations (UN) commission on sustainable development have reiterated the need for cheap, clean and renewable energy to intensify sustainable development [8]. Furthermore, the UN declared 2012 as the “international year of sustainable energy” with the purpose to provide universal access to modern energy by 2030. The indicative target of the UN, to achieve the climate and energy goals are: 20% reduction of greenhouse gas emission, 20% increase of energy efficiency, and 22.1% of the energy had to come from renewable sources. In this directive, the biogas produced from biomass offers new perspectives to realize these objectives. In Europe, the diffusion of anaerobic digestion started in the purification of sludge, and to day it is estimated that 1.600 digesters are operative [10]. The amount of biogas produced, the starting matter which is obtained and the end-use, vary significantly in the different EU countries (Figure 1.3).
Germany is the leader in the biogas sector with more than half of the European energy output. The position of Germany is followed by the United Kingdom, Italy, France, Austria, and Sweden. In the United Kingdom, the biogas production from municipal waste of landfills represents the most important source of energy from biomass, with 450 operating plants. Organic waste produced annually in the European Union amounted to approximately 1.2 billion tons, of which about 90% are animal manure and the rest from urban and industrial organic waste [11]. The energy potentially recoverable annually from organic waste to anaerobic digestion in the 15 EU countries is higher and around 209 million MWh. With the pass of time, the biogas sector is changing its primary objective from waste treatment to energy production and currently the proposal is the conversion into methane. For example, Sweden has established a market for biomethane as fuel for car transport, whereas Germany and Austria predominantly use their biogas for electricity production.
0 10 20 30 40 50 60
Germany U. K. Italy France Czech republic
Spain Austria Polland Belgium Sweden Danmark 58.9 20.5 12.7 4.1 2.9 2.9 1.8 1.6 1.5 1.4 1.1 B io g as Pr o d u cti o n (T W h )
Figure 1.3. Biogas production in the EU countries [12] [13] [14]
1.4 Biogas applications
Biogas is a vehicle of renewable energy with a potential for different end-use application as heating, electricity, combined heat and power generation, transportation fuel. The main important parameters that influence the choice to convert biogas into heating, in motion or in electricity are the biogas properties and in particular its purity [12].
1.4.1 Heating
The conversion of biogas into thermal energy (heat) can be achieved in the most common way, using a boiler system, which does not need a high-quality biogas for combustion. The conversion efficiencies for heat production are typically 75-85%. The thermal energy obtained from the biogas is used for different applications, such as home or industrial heating, heating stables, heating greenhouse, stoves and refrigeration systems. The biogas with 65% of methane has a calorific value of about 22.35 KJ/m3. The use of such biogas as source of heat present some
limits: the flammability, flame temperature and it is considered important to assess the flame speed. The flammability indicates the maximum and minimum limits of fuel mixture that is required for the combustion. The limits of flammability of methane are between 5% and 15% by volume in the mixture with air. Instead, the flame temperature of methane is a function of the water vapour content. The use of biogas as thermal energy is primarily exploited for cooking and for heating. Because of the lower purity than pipeline quality natural gas, the conventional stoves
need some adjustments to the combustion system and to the other components of the stove, in order to produce a flame regularly and continuously. There are several kinds of biogas stoves in use in the world: Peking stove (China), Jackwal stove (Brazil), Patel (Kenya). The efficiency of using biogas is 55% in stoves and this is higher than the efficiency of using biogas for other applications, like engines ( (24%) or lamps (3%). These applications bring comfort and reduce the costs increasing the income of the families.
1.4.2 Electricity
Biogas can also be converted into electricity using a fuel cell, a gas turbine, a Stirling engine, or it in a system for CHP (cogeneration of heat and power). The performance and characteristics of these technologies depend in different ways on the biogas purity and the biomethane concentration. In general, electrical conversion efficiency decreases with an increase of the CO2
concentration in the biogas. For this reason, the previous purification step is important. However, the electrical efficiency is still low and only the 2.4 kWh of electric power can be produced from 1m3 of biogas. The electrical power of biogas is mainly used in the form of light, especially in areas without the electrical network. Alternatively, biogas is implemented for lighting by using special gas mantle lamps with a consume about 0.07-0.14 m3 of biogas per hour, during which it produces heat as well.
1.4.3 Power co-generation
The process based on the simultaneous production of the thermal and electrical energy is called co-generation and takes place in units indicated as “Heat and Power generation engines” (CHP). In the co-generation system an internal combustion engine is connected to an electricity generator. The spark-ignition engine generates heat during the electrical production. This heat, which is normally released in the environment, is completely recovered and converted into the thermal energy by means of heat exchangers. This leads to a threefold saving: energy savings, economic savings and environmental savings. Most of the biogas co-generation plants in Europe can be operated without biogas purification if the level of sulphur compounds is low (100ppmv). On the other hand, some gas motors require biogas purification steps. However, the co-generation system presents a lower consumption of fuel (30-40%) compared to the separate production of electricity in thermo-electric power stations and heat in a boiler.
1.4.4 Fuel for transportation
One of the most important potential applications of biogas is its use as fuel for transport, after being upgraded to biomethane. In fact, with respect to natural gas, biogas presents the advantage that it can be produced in all places where there is biomass. On the other hand, biogas has about half the calorific value of purified natural gas. For this reason the world Energy council decided that biogas can be used as an automotive fuel when it has a “Wobbe number” ranging between 43.9 and 47.3 Mj/m3, which that corresponds to a percentage of methane of 97±2%. Many
countries are investing on the production of biogas as a fuel for cars, in particular Brazil and Sweden. The most important limitation is that the stored energy for a given volume of biogas is lower than for the same volume of liquid diesel fuel. For this reason the overall performance of the vehicle tends to be lower for biogas. A solution can be the use of liquefied biogas for the heavier vehicles that require a large amount of fuel. The liquefaction process can be achieved via further compression and refrigeration, after which storage in specific tanks is needed.
1.5 Biogas production via anaerobic digestion
Biogas is obtained from biomass by anaerobic digestion. The anaerobic digestion is a complex bioprocess consisting of successive, often interactive steps carried out by groups of microorganisms with different growth rates and sensitivity to environmental conditions (pH, temperature, partial pressure of hydrogen, etc.). The process can be outlined as consisting of the following steps (Figure 1.4).
Disintegration: The complex particulate waste disintegrates to organic polymers such as carbohydrates, proteins and lipids. Disintegration lumps a number of steps such as lysis, non-enzymatic decay, phase separation and physical breakdown.
Hydrolysis: The organic polymers (carbohydrates, proteins and fats) are hydrolysed (depolymerised) by extracellular enzymes to their respective monomers (sugars, amino acids, lipids), which can be taken up by the microorganisms for further degradation. In the case of particulate complex organic matter consisting of lignocellulosic material (mainly of plant origin), pretreatment steps are necessary to enhance hydrolysis by rendering the substrate matrix more amenable to enzyme attack.
Figure 1.4. Steps of anaerobic digestion and microbial enzymes catalyzed carbon flow during anaerobic digestion [16].
Acidogenesis: A versatile group of microorganisms is able to convert the simple monomers to a mixture of volatile fatty acids, alcohols and other simpler organic compounds. This step is also often called fermentation. During acidogenesis, large amounts of carbon dioxide are produced as well as hydrogen. Especially in the case of sugars fermentation, the amount of hydrogen produced can be high and may be harvested for energy recovery. The growth rate of acidogens is
quite high with a doubling time of the order of one hour or even less. They are resistant to relatively low pH (5–6), giving them the advantage of prevailing in the anaerobic environment under adverse conditions.
Acetogenesis: The higher volatile fatty acids (propionate, butyrate, valerate, etc.) as well as the other organic molecules produced in the acidogenesis step are transformed to acetic acid, carbon dioxide and hydrogen by the acetogenic bacteria. This step is thermodynamically inhibited by hydrogen, meaning that there is an accumulation of mainly propionic and butyric acid, unless hydrogen is depleted by the hydrogen-consuming bacteria in other steps. The acetogenic bacteria are slow growing microorganisms with a doubling time of the order of days.
Methanogenesis: There are two distinct groups of microorganisms that produce methane and carbon dioxide: (1) the acetoclastic methanogens that grow on acetic acid and produce approximately 70% of methane in the biogas, and (2) the hydrogen utilizing methanogens that consume hydrogen and carbon dioxide [15].
The biogas production can be influenced by process characteristics as: pH, temperature and pressure, and by the type of wastewater and the type of biomass. Feedstocks with high biomethane potential can be classified as follows:
Ø Agricultural (livestock manure, agricultural residues, animals mortalities, energy crops) Ø Industrial (wastewater, sludges, by-products, slaughterhouse waste, biosolids)
Ø Municipal (sewage sludge, organic fraction of municipal solid waste)
The choice of the kind of biomass can be made in view of its potential productivity or its environmental impact, and depends of course on its local availability. The choice of substrate based on its nature is a strategy to obtain the maximum possible energy content into biogas. Table 1.1 reports the electrical and heating power, based on the feedstock composition. The lignocellulosic wastes mainly include dedicated crops and specific crop residues. There are dedicated crops as corn, Sorghum vulgare, Triticale, that ensure profitable production of biogas. Studies indicated that young plant materials possess a relatively soluble nature, hence it can generate comparatively higher amounts of biogas and less solid residues than woody plant materials that possess more non-water soluble components such as lignin, cellulose, hemicelluloses and polyamides [4]. However, lignocellulosic wastes have a high C/N ratio (the ratio between carbon and nitrogen atoms present into the substrate) that leads to a decrease in biogas production. For this reason the co-digestion with the organic matter is preferred, allowing higher production of biogas.
Table 1.1. Quantification of the yield of biogas as function of m3 of biomass [6] Feedstock ADTa [°C] DT b [day] Biogas production [mL/g VS] Methane production [mL/g VS] Lignocellulose waste: Rice straw 37 40 325.3 178.3 Corn straw 37±1 35 - 216.7 Wheat straw 35±0.5 31 449 296 Municipal waste 35 200 - 340
Waste sludge 37 10 Increase 50% Increase 43.5%
a) Anerobic digestion temperature b) Digestion time
The biogas production from municipal solid waste is a matter of great interest, opening up new opportunities in relation to the complex requirements for the disposal of waste and production of energy from renewable sources. The main advantage of this substrate is that its anaerobic digestion does not necessitate a higher reactor volume, while a lower amount of water and energy can be used in the process. The controlled anaerobic digestion of biomass for biogas production takes place in suitable structures designed to maximize the production of methane from the substrate, facilitating the fermentation of components under anaerobic conditions. The biogas composition and the methane concentration depend on the operation conditions and on the origin of the substrate (Table 1.2).
Table 1.2. Composition of the biogas by landfill and of the biogas by digestor compared with the composition of natural gas extracted from North Sea and from the Slochteren gas field in The Netherlands [17].
Biogas landfill Biogas digester North sea Netherlands
Calorific power (MJ/Nm3) 16 23 40 31.6
Methane (%vol) 30-65 53-70 70 -
CO2 (%vol) 15-50 30-50 1.2 1
The methane concentration of the biogas produced by landfill or in a digester is lower than that of most sources of natural gas. For this reason, biogas can fed into the home network or it can be used as a fuel only after various steps of treatment that allow adequate purification of methane from the other components such as CO2. Another important parameter for the estimation of
biogas that can be produced by different types of biomass, is the percentage of the so-called volatile solids. The volatile solid compounds are the amount of degradable matter respect to the
quantity of raw material introduced into the digester. The volatile solids are on average 70-80% of the total solids, and knowing their content allows the estimation of amount of biogas that can be extracted from each tonne of biomass (Table 1.3).
Table 1.3. Amount of biogas produced per m3 of biomass.
Matter Biogas yield (m³/ ton SV)
Livestock 200 - 500
Crop waste 350 - 400
Agro-industrial organic waste 450 - 800
Organic waste from slaughter 550 - 1.000
Sewage sludge 250 - 350
Organic fraction of urban waste 400 - 600
Crops energy 550 - 750
With increasing volatile solids content the biogas yield increases to a certain extent, but the equilibrium and productivity of the digestion process can also be greatly affected by other factors. The addition of large amounts of new material in the digester may cause a temporary inhibition of bacterial activity and thus a decrease in the yield of the process. For this reason it is important to control other process parameters such as temperature, pH and retention time. Moreover, many actions can increase gas production during biogas digestion, including introduction of accelerants, biological or chemical additives. The biogas produced through anaerobic digestion is collected, dried, compressed and stored to be directed to the processes of purification.
1.6 Purification process: transforming Biogas into biomethane
The biogas from anaerobic digestion and landfills consists primarily of methane, CO2 and water
vapour. Trace components that are present in raw biogas are hydrogen sulfide, siloxanes, hydrocarbons, ammonia, oxygen, carbon monoxide and nitrogen (Table 1.4). A purification treatment is needed in order to reach a comparable heat power between biogas and methane extracted from natural resources. In order to convert biogas into bio-methane two steps are
necessary: a cleaning process to remove the harmful components and an upgrading process to increase the heating value by removal of inert and mostly harmless species [18].
Table 1.4. The raw biogas composition [8]
Main compounds Amount (%) Trace compound Amount (%)
CH4 40-75 H2S 0.005-2 CO2 15-60 Siloxanes 0-0.02 H2O 5-10 VOC a) <0.6 NH3 <1 O2 0-1 CO <0.6 N2 0-2
a) Volatile Organic Compounds, mostly Halogenated hydrocarbons
1.6.1 Cleaning
The purification from components, present in low concentration, is called cleaning. In this step the trace components that are harmful for the bio-methane pipeline and appliances are removed. The dehydration of the biogas is carried out by condensation, compression, adsorption (on silicon oxide or activated carbon) or absorption (salts or solutions based on glycols). The pipeline quality standards require a maximum water content of 100 mg/m3 and the water removal
is important to avoid the reaction with H2S, NH3, and CO2, and as a consequence the formation
of corrosive acids or basic compounds. It is also needed to prevent possible condensation of water in pipelines under cold conditions.
Hydrogen sulfide removal can be do with chemical-physical precipitation in the liquid phase of
the digester (adding ferrous/ferric chloride to fix the sulfur) or acting on the biogas with adsorption, absorption and biological treatment to achieve its oxidation.
Oxygen can be separated from the biogas with classical separation processes (e.g. adsorption on
activated carbon or molecular sieves, or in some cases by selective membranes). The oxygen and nitrogen removal is expensive. Preventing the introduction of air in the biogas is far cheaper than gas treatment. Removal of nitrogen is more difficult than that of oxygen because of its inert nature and more similar properties to those of methane.
The ammonia is contained in higher amounts in biogas produced from food waste. Typically, the systems are designed to minimize the production of ammonia. However, to respect the quality
standards of biomethane, almost always a further reduction of ammonia is required. Removal systems dedicated to other pollutants, such as CO2 removing units, often have good separation
ability for NH3 as well.
The Halogenated hydrocarbons are potentially highly corrosive agents and they are strongly polluting. Generally they are captured by activated carbon products, specifically designed for this scope.
The siloxanes form a group of component that contain Si-O bonds in the backbone. Linear and cyclic siloxanes are present in significant concentrations (1-400 mg/m3). When using raw biogas,
this in raw biogas these can cause severe damage to engines of the biogas network system. Because silicones tend to form inorganic glassy material upon combustion of biogas, their removal is necessary. The siloxanes can for instance be removed by adsorption (e.g. Active carbon), absorption (e.g. in mixtures of organic solvents of low volatility), cryogenic condensation, chemical killing (hydrolysis of the silicon-oxygen bond) or bacterial degradation.
1.6.2 Upgrading: Removal of CO2
The calorific value of biogas is proportional to the methane concentration. The upgrading is the process in which the CO2 is removed to adjust the relative density and to increase the
concentration of methane to about 97-99% (typical concentration in purified natural gas) [19]. The process of biogas upgrading generates new possibilities for biogas use since it can then replace natural gas in applications where this is currently used. The main techniques for the removal of CO2 are:
· Pressure swing adsorption (PSA) · Water scrubbing (SW)
· Physical and chemical CO2-absorption
· Membrane processes
The process of pressure swing adsorption exploits the potential of some materials to adsorb carbon dioxide in a selective way at high pressures, in particular on activated carbon and on zeolites. In fact, at high pressures the CO2 is adsorbed by the material that is then regenerated by
reducing the pressure. The disadvantages of this technique are related to the materials used, which can lose efficiency as a consequence of irreversible adsorption of H2S, water and other
The scrubbing processes are based on the greater solubility of carbon dioxide than methane, or on the reactivity of CO2 with a specific component in the scrubbing solution. In this process the
biogas flows upstream in a flow column. The scrubbing solution is enriched in carbon dioxide, whereas biogas, is enriched in methane, exits the column at the top. This process also requires a relatively energy-intensive regeneration of the scrubbing solution.
The water scrubbing under pressure is the most common technique and exploits the lower solubility of methane in water compared to carbon dioxide. In the case of the physical scrubbing
with organic solvents, modified ethylene glycol (Selexol®) is often used. The advantage is that
carbon dioxide is more soluble in this solvent than in water.
In the case of chemical scrubbing, amine solutions are used as absorbents. In particular, monoetanolammina (MEA) or dimethylethanolamine (DMEA) are highly reactive with CO2, but
also with the H2S, while they have a low compatibility with the CH4. In spite of the high
efficiency of this process, a major problem is that significant amounts of the amines evapourate during this process and get lost in the environment. Secondly, the regeneration of the solvents is relatively energy intensive.
Membrane processes
Membrane separation processes are based on the selective permeability property of a membrane. The separation can take place in one step or in multiple stages. With the current state-of-the art membranes the raw gas can be purified to maximum 92% of methane in a single step. Two or more steps allow to purify raw biogas to a level of 96% or more methane. Two basic systems of membrane separation exist for possible biogas upgrading. Firstly gas-gas separation with a gas phase at both sides of the membrane and secondly, gas-liquid absorption separation with the gas phase at one side of the membrane and the liquid absorbing the diffused molecules at the other side of the membrane. To extend the life of the membranes and obtain optimum separation, the raw gas must be carefully dried and desulphurized before putting it in contact with the membrane. The membrane processes present various advantages with respect to the conventional techniques, such as: operation simplicity, easy maintenance, safety and low operation cost. Table 1.5 shows a comparison between the different techniques upgrading, highlighting the advantages and disadvantages for the respective techniques.
Table 1.5 Comparison of the requirements and performance of different upgrading techniques Technique Characteristics Pressure swing adsorption Water scrubbing Chemical scrubbing Physical scrubbing Membrane processes
Preventive purification Yes No Yes No No
Operating pressure 4-7 4-7 0 4-7 Variable
Methane concentration (%) 98 97 92-98 96 89.5
Efficiency (%) 93 91 90 - 80-96
Energy consumption (KWh/Nm3) 0.25 0.3-0.6 0.15 0.24-0.33 0.14
Chapter 2.
Membranes for CO
2removal
2.1 Introduction
Carbon dioxide separation from natural gas streams is an important industrial process where membrane systems are expected to play a more significant role in the coming years. In this work the attention will be concentrated on the current state-of-the-art membranes for CO2/CH4
separation. After a general introduction, different membrane types will be described: dense polymeric membranes, facilitated transport membranes and mixed matrix membranes. The purpose is to highlight the structural properties, membrane morphologies, gas transport mechanism and performance of the different kinds of membrane for CO2/CH4 separation.
2.2 Membrane definition and classification on the basis or morphology
A membrane can be defined as an interface between two phases that regulates in a selective way the flux of chemical species (gas, liquids, positive or negative ions). The membrane controls the exchange of mass between the two phases, favoring the passage of a substance relative to another, according to mechanisms that control selectively the transport (Figure 2.1) [20].
Feed
Permeate
The selective action of the membrane, allows to obtain a phase called “permeate”, enriched of the more permeable species. Instead, the phase called retentate is enriched in the less permeable species.
2.2.1 Membrane morphology
Membranes can be classified from the morphological standpoint as:
- Porous membranes: They have pores with a more or less ordered distribution, depending on the preparation techniques. The separation is based on different mechanisms that depend on the size and the structure of the pores, and on the nature of the species to be separated [21]. Porous polymer membranes are generally not sufficiently selective for gas separation and in this field they are normally used as a porous support for thin film composite membranes or for supported liquid membranes. Therefore they will not be described in detail in the present thesis. membranes
- Dense membranes: they are dense and homogeneous films, in which the transport of the species generally occurs thanks to a concentration gradient of the permeant across the membrane as the driving force, and a diffusive transport mechanism. Besides a pressure or a concentration gradient, the trans-membrane driving force can also be a temperature gradient or an electric potential. The transport properties are mainly dictated by the intrinsic characteristics of the material. This kind of membranes is typically used for pervapouration or for gas separation processes.
2.2.2 Transport properties in relation to the membrane morphology
Regarding the gas separation process, the gases permeate through the membranes with different mechanisms that depend on the size of the pores and of the free spaces of a membrane. They are divided into (Figure 2.2):
v Convective flow, pore d = 0.1-10 mm v The Knudsen diffusion, pore d <0.1 mm v Molecular sieving, d = 0.5-2 nm pore. v Solution- diffusion, dense membranes.
Figure 2.2. Gas permeation mechanisms through membranes
In the case of very large pores convective flow occurs and the pressure difference leads the gas mixture through the pores without any selectivity. For this reason, membranes with a large size of the pores are not usable for the separation of gas mixtures.
Knudsen flux occurs when the size of the pores is smaller than the mean free path of the
molecules, λ, (cm): 2 2 p RT r d P l p = > × × Eq. 2.1
Where T is the temperature, P the pressure, R is the constant of the gas, d is the diameter of the molecule and rp is the pore radius. In this case, the number of collisions of the gas molecules
with each other is negligible compared to the number of collisions between the gas and the pore wall. The selectivity depends exclusively on the ratio between the square roots of the molar masses of the diffusing permeants. This means that the gas with smaller molecular weight diffuses faster than the gas with the higher molecular weight.
The flow by surface diffusion is the permeation mechanism in which a component of the gas
mixture presents high affinity with the material of the membrane. The chemical species interacting strongly with the surface is thus adsorbed on the material and the diffusion through the pores takes place predominantly through the transport of the species along the surface of the membrane pores.
The solution-diffusion mechanism is the most common mechanism occurring in dense polymeric membranes. The molecules are absorbed onto the surface of the membrane, subsequently diffuse through the bulk of the polymer to the downstream side of the membrane,
and finally they are desorbed from the permeate side of the membrane. The solution-diffusion model will be discussed in more detail in Section (2.4.1).
2.3 Dense polymeric membranes: structure and preparation
2.3.1 Membrane structure
Dense membranes can be further classified according to their structure in three main categories, displayed in Figure 2.3: v Symmetric v Asymmetric v Composite a) b) c) Selective layer Porous support Protective layer Selective layer Interlayer Porous support
Figure 2.3. a) Dense membrane; b) asymmetric integrally skinned membrane; c) thin film composite membrane.
2.3.1.1 Symmetric dense membranes
The symmetric dense membranes are homogeneous, they do not present pores but they have voids between the molecular chains with a size the order of 5-10 Å, which constitute the so-called "free volume" (Figure 2.3a).
The symmetric dense membranes can be prepared by different techniques:
- Solution casting: this is a technique that allows to obtain a dense flat membrane by means of the spreading of a polymeric solution with a defined concentration on an appropriate surface, followed by evapouration of the solvent. The polymeric solution is spread by knife having a precise gap, which defines the thickness of the membrane. Alternatively, the polymer solution can be cast in a petri dish or similar. A thin dense uniform polymer film is finally obtained by the controlled solvent evapouration.
- Melt pressing: the polymer is compressed between two heated plates. Typically, a pressure of 2000–5000 psi is applied for 1–5 min, at a plate temperature just below the melting point of the polymer.
- Melt extrusion: the molten polymer is extruded through a thin slit or through an annular opening into the form of a sheet or a hollow tube, respectively. The sheet can be mono- or bidirectionally stretched to increase the area and to reduce the thicknesss. The tube can be blown to reduce the final film thickness to several tens of microns.
- Polymerization : in this case the membrane is obtained by means of the direct polymerization, for instance of a two-component silicone resin.
The resistance to mass transport is proportional to the thickness of the membrane. The techniques of preparation try to find a compromise between productivity and selectivity. A reduction in the thickness involves an increase in productivity due to the decrease of the resistance to transport. However, a thinner membrane is more likely to have defects and thus a lower selectivity. For this reason, the choice often falls on membranes with an "integral skin" or on composite "multilayer" membranes.
2.3.1.2 Asymmetric dense membranes
Asymmetric membranes have a very thin dense skin, responsible of the membrane selectivity and a thicker macroporous support, responsible for the mechanical reisstance (Figure 2.3b). The low thickness of the skin allows to obtain a better efficiency, while the porous support facilitates the handling and improves the mechanical strength. Dense asymmetric membranes can be obtained by:
- Dry-wet phase separation (or nonsolvent induced phase separation, NIPS) the precipitation of the polymer solution takes place upon contact of the stable polymer solution with a non-solvent.
- Thermally induced phase separation (TIPS) the phase inversion takes place by cooling the stable hot polymer solution, sometimes accompanied by partial evapouration of the solvent. - Dry phase inversion method (Dry NIPS), the stable polymer contains besides the volatile
solvent also a small amount of nonvolatile nonsolvent and evapouration of the solvent leads to the phase separation by the action of the increasing nonsolvent concentration [22].
- Solvent evapouration method the complete evapouration of the solvent leads to the formation of a completely dense, homogeneous film.
In all cases, except for the latter where a single dense phase is formed, phase inversion leads to the formation of two phases: a solid phase, rich in polymer, which will form the matrix of the membrane, and a liquid phase with a low polymer concentration, constituting the pores
2.3.1.3 Thin film composite membranes
Thin film composite membranes are dense and structurally similar to the dense asymmetric
membranes, but they are built by an assembly of different materials (multi-layer): the porous support, the intermediate layer, the selective film and, in some cases, protective layer (Figure 2.3c).
- The porous support: has the function of ensuring mechanical strength without inducing significant resistance to the transport through the membrane.
- The intermediate layer: vents the gas from the selective layer towards the pores of the porous support, ensuring the adhesion between the two surfaces even when made of materials which are not similar; at the same time it prevents the infiltration of the polymer of the selective film into the porous support, in fact, this phenomenon could cause clogging of the pores and thus have a negative effect on the performance of the selective membrane. This layer may not be necessary in the case of highly permeable polymers, which can be deposited directly onto the porous support.
-Protective layer: the selective layer generally must be as thin as possible to guarantee a high flux and is therefore very delicate. It must be protected with a highly permeable protective coating. This layer does not affect the transport significantly but it protects the membrane during handling.
-The selective layer: this is the intermediate layer, responsible of the separation of different molecular species, and represents the actual membrane and defines its efficiency.
2.3.2 Dense polymer membrane materials
On the basis of their base constituents, dense polymeric membranes can generally be classified in three different categories:
· Glassy polymeric membranes · Rubbery polymeric membranes
![Figure 1.2. Schematic representation of the sustainable cycle of anaerobic co- co-digestion of animal manure and organic wastes [8]](https://thumb-eu.123doks.com/thumbv2/123dokorg/2875886.9841/20.892.217.699.196.566/figure-schematic-representation-sustainable-anaerobic-digestion-animal-organic.webp)
![Figure 1.4. Steps of anaerobic digestion and microbial enzymes catalyzed carbon flow during anaerobic digestion [16]](https://thumb-eu.123doks.com/thumbv2/123dokorg/2875886.9841/25.892.166.751.103.899/figure-anaerobic-digestion-microbial-enzymes-catalyzed-anaerobic-digestion.webp)

![Figure 2.7. Solubility coefficient as a function of the molecular dimension, expressed as the Van der Waals volume [21]](https://thumb-eu.123doks.com/thumbv2/123dokorg/2875886.9841/45.892.308.591.292.738/figure-solubility-coefficient-function-molecular-dimension-expressed-waals.webp)