Tissue Is Associated with Metabolic Syndrome
Elaine Vieira1,2*.
, Elena G. Ruano1,2., Ana Lucia C. Figueroa2, Gloria Aranda1,3, Dulce Momblan5, Francesc Carmona4,6, Ramon Gomis1,2,3,6, Josep Vidal1,2,3,6", Felicia A. Hanzu1,2,3"
1 CIBER de Diabetes y Enfermedades Metabo´licas Asociadas (CIBERDEM), Barcelona, Spain, 2 Diabetes and Obesity Research Laboratory, IDIBAPS, Barcelona, Spain, 3 Department of Endocrinology and Nutrition, Hospital Clinic, Barcelona, Spain, 4 Institute Clinic of Gynecology, Obstetrics and Neonatology, Hospital Clinic, Universitat de Barcelona, Barcelona, Spain,5 Department of Gastrointestinal Surgery, Hospital Clinic, Universitat de Barcelona, Barcelona, Spain, 6 Faculty of Medicine, University of Barcelona, Barcelona, Spain
Abstract
Clock gene expression was associated with different components of metabolic syndrome (MS) in human adipose tissue. However, no study has been done to compare the expression of clock genes in visceral adipose tissue (VAT) from lean and obese subjects and its clinical implications. Therefore, we studied in lean and obese women the endogenous 24 h expression of clock genes in isolated adipocytes and its association with MS components. VAT was obtained from lean (BMI
21–25 kg/m2; n = 21) and morbidly obese women (BMI .40 kg/m2; n = 28). The 24 h pattern of clock genes was analyzed
every 6 hours using RT-PCR. Correlation of clinical data was studied by Spearman analysis. The 24 h pattern of clock genes showed that obesity alters the expression of CLOCK, BMAL1, PER1, CRY2 and REV-ERB ALPHA in adipocytes with changes found in CRY2 and REV-ERB ALPHA throughout the 24 h period. The same results were confirmed in VAT and stromal cells (SC) showing an upregulation of CRY2 and ERB ALPHA from obese women. A positive correlation was observed for REV-ERB ALPHA gene expression with BMI and waist circumference in the obese population. Expression of ROR ALPHA was correlated with HDL levels and CLOCK with LDL. Obese subjects with MS exhibited positive correlation in the PER2 gene with LDL cholesterol, whereas REV-ERB ALPHA was correlated with waist circumference. We identified CRY2 and REV-ERB ALPHA as the clock genes upregulated in obesity during the 24 h period and that REV-ERB ALPHA is an important gene associated with MS.
Citation: Vieira E, Ruano EG, Figueroa ALC, Aranda G, Momblan D, et al. (2014) Altered Clock Gene Expression in Obese Visceral Adipose Tissue Is Associated with Metabolic Syndrome. PLoS ONE 9(11): e111678. doi:10.1371/journal.pone.0111678
Editor: Henrik Oster, University of Lu¨beck, Germany
Received July 4, 2014; Accepted September 29, 2014; Published November 3, 2014
Copyright: ß 2014 Vieira et al. This is an open-access article distributed under the terms of the Creative Commons Attribution License, which permits unrestricted use, distribution, and reproduction in any medium, provided the original author and source are credited.
Data Availability: The authors confirm that all data underlying the findings are fully available without restriction. All relevant data are within the paper and its Supporting Information files.
Funding: This work was sponsored by the Spanish Ministry of Economy and Competitiveness under grant agreement number PI13/01500 and by the Government of Catalonia under grant agreement number 2014SGR659. The work was conducted at the Centre Esther Koplowitz, Barcelona; CIBERDEM is an initiative of the Instituto de Salud Carlos III. The funders had no role in study design, data collection and analysis, decision to publish, or preparation of the manuscript.
Competing Interests: The authors have declared that no competing interests exist. * Email: [email protected]
.These authors contributed equally to this work. " These authors also contributed equally to this work.
Introduction
Circadian clocks regulate 24 hours rhythms in physiology and behavior that are essential to maintaining normal metabolic function. In humans, disruption of circadian rhythms (e.g., shift work) is associated with increased adiposity and increased risk of obesity and type 2 diabetes [1,2]. Moreover, recent studies have linked polymorphisms of human circadian clock genes with metabolic dysfunction [3,4]. Adipose tissue is a metabolic active organ that exhibits a rhythmic behavior [5]. In a single time point study, clock gene expression was associated with different components of metabolic syndrome in human adipose tissue [6]. Thus, it is of extreme importance to identify which clock genes are disrupted in obesity for an optimization of clinical interventions aimed at reducing the incidence of metabolic diseases such as type 2 diabetes.
The rhythmic expression of circadian clocks exists not only in the master clock in the brain but also in other tissues [7]. Clock genes were shown to oscillate independently of the suprachias-matic nucleus exhibiting different circadian oscillations between subcutaneous and visceral adipose explants in morbidly obese women [8]. Intriguingly, in subcutaneous adipose tissue taken from lean, obese and type 2 diabetes subjects, the circadian expression of clock genes was comparable among the groups [9]. To date, there are no studies comparing the 24 h expression of clock genes in human visceral adipose tissue (VAT) from lean and obese subjects as well as the expression of clock genes in different cell fractions of human VAT.
In this study, we examined the 24 h expression profile of clock genes in adipocytes from lean and morbidly obese women. We
identified CRY2 and REV-ERB ALPHA as the clock genes
these genes was also confirmed in VAT and in the stromal cells from lean and obese women. In this context, we found a positive
correlation ofREV-ERB ALPHA expression levels with metabolic
syndrome parameters.
Materials and Methods Subjects
Twenty-one lean, drug-free, non-obese healthy women (BMI
23.1861.8 kg/m2, age 42.9566.6) undergoing elective procedures
of gynecological surgery to correct benign conditions (miomas or vaginal prolapsed) and twenty-eight morbidly obese woman (BMI
45.3764.3 kg/m2, age 46.07611.3) undergoing bariatric surgery
at the Obesity Unit of the Hospital Clinic of Barcelona were included in the study. The study was approved by the Ethics Committee of the Hospital Clinic of Barcelona, Spain. Written informed consent was obtained from all participants. Clinical history and physical data were registered.
In both groups, participants with a diagnosis of diabetes [10] and on glucose-lowering or insulin-sensitizer medication or insulin or on diets were excluded. The exclusion of diabetic patients have been mainly due to the use of metformin since AMP activated protein kinase (AMPK) activators were shown to regulate the pattern of clock genes [11,12,13,14]. Subjects receiving hormones (i.e. glucocorticoids, oral contraceptives, or other substitutive hormonal treatment) or medications known to affect metabolism, or with a recent history of malignant disease or a major chronic disease, smokers and subjects with sleep disorders or shift work were also excluded from both groups. Main biochemical parameters (Table 1) were measured in serum, after overnight fasting in the laboratory of our hospital using standard assays. Metabolic syndrome components were defined using International Diabetes Federation (IDF) criteria (www. idf.org).
Adipose tissue collection and isolation of adipocytes and stromal cells
Visceral (omental) adipose tissue biopsies from the morbidly
obese (BMI 45.3764.3 kg/m2, n = 28) and non-obese individuals
(BMI 23.1861.8 kg/m2, n = 21) were obtained during
laparo-scopic surgery at 8:00 am at the Hospital Clinic, Barcelona, Spain. The tissue was then immediately transported to the laboratory for the experimental studies. Adipose tissue was thereafter carefully dissected from skin and vessels under sterile conditions. The VAT was then divided in two parts: one small piece of whole VAT was rapidly frozen at 280uC for the measurements of gene expression. The other piece was used for isolation of adipocytes and stromal cells. Briefly, VAT was cut in small pieces and incubated at 37uC for 30 to 60 min in a collagenase solution (4 ml/1 g of tissue, Sigma, St Louis) to isolate adipocytes and stromal cells. After digestion, the adipose tissue was washed with PBS and centrifuged for 5 min at 25uC at 400 g in order to separate the different fractions of cells. The adipocytes and stromal cells were separated into different tubes and the stromal cells were treated with an erythrocyte lysis buffer for 5 min. They were then washed 2 times with PBS and centrifuged 2 times for 5 min each at 25uC at 400 g, and rapidly frozen at 280uC. The adipocytes were then washed 2 times with PBS and centrifuged 2 times for 5 min each at 25uC at 400 g for collagenase clearance. After washing, the adipocytes were divided into 5 different petri dishes named T0, T6, T12, T18 and T24 and cultured in M199 culture medium (Sigma, St Louis) for 8 h in order to allow the adipocytes to adapt to the new environmental conditions in incubator with a humidified
atmo-sphere containing 5% CO2. After adaptation, adipocytes were
synchronized with a serum-shock for 2 hours, a standard method to study clock genes in vitro in several cell types [15]. After synchronization, adipocytes were collected every 6 hours during a 24 h period for gene expression analysis. Due to small amount of stromal cells, we could not perform the 24 h expression pattern of clock genes in this cell type. In addition, the 24 h expression pattern of clock genes in whole VAT was not performed due to the presence of stromal cells in this tissue that might contribute to the 24 h expression pattern of clock genes and thus interfering in the results.
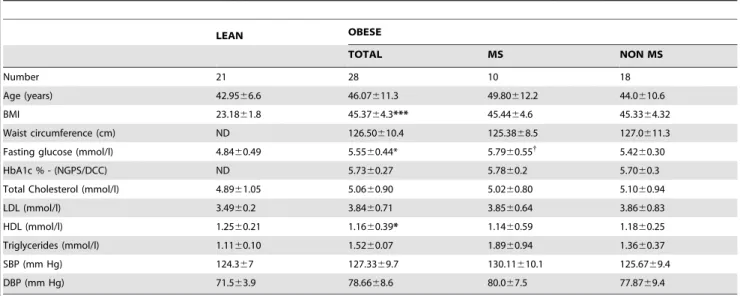
Table 1. Clinical characteristics of the population.
LEAN OBESE TOTAL MS NON MS Number 21 28 10 18 Age (years) 42.9566.6 46.07611.3 49.80612.2 44.0610.6 BMI 23.1861.8 45.3764.3*** 45.4464.6 45.3364.32 Waist circumference (cm) ND 126.50610.4 125.3868.5 127.0611.3
Fasting glucose (mmol/l) 4.8460.49 5.5560.44* 5.7960.55{
5.4260.30
HbA1c % - (NGPS/DCC) ND 5.7360.27 5.7860.2 5.7060.3
Total Cholesterol (mmol/l) 4.8961.05 5.0660.90 5.0260.80 5.1060.94
LDL (mmol/l) 3.4960.2 3.8460.71 3.8560.64 3.8660.83
HDL (mmol/l) 1.2560.21 1.1660.39* 1.1460.59 1.1860.25
Triglycerides (mmol/l) 1.1160.10 1.5260.07 1.8960.94 1.3660.37
SBP (mm Hg) 124.367 127.3369.7 130.11610.1 125.6769.4
DBP (mm Hg) 71.563.9 78.6668.6 80.067.5 77.8769.4
Data are mean 6SEM. *p,0.05;
***p,0.001 lean vs. obese group.
{
p,0.05 MS vs. NON MS group. MS = Metabolic Syndrome. SBP = systolic blood pressure and DBP = diastolic blood pressure. doi:10.1371/journal.pone.0111678.t001
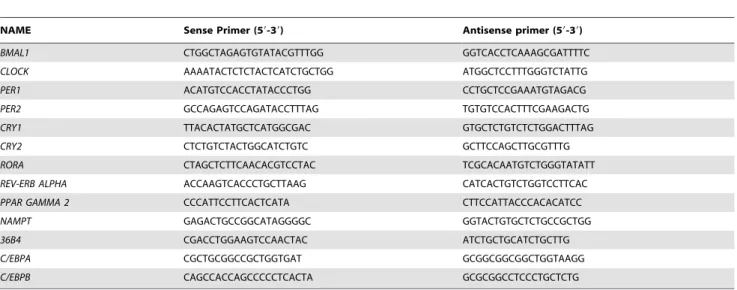
RNA extraction and gene expression
Total RNA was isolated from whole VAT and isolated adipocytes using a RNeasy Lipid Tissue Mini Kit (QIAGEN, Hilden, Germany). Total RNA from stromal cells was isolated using a RNeasy Mini kit Plus (QIAGEN, Hilden, Germany). RNA was quantified using a Nanodrop 1000 (Thermo Scientific, Wilmington, MA) and it was reverse transcribed using a High Capacity cDNA Reverse Transcription Kit (AB Applied Biosys-tems, USA) following the manufacturer’s instructions. Real time PCR was carried out in a Light Cycler 480 System (Roche, Basel, Switzerland) using MESA GREEN qPCR MasterMix Plus for SYBR Assay (Eurogentec, Lie`ge, Belgium). The housekeeping
genes RPLP0 (ribosomal protein large P0, alias 36B4) and
ACTIN was used as the arrhythmic endogenous control for quantification [16,17,18]. Values were expressed as the relative
expression respective to control levels (22DDct). The primer
sequences are shown in Table 2.
Statistical and Cosinor Analysis
Data is shown as mean 6SEM. Comparison among clock genes
between lean and obese were analyzed using Student’st test. Gene
expression time course using two-way ANOVA (factors time and group) was quantified with a level of significance of p,0.05. Association between phenotype data and clock gene expression was studied by Spearman correlation analysis. The Cosinor analysis (Table 3) was done by using the Acro software and include the mesor (middle value of the fitted cosine representing a rhythm adjusted mean), the amplitude (difference between the minimum and maximum of the fitted cosine function), and the acrophase (the time at which the peak of a rhythm occurs, expressed in hours).
Results
Clinical characteristics of the population
The clinical characteristics of the population studied are presented in Table 1. The lean and the obese groups did not statistically differ with respect to age. The obese population had a
BMI greater than 40 kg/m2 indicating morbid obesity. Mean
fasting glucose was significantly higher in the obese group as compared with lean subjects, whereas HDL– cholesterol was lower
in the obese group. Total and LDL - cholesterol and triglycerides were higher (p = 0.06), although not at statistically significant levels, in obese subjects, while systolic and diastolic blood pressure did not statistically differ between lean and obese groups. Among the morbidly obese subjects, 35.7% (10 out of 28) fulfilled the metabolic syndrome criteria defined by the IDF panel. Fasting glucose was higher in obese subjects with MS as compared to non MS obese subjects. Regarding comorbidities, 50% (14 of 28) presented hypertension and were on treatment with antihyper-tensives drugs (hydrochlorothiazide and calcium blockers); 32% (9 of 28) presented untreated dyslipidemia; and 28.7% (8 out of 28) of the obese patients presented impaired fasting glucose levels.
The 24 h expression of clock genes and metabolic genes in isolated adipocytes from lean and obese subjects
The 24 hour measurements showed thatCLOCK and BMAL1
were upregulated in adipocytes from obese subjects at different
time (T) points:CLOCK at T6 (Fig. 1A) and BMAL1 at T6 and
T12 (Fig. 1B) whereasPER1 was downregulated at T18 (Fig. 1C).
No changes were found in PER2 (Fig. 1D), CRY1 (Fig. 1E) or
ROR ALPHA (Fig. 1G) gene expression between lean and obese
subjects. Interestingly, CRY2 (Fig. 1F) and REV-ERB ALPHA
(Fig. 1H) expression exhibited increased gene expression over the course of 24 hours in the obese group. These results demonstrated
thatCRY2 and REV-ERB ALPHA are the clock genes that are
altered over the course of 24 hours in adipocytes from obese women. Table 3 shows the cosinor analysis of the 24 h expression
pattern of clock genes. Among the clock genes studied only
REV-ERB ALPHA and CRY2 showed statistical significance in the
mesor and amplitude. The mean amplitude and mesor of
REV-ERB ALPHA expression was increased in obese subjects as compared to lean subjects (p = 0.003; p = 0.001, respectively). The
same results were found forCRY2 with a mesor (p = 0.0001) and
amplitude (p = 0.001) increased in the obese subjects as compared to lean subjects.
A large body of evidence from human and animal studies has demonstrated that the regulation of molecular clocks is linked to pathways of energy metabolism. Therefore, we next examined the mRNA expression of metabolic genes known to regulate adipocyte cell metabolism and clock genes. We measured the 24 h mRNA levels of peroxisome proliferator-activated receptor gamma 2
Table 2. Quantitative real-time PCR primers.
NAME Sense Primer (59-39) Antisense primer (59-39)
BMAL1 CTGGCTAGAGTGTATACGTTTGG GGTCACCTCAAAGCGATTTTC
CLOCK AAAATACTCTCTACTCATCTGCTGG ATGGCTCCTTTGGGTCTATTG
PER1 ACATGTCCACCTATACCCTGG CCTGCTCCGAAATGTAGACG
PER2 GCCAGAGTCCAGATACCTTTAG TGTGTCCACTTTCGAAGACTG
CRY1 TTACACTATGCTCATGGCGAC GTGCTCTGTCTCTGGACTTTAG
CRY2 CTCTGTCTACTGGCATCTGTC GCTTCCAGCTTGCGTTTG
RORA CTAGCTCTTCAACACGTCCTAC TCGCACAATGTCTGGGTATATT
REV-ERB ALPHA ACCAAGTCACCCTGCTTAAG CATCACTGTCTGGTCCTTCAC
PPAR GAMMA 2 CCCATTCCTTCACTCATA CTTCCATTACCCACACATCC
NAMPT GAGACTGCCGGCATAGGGGC GGTACTGTGCTCTGCCGCTGG
36B4 CGACCTGGAAGTCCAACTAC ATCTGCTGCATCTGCTTG
C/EBPA CGCTGCGGCCGCTGGTGAT GCGGCGGCGGCTGGTAAGG
C/EBPB CAGCCACCAGCCCCCTCACTA GCGCGGCCTCCCTGCTCTG
(PPARG2) and nicotinamide phosphoribosyltransferase (NAM
PT; the rate-limiting enzyme in NAD+biosynthesis), which were
found to regulate clock genes [19]. The 24 h pattern ofPPARG2
expression showed increased expression levels at T0 and T24 in adipocytes from obese subjects as compared to lean subjects
(Fig. 2A). The 24 h mRNA expression of NAMPT showed a
strong statistically significant tendency (p = 0.09) to be reduced at T0 and T18 in adipocytes from obese subjects (Fig. 2B). In addition, we measured the expression of CCAAT/enhancer binding protein alpha (C/EBPA) and (C/EBPB), keys transcription
factors involved in adipogenesis. The 24 h mRNA expression ofC/
EBPA was not different from lean and obese subjects (Fig. 2C).
However,C/EBPB was upregulated at T0, T12, T18 and T24 in
obese subjects as compared to lean subjects (Fig.2D). In whole
VAT the expression of PPARG2 was increased whereas the
expression of NAMPT was decreased in obese subjects as
compared to lean subjects (Figure S1 A and S1B, respectively). There was no changes in the mRNA expression of peroxisome proliferator-activated receptor alpha (PPARALPHA), gamma1 (PPARG1) and Sirtuin1 (SIRT1) between obese and lean subjects (Figure S1 C, D and E, respectively).
Thus, obesity alters the 24 h expression pattern of clock genes and metabolic genes in human adipocytes. Furthermore, human adipocytes cultured in vitro retain some changes in the patterns of clock genes and metabolic genes during 24 h regardless of the contribution of the central clock located in the hypothalamus.
Expression of clock genes in VAT and SC from lean and obese subjects
To confirm whetherCRY2 and REV-ERB ALPHA are altered
in human obesity, we next measured the mRNA expression of clock genes in VAT and stromal cells from lean and obese subjects.
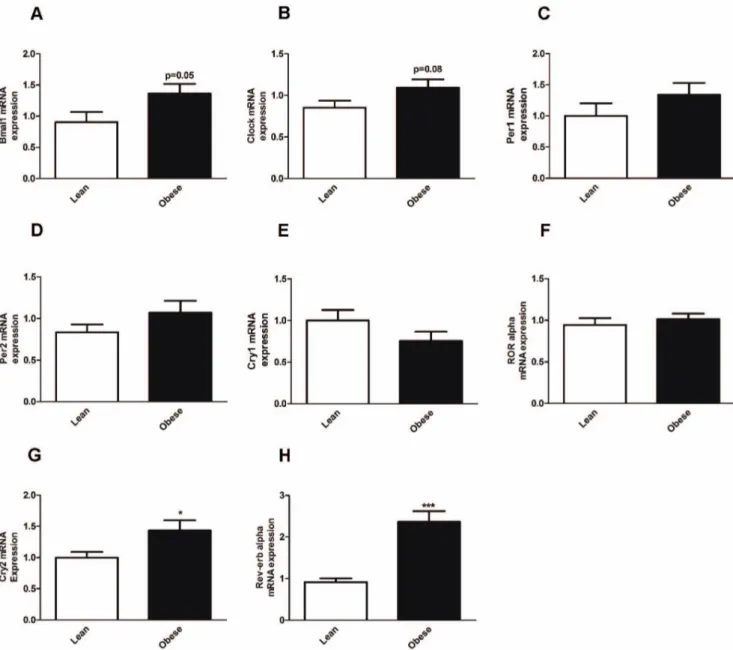
The expression pattern of the core clock gene BMAL1 had a
tendency for upregulation in VAT from obese subjects (p = 0.05) (Fig. 3A). There were no statistical differences in gene expression
in CLOCK (Fig. 3B), PER1 (Fig. 3C), PER2 (Fig. 3D), CRY1
(Fig. 3E) andROR ALPHA (Fig. 3F). Strikingly, CRY2 and
REV-ERB ALPHA were upregulated in VAT from obese as compared to VAT from lean subjects (Fig. 3G and 3H), respectively.
Interestingly, among the clock genes studied,REV-ERB ALPHA
exhibited the highest expression levels in obese subjects as compared to lean subjects. These results indicate that obesity can disrupt the expression of clock genes in human VAT, and that this disruption can be clock gene-specific, such as in the case of CRY2 and REV-ERB ALPHA.
In SC we found no statistical difference in the expression levels
of CLOCK (Fig. 4A), BMAL1 (Fig. 4B), or PER1 (Fig. 4C),
between lean and obese subjects. There was an increase of gene
expression ofPER2 (Fig. 4D), CRY1 (Fig. 4E) and ROR ALPHA
(Fig. 4F) in the obese as compared to lean subjects. Interestingly, CRY2 (Fig. 4G) and REV-ERB ALPHA (Fig. 4H) were also found to be upregulated in stromal cells from obese as compared to lean
subjects. PPARG2 expression levels were increased in SC from
obese subjects (Fig. 4I) whereasNAMPT gene expression levels
were similar (Fig. 4J) in both groups. These results indicate that
the changes in PER2, CRY1 and ROR ALPHA from obese
subjects were unique for the stromal cells fraction, whereas
changes inCRY2 and REV-ERB ALPHA occurred in adipocytes,
stromal cells and VAT. Thus, our results identified CRY2 and
REV-ERB ALPHA as the clock genes that are altered in all cell fractions in the visceral adipose tissue from obese subjects.
Table 3. Cosinor Analysis of the 24 h expression pattern of Clock genes. GENE MESOR AMPLITUDE ACROPHASE LEAN OBESE pVALUE LEAN OBESE pVALUE LEAN OBESE pVALUE CLOCK 0.70 0.77 0.61 0.35 0.25 0 .46 14.4 h 8 .6 h 0.16 BMAL1 0.65 0.84 0.14 0.36 0.40 0 .72 11.7 h 9 .8 h 0.65 PER1 0.63 0.52 0.42 0.33 0.37 0 .77 11.7 h 5 .4 h 0.07 PER2 0.67 0.55 0.44 0.31 0.37 0 .65 5.7 h 2 .9 h 0.14 CRY1 0.47 0.41 0.57 0.39 0.26 0 .15 3.4 h 6 .2 h 0.20 CRY2 0.55 1.1 0.0001*** 0.34 0.64 0 .001** 5.7 h 3 .1 h 0.27 REV E RBA 3.7 10.9 0.001** 3.3 7.4 0.003** 15.5 h 15.8 h 0.81 RORA 0.61 0.72 0.51 0.31 0.30 0 .80 9.7 h 8 .9 h 0.85 Data are mean 6 SEM. **p , 0.001. ***p , 0.001 lean vs. obese group. doi:10.1371/journal.pone. 0111678.t003
Correlation between clock gene expression in VAT and metabolic parameters
Associations between clock gene expression and several parameters of the clinical data obtained from the lean and obese groups were studied by Spearman correlation analysis and it was adjusted for age and BMI. When we analysed the whole population (lean and obese), we found a positive correlation of REV-ERB ALPHA gene expression in VAT with BMI (r = 0.552; p = 0.008, data not shown). In the obese population, among the
clock genes studied, onlyREV-ERB ALPHA displayed a strong
tendency for a positive correlation with BMI (r = 0.390; p = 0.066 and a statistically significant positive correlation with waist circumference (Fig. 5A and B). Possible correlations between clock gene expression and different cardiovascular risk factors were
also analyzed. Overall, our results showed that ROR ALPHA
(Fig. 5C) exhibited a positive correlation with HDL levels, whereas CLOCK (Fig. 5D) was correlated with LDL levels. We next refined our analysis of the obese population and separated it in two
Figure 1. 24 h of clock gene expression profiles in human adipocytes from lean and obese subjects. Circadian clock gene expression in adipocytes from lean (full line) and obese (dashed line) subjects. (A) CLOCK gene expression. (B) BMAL1 gene expression. (C) PER1 gene expression (D) PER2 gene expression (E) CRY1 gene expression (F) CRY2 gene expression (G) ROR ALPHA gene expression. (H) REV-ERB ALPHA gene expression. *p,0.05; **p,0.01; ***p,0.001; Data are expressed as mean 6S.E.M of n = 10–15. The relative expression of clock genes is calculated and normalized by 36B4 house keeping gene. Time = Time in culture after serum shock treatment.
doi:10.1371/journal.pone.0111678.g001
Figure 2. 24 h expression profiles of metabolic genes in human adipocytes from lean and obese subjects. Circadian clock gene expression in adipocytes from lean (full line) and obese (dashed line) subjects. (A) 24 h expression pattern of PPARG2 gene (B) 24 h expression pattern of NAMPT gene expression. (C) 24 h expression pattern of C/EBPA gene (D) 24 h expression pattern of C/EBPB gene. *p,0.05; **p,0.01; ***p,0.001. Data are expressed as mean 6S.E.M of n = 9–13; values are normalized by 36B4 house keeping gene. Time = Time in culture after serum shock treatment.
groups: one that did not have features of MS and was consequently named NON-MS, and one that presented the common features of MS according to IDF criteria. In the MS
group, there was a positive correlation of PER2 gene with total
and LDL- cholesterol levels (Fig. 5E and F), respectively.
Interestingly, REV-ERB ALPHA (Fig. 5G) gene expression was
again positively correlated with waist circumference in the MS
group. The correlations betweenREV-ERB ALPHA with BMI
and waist circumference suggest that this nuclear receptor could have a potential role in obesity and metabolic syndrome.
Discussion
This study provides the first evidence of altered clock gene expression in visceral adipose from obese subjects. In addition, we
identifiedREV-ERB ALPHA as a clock gene that is upregulated
in obesity and is positively correlated with BMI and waist circumference, key predictors of metabolic syndrome. Consistent with previous studies in VAT, our results confirm endogenous 24 h changes of clock genes expression in human VAT from obese women [8,20]. However, our results differ from these studies in many ways. First, while the previous works studied Bmal1, Per 2 and Cry1 only in obese subjects, we included a broader range of clock genes in both obese and lean subjects. To our knowledge, for the first time, the present work provides data regarding endogenous changes of clock genes expression in human VAT from lean women. In addition, we used isolated adipocytes to address the intrinsic pattern of clock genes without the contribu-tion of stromal cells. Thus, the robust oscillacontribu-tions of Bmal1, Per 2 and Cry1 in human adipose explants [8,20] could come from the contribution of stromal cells. The present study did not include subcutaneous adipose tissue due to the fact that subcutaneous
Figure 3. Clock gene expression in VAT from lean and obese subjects. Clock gene expression in human VAT from lean (white bars) and obese subjects (black bars). (A) BMAL1 gene expression (B) CLOCK gene expression (C) PER1 gene expression (D) PER2 gene expression. (E) CRY1 gene expression (F) ROR ALPHA gene expression (G) CRY2 gene expression (H) REV-ERB ALPHA gene expression. *p,0.05; ***p,0.001. Data are expressed as mean 6S.E.M of n = 20–28. The relative expression of clock genes is calculated and normalized by 36B4 house keeping gene.
Figure 4. Clock gene expression in SC from lean and obese subjects. Clock gene expression in human SC from lean (white bars) and obese (black bars) subjects. (A) CLOCK gene expression (B) BMAL1 expression (C) PER1 gene expression (D) PER2 gene expression (E) CRY1 gene expression (F) ROR ALPHA expression gene expression (G) CRY2 gene expression (H) REV-ERB ALPHA gene expression (I) PPARG2 gene expression (J) NAMPT gene expression. *p,0.05; **p,0.01. Data are expressed as mean 6S.E.M of n = 10–28; values were normalized by 36B4 house keeping gene.
adipose tissue showed no difference in the circadian clock gene expression among lean, overweight and type 2 diabetic subjects [9].
Our data highlighted endogenous clock genes expression changes during 24 h in adipocytes that are independent of the central clock found in the brain, demonstrating impaired clock gene expression in VAT adipocytes from morbidly obese women. The absence of oscillations in some genes suggested that the central clock could be essential for coordination of the 24 h cycle in specific clock genes in human visceral adipose tissue. The
changes inCLOCK, BMAL1 and PER1 expression occurred at
specific time points withBMAL1 exhibiting opposite changes in the
expression pattern comparing withREV-ERB ALPHA expression
in adipocytes from lean subjects. The lack of inhibitory effect of REV-ERB ALPHA on BMAL1 expression in adipocytes from obese subjects might be due to impairment in the regulation of both genes in obesity. Interestingly, in whole fat tissue of mice with high fat induced obesity both Clock and Bmal1 genes presented a different tendency with a significant attenuated expression profile during 24 h while Per2 expression diminish only selective during the
night period [21], while CLOCK D19 and BMAL1(2/2) clock
disruption determines low levels of FFA and glycerol with accumulation of triglycerides and increased adiposity [22].
One important finding of the present study was the upregulation
ofCRY2 and REV-ERB ALPHA expression in the obese group
throughout the 24 hour period. The role ofCRY2 and REV-ERB
ALPHA in human adipose tissue is not known. In animal and cell lines studies cryptochromes (CRY1 and CRY2), critical interaction partners of Pers have been involved in lipid uptake [23]. When
challenged with a hight fat diet Cry1/2 (2/2) mice rapidly gain
weight despite displaying hypophagia and presented in adipose tissue an upregulated expression of lipogenic genes involved in
insulin metabolism [23]. REV-ERB ALPHA is an important
repressor of anti-adipogenic genes [24,25] and recently
polymor-phisms in theREV-ERB ALPHA gene has been associated with
obesity in different populations [26,27,28]. Indeed, REV-ERB
ALPHA was shown to be a PPARG target gene, promoting the adipogenic activity of this gene in 3T3-L1 cells. Interestingly, our
data showed an upregulation ofPPARG2 in isolated adipocytes at
the baseline time point (T0) and again at 24 h (T24) and also in whole adipose tissue and stromal cells. This effect could not be
explained by changes inPER2 expression, since the Per2 gene was
shown to control lipid metabolism by repressing PPARG in mice
[29] and we found no difference inPER2 expression between lean
and obese during the 24 h period. However, the upregulation of PPARG2 gene could also be explained by the increase in the
expression ofC/EBPB in the obese subjects. [30]. The
downreg-ulation ofNAMPT in the obese group could also be linked with
changes in theREV-ERB ALPHA gene, since this interaction has
been observed in another cell type [17]. Although it is possible that
the interactions amongREV-ERB ALPHA, PPARG2, C/EBPB
and NAMPT may also occur in human adipose tissue, this link
should be investigated in future studies.
There has been growing evidence in recent literature of the role that circadian mechanisms play in adipose tissue biology, metabolism and obesity [6,31,32,33]. Indeed, in the present work we found a positive correlation between clock genes and markers
of metabolic syndrome, suggesting an important role of these genes in obesity and metabolic syndrome.
The relationship betweenROR ALPHA and HDL levels found in
our study is in agreement with what was found in a mice model with
decreased and dysfunctional ROR ALPHA expression [34,35].
These mice exhibit decreased adiposity and low HDL levels,
suggesting thatROR ALPHA is a key modulator of fat accumulation
and contributes to the susceptibility of these animals to developing
atherosclerosis. The positive association betweenCLOCK and LDL
levels in our study is in accordance with the link between the gene CLOCK and obesity in humans. Polymorphisms in the gene CLOCK have been associated with obesity parameters, such as cholesterol levels [36] and increased small dense LDL [37], in humans.
An important limitation of our study could be the low rate of metabolic syndrome in our population, as we have excluded from the study all patients on medications that might affect adipose tissue metabolism. Indeed, all obese patients with established type 2 diabetes and all being treated with oral antidiabetic agents such as metformin, have not been included in the study due to its effects on clock genes [11,12,13,14]. Similarly, patients treated with statins have been also excluded. Despite a small number of
subjects, our results in the MS group suggest a link betweenPER2
andREV-ERB ALPHA genes with metabolic syndrome. Indeed,
the associations between polymorphisms in thePER2 gene locus
may influence lipid metabolism by interacting with total serum fatty acids [38]. One very interesting finding of the present work is
the upregulation of the REV-ERB ALPHA gene in all cells
fractions over the course of 24 h in VAT and its correlation with BMI and waist circumference. It is worth noting that, even when
we subdivided the obese group, the positive correlation of
REV-ERB ALPHA and waist circumference was found in the MS
group. In human subcutaneous adipose tissue,REV-ERB ALPHA
has positively correlated with BMI in young obese subjects [39], and polymorphisms in this gene have been associated with obesity [26,27,28]. This is the first report regarding the association of REV-ERB ALPHA in human VAT with obesity and metabolic syndrome.
In summary, our data demonstrated that the expression pattern
of clock genesCRY2 and REV-ERB ALPHA is altered in VAT
from morbidly obese subjects during the 24 h period as compared
to lean subjects, withREV-ERB ALPHA identified as one of the
most important clock genes associated with metabolic syndrome.
Supporting Information
Figure S1 Metabolic gene expression in VAT from lean
and obese subjects. Gene expression in human VAT from lean
(white bars) and obese subjects (black bars). (A)PPARG2 gene
expression (B)NAMPT gene expression (C) PPARALPHA gene
expression (D) PPARG1 gene expression (E) SIRT1 gene
expression. **p,0.01. Data are expressed as mean 6S.E.M of
n = 20–28; values were normalized by36B4 house keeping gene.
(TIF)
Acknowledgments
The authors acknowledge Yaiza Esteban (CIBER de Diabetes y Enfermedades Metabo´licas Asociadas (CIBERDEM), Barcelona, Spain) for her technical support.
Figure 5. Correlation between clock genes and metabolic parameters. (A) REV-ERB ALPHA expression and BMI. (B) REV-ERB ALPHA expression and waist circumference (C) ROR ALPHA expression and HDL levels (D) CLOCK expression and LDL levels. (E) PER2 expression and cholesterol levels in the MS group (F) PER2 expression and LDL levels in the MS group. (G) REV-ERB ALPHA expression and waist circumference in the MS group. r = Spearman correlation coefficient.
Author Contributions
Conceived and designed the experiments: EV FH. Performed the experiments: EV ER AF GA. Analyzed the data: EV ER. Contributed
reagents/materials/analysis tools: RG JV DM FC. Wrote the paper: EV FH ER.
References
1. Spiegel K, Knutson K, Leproult R, Tasali E, Van Cauter E (2005) Sleep loss: a novel risk factor for insulin resistance and Type 2 diabetes. J Appl Physiol (1985) 99: 2008–2019.
2. Zvonic S, Floyd ZE, Mynatt RL, Gimble JM (2007) Circadian rhythms and the regulation of metabolic tissue function and energy homeostasis. Obesity (Silver Spring) 15: 539–543.
3. Scott EM, Carter AM, Grant PJ (2008) Association between polymorphisms in the Clock gene, obesity and the metabolic syndrome in man. Int J Obes (Lond) 32: 658–662.
4. Sookoian S, Gemma C, Gianotti TF, Burgueno A, Castano G, et al. (2008) Genetic variants of Clock transcription factor are associated with individual susceptibility to obesity. Am J Clin Nutr 87: 1606–1615.
5. Garaulet M, Madrid JA (2009) Chronobiology, genetics and metabolic syndrome. Curr Opin Lipidol 20: 127–134.
6. Gomez-Abellan P, Hernandez-Morante JJ, Lujan JA, Madrid JA, Garaulet M (2008) Clock genes are implicated in the human metabolic syndrome. Int J Obes (Lond) 32: 121–128.
7. Dibner C, Schibler U, Albrecht U (2010) The mammalian circadian timing system: organization and coordination of central and peripheral clocks. Annu Rev Physiol 72: 517–549.
8. Gomez-Santos C, Gomez-Abellan P, Madrid JA, Hernandez-Morante JJ, Lujan JA, et al. (2009) Circadian rhythm of clock genes in human adipose explants. Obesity (Silver Spring) 17: 1481–1485.
9. Otway DT, Mantele S, Bretschneider S, Wright J, Trayhurn P, et al. (2011) Rhythmic diurnal gene expression in human adipose tissue from individuals who are lean, overweight, and type 2 diabetic. Diabetes 60: 1577–1581. 10. (2012) Standards of medical care in diabetes–2012. Diabetes Care 35 Suppl 1:
S11–63.
11. Barnea M, Haviv L, Gutman R, Chapnik N, Madar Z, et al. (2012) Metformin affects the circadian clock and metabolic rhythms in a tissue-specific manner. Biochim Biophys Acta 1822: 1796–1806.
12. Caton PW, Kieswich J, Yaqoob MM, Holness MJ, Sugden MC (2011) Metformin opposes impaired AMPK and SIRT1 function and deleterious changes in core clock protein expression in white adipose tissue of genetically-obese db/db mice. Diabetes Obes Metab 13: 1097–1104.
13. Lamia KA, Sachdeva UM, DiTacchio L, Williams EC, Alvarez JG, et al. (2009) AMPK regulates the circadian clock by cryptochrome phosphorylation and degradation. Science 326: 437–440.
14. Um JH, Yang S, Yamazaki S, Kang H, Viollet B, et al. (2007) Activation of 59-AMP-activated kinase with diabetes drug metformin induces casein kinase Iepsilon (CKIepsilon)-dependent degradation of clock protein mPer2. J Biol Chem 282: 20794–20798.
15. Balsalobre A, Damiola F, Schibler U (1998) A serum shock induces circadian gene expression in mammalian tissue culture cells. Cell 93: 929–937. 16. Vieira E, Marroqui L, Batista TM, Caballero-Garrido E, Carneiro EM, et al.
(2012) The clock gene Rev-erbalpha regulates pancreatic beta-cell function: modulation by leptin and high-fat diet. Endocrinology 153: 592–601. 17. Vieira E, Marroqui L, Figueroa AL, Merino B, Fernandez-Ruiz R, et al. (2013)
Involvement of the clock gene Rev-erb alpha in the regulation of glucagon secretion in pancreatic alpha-cells. PLoS One 8: e69939.
18. Vieira E, Nilsson EC, Nerstedt A, Ormestad M, Long YC, et al. (2008) Relationship between AMPK and the transcriptional balance of clock-related genes in skeletal muscle. Am J Physiol Endocrinol Metab 295: E1032–1037. 19. Nakahata Y, Sahar S, Astarita G, Kaluzova M, Sassone-Corsi P (2009)
Circadian control of the NAD+ salvage pathway by CLOCK-SIRT1. Science 324: 654–657.
20. Garaulet M, Ordovas JM, Gomez-Abellan P, Martinez JA, Madrid JA (2011) An approximation to the temporal order in endogenous circadian rhythms of genes implicated in human adipose tissue metabolism. J Cell Physiol 226: 2075–2080. 21. Kohsaka A, Laposky AD, Ramsey KM, Estrada C, Joshu C, et al. (2007) High-fat diet disrupts behavioral and molecular circadian rhythms in mice. Cell Metab 6: 414–421.
22. Shostak A, Meyer-Kovac J, Oster H (2013) Circadian regulation of lipid mobilization in white adipose tissues. Diabetes 62: 2195–2203.
23. Barclay JL, Shostak A, Leliavski A, Tsang AH, Johren O, et al. (2013) High-fat diet-induced hyperinsulinemia and tissue-specific insulin resistance in Cry-deficient mice. Am J Physiol Endocrinol Metab 304: E1053–1063.
24. Chawla A, Lazar MA (1993) Induction of Rev-ErbA alpha, an orphan receptor encoded on the opposite strand of the alpha-thyroid hormone receptor gene, during adipocyte differentiation. J Biol Chem 268: 16265–16269.
25. Fontaine C, Dubois G, Duguay Y, Helledie T, Vu-Dac N, et al. (2003) The orphan nuclear receptor Rev-Erbalpha is a peroxisome proliferator-activated receptor (PPAR) gamma target gene and promotes PPARgamma-induced adipocyte differentiation. J Biol Chem 278: 37672–37680.
26. Garaulet M, Smith CE, Gomez-Abellan P, Ordovas-Montanes M, Lee YC, et al. (2013) REV-ERB-ALPHA circadian gene variant associates with obesity in two independent populations: Mediterranean and North American. Mol Nutr Food Res.
27. Goumidi L, Grechez A, Dumont J, Cottel D, Kafatos A, et al. (2013) Impact of REV-ERB alpha gene polymorphisms on obesity phenotypes in adult and adolescent samples. Int J Obes (Lond) 37: 666–672.
28. Ruano EG, Canivell S, Vieira E (2014) REV-ERB ALPHA Polymorphism Is Associated with Obesity in the Spanish Obese Male Population. PLoS One 9: e104065.
29. Grimaldi B, Bellet MM, Katada S, Astarita G, Hirayama J, et al. (2010) PER2 controls lipid metabolism by direct regulation of PPARgamma. Cell Metab 12: 509–520.
30. Hamm JK, Park BH, Farmer SR (2001) A role for C/EBPbeta in regulating peroxisome proliferator-activated receptor gamma activity during adipogenesis in 3T3-L1 preadipocytes. J Biol Chem 276: 18464–18471.
31. Bray MS, Young ME (2007) Circadian rhythms in the development of obesity: potential role for the circadian clock within the adipocyte. Obes Rev 8: 169–181. 32. Hernandez-Morante JJ, Gomez-Santos C, Milagro F, Campion J, Martinez JA, et al. (2009) Expression of cortisol metabolism-related genes shows circadian rhythmic patterns in human adipose tissue. Int J Obes (Lond) 33: 473–480. 33. Wu X, Zvonic S, Floyd ZE, Kilroy G, Goh BC, et al. (2007) Induction of
circadian gene expression in human subcutaneous adipose-derived stem cells. Obesity (Silver Spring) 15: 2560–2570.
34. Kang HS, Okamoto K, Takeda Y, Beak JY, Gerrish K, et al. (2011) Transcriptional profiling reveals a role for RORalpha in regulating gene expression in obesity-associated inflammation and hepatic steatosis. Physiol Genomics 43: 818–828.
35. Lau P, Fitzsimmons RL, Raichur S, Wang SC, Lechtken A, et al. (2008) The orphan nuclear receptor, RORalpha, regulates gene expression that controls lipid metabolism: staggerer (SG/SG) mice are resistant to diet-induced obesity. J Biol Chem 283: 18411–18421.
36. Garaulet M, Corbalan MD, Madrid JA, Morales E, Baraza JC, et al. (2010) CLOCK gene is implicated in weight reduction in obese patients participating in a dietary programme based on the Mediterranean diet. Int J Obes (Lond) 34: 516–523.
37. Tsuzaki K, Kotani K, Sano Y, Fujiwara S, Takahashi K, et al. (2010) The association of the Clock 3111 T/C SNP with lipids and lipoproteins including small dense low-density lipoprotein: results from the Mima study. BMC Med Genet 11: 150.
38. Garcia-Rios A, Perez-Martinez P, Delgado-Lista J, Phillips CM, Gjelstad IM, et al. (2012) A Period 2 genetic variant interacts with plasma SFA to modify plasma lipid concentrations in adults with metabolic syndrome. J Nutr 142: 1213–1218. 39. Wu X, Xie H, Yu G, Hebert T, Goh BC, et al. (2009) Expression profile of mRNAs encoding core circadian regulatory proteins in human subcutaneous adipose tissue: correlation with age and body mass index. Int J Obes (Lond) 33: 971–977.