ONE-SIDED AND TWO-SIDED NONPARAMETRIC TESTS FOR HETEROGENEITY COMPARISONS
R. Arboretti Giancristofaro, S. Bonnini, F. Pesarin, L. Salmaso
1. INTRODUCTION
It is often of interest to compare the concentration of two distributions. For example, the so called “external efficacy” of two different doctorate courses can be assessed by comparing the heterogeneity of the range of job opportunities of-fered by each. Obviously the most effective course is the one that offers the wid-est and therefore most heterogeneous range of job opportunities. In this matter, from a statistical point of view, job opportunities represent the nominal categori-cal response variable and the two populations consist of all the students who have achieved a doctorate in one course or the other. A sampling survey aimed at determining the kind of job Ph.D. graduates attain as their first post, could pro-vide the initial data useful in resolving the above issue.
In marketing studies, in order to accomplish successful communication strate-gies, a company might be interested in evaluating the heterogeneity of its customer base. The qualitative variable under examination could be the level of education, pastimes and lifestyle or any other socio-economic variables which are of interest to the company. Obviously the comparison of the heterogeneity of two distinct client groups, referenced by two different geographical areas, two dif-ferent channels of distribution, two difdif-ferent kinds of products etc., could prove useful to the company to focus on the correct choice regarding the differentiation of products or the segmentation of the market.
Another science in which heterogeneity is also relevant is genetics. In this field studies exist that deal with the comparison of two populations in order to verify which of the two presents a wider genetic differentiation, that is a wider hetero-geneity from the point of view of the phenotypical combinations of certain ge-netic factors (Corrain et al., 1977).
Other examples of specific applications are the study of the territorial distribu-tion of certain types of plants (comparing one area with another), the territorial distribution of human activities (comparing regions and countries), the different type of secondary school attended by undergraduates (comparison between two degree courses or faculties), biodiversity, and several others. The range of
applica-tions in which the comparison of heterogeneity proves useful is both countless and diverse and is the concern of social sciences, medicine, chemical and biologi-cal sciences, engineering, and many more besides.
The importance of measuring heterogeneity is evident if one considers the studies of the imbalances of the ecosystem which render vitally important the ex-act determination of the genetic differentiation between species and the risks of their reduction by applying proper measures of ecological diversity (Patil e Taillie, 1982; Pielou, 1975, 1977). In the analysis of electoral preferences the indices of polarization that measure the degree of polarization of the consensus over time and territory are in fact indices of homogeneity. The richness of the vocabulary by an author, the indecision when confronted with alternative choices, the muta-bility of the flora are all issues where the measure of heterogeneity is an essential aspect in the analysis of the problem.
As far as the methodology is concerned, the heterogeneity has been dealt with mostly from a descriptive point of view, i.e. with the objective of determining those indicators capable of providing appropriate measurements of the degree of heterogeneity of a distribution. The object of this work is to establish an inferen-tial procedure which allows for the solution of the above mentioned issues, whose goal is to compare the heterogeneity of two populations on the basis of sampling data.
The method we propose consists of determining suitable test statistics and a general methodology based on the ordering of probabilities of various categories and on a nonparametric test, that, for the one-sided test, is similar to the one proposed by Pesarin (2001) for issues of stochastic dominance. It is important to note that the class probabilities of two distributions are unknown parameters and therefore the ordering of the probabilities can only be assessed on the basis of sampling data. The proposed solutions are therefore approximate.
In section 2 we show some of the contributions in the literature in which het-erogeneity is dealt with from the descriptive point of view. We list the main pro-posed indicators of heterogeneity and describe some of their properties. Section 3 deals with the nonparametric test statistics for the comparison of heterogeneity between two samples, describing their characteristics and their main properties. The solution we propose for the directional case shows certain analogies with the test proposed for problems of stochastic dominance, i.e. for restricted alterna-tives, in the presence of ordinal categorical variables. In section 4 we describe some results with regard to a simulation study carried out using the Monte Carlo method to evaluate the behaviour of the proposed test under the null hypothesis and the alternative hypothesis. Section 5 consists of some final considerations on the issue and the results obtained.
2. HETEROGENEITY IN DESCRIPTIVE STATISTICS
The concept of heterogeneity is mostly used in descriptive statistics. Homogeneity notoriously means the attitude of a statistical phenomenon to always be
mani-fested in the same class or category. A set of statistical units is therefore homoge-neous if all its units are characterized by the same category. If this does not occur, that is if at least two categories in the set of statistical units are found, then units are heterogeneous. Heretogeneity is therefore characterized by absence of homo-geneity. The degree of heterogeneity obviously depends on the number of catego-ries observed as well as on their associated frequencies. In particular the hetero-geneity is at a minimum if the distribution of the observed variable is degenerate, i.e. it presents a single category with a relative frequency equal to 1 and all the others with a frequency equal to 0. On the other hand heterogeneity is at a maxi-mum if the variable is equally distributed on all the categories.
Consequently an index that syntetically measures the degree of heterogeneity of the observed phenomenon must satisfy the following characteristics:
1. It assumes minimum value when the phenomenon under study is mani-fested with a single category, i.e. in presence of maximum homogeneity; 2. it assumes increasingly greater values the more one moves away from the
degenerate distribution and the more one approaches the equidistribution; 3. it assumes the maximum value in presence of equidistribution.
It is well known that the notion of heterogeneity is related to that of concentra-tion.
Heterogeneity can be also associated with the notion of diversity, that is the atti-tude of a qualitative variable to assume different modalities. This, in turn, is asso-ciated with the concepts of uncertainty and of information, because in case of mini-mum heterogeneity also the uncertainty of a classification is at a minimini-mum and the information derivable from a single observation is at a maximum. In the op-posite case of maximum heterogeneity one has maximum uncertainty and mini-mum information is derivable from a single unit. Starting from these notions, various indicators were proposed in the literature, only the most commonly used will be mentioned here.
The index of heterogenity proposed by Gini (1912), for a variable X which as-sumes k categories with relative frequencies fi, i=1,2,...,k, is
2 1 (1 ) 1 1 k k i i i s s G=
∑
= f − f = −∑
= f , (1)whose normalized version is G* = G(k – 1)/k.
Shannon's index of diversity, also called index of entropy of a distribution, is as-sociated with information theory (Shannon, 1948) and is defined as
1 log(1/ ) 1 log( )
k k
i i i i
s s
S=
∑
= f f = −∑
= f f , (2)where log(⋅) are natural logarithms, even though in the original version they were in base 2, and we assume that 0⋅log(0)=0. The normalized version is H*=H/log(k).
Observing that G can be interpreted as the mean of 1 – fi, (i = 1,2,...,k), which in turn are measures of heterogeneity for the single attributes, Leti (1965) pro-posed as an index the geometric mean of 1/fi :
1( ) i k f i i L=
∏
= f − , (3)which in fact is a monotonic transformation of Shannon’s index since L = exp(S). The normalized version of Lis L* = (L – 1) / (k – 1).
Quite a general approach was proposed by Frosini (1981) who introduced in-dices of homogeneity and of heterogeneity as the distance between the vector of the observed relative frequencies (f1, f2,..., fk)′ and that of the relative frequencies in the hypothesis of maximum heterogeneity (1/k, 1/k,..., 1/k)′. If the euclidean distance is used, Frosini’s index of homogeneity is
2 1 1 k i i F f k = ⎛ ⎞ = ⎜ − ⎟ ⎝ ⎠
∑
, (4)the normalized version of which is related to that of Gini, because 2 * 2 * 1 1 1 1 1 1 ( ) 1 1 . 1 1 1 k k i i i i k k F f f G k = k k = k ⎛ ⎞ ⎛ ⎞ ⎛ ⎞ = − ⎜ ⎟ ⎜ − ⎟ = − ⎜ ⎟ − = − − − − − ⎝ ⎠
∑
⎝ ⎠ ⎝ ⎠∑
Both indices are inverse functions of Σi fi2, which therefore is the core statistics for homogeneity upon which so many methodological proposals are based. The class of indices proposed by Frosini in reality is wide-ranging and with distances different from the euclidean one can obtain alternative versions of the index. If for example one chooses the distance in absolute value (Manhattan metrics), one obtains the following normalized index:
1 1 * 1 2( 1) k i i k D f k = k = − − −
∑
. (5)A generalized index taken from the field of information theory, is the generalized index of entropy of order α proposed by Rényi (1966)
1 1 log 1 k i i Rα fα α = = −
∑
, (6)with α ≠ 1. Rα is a non-increasing function of α. As α varies, one obtains differ-ent indices of heterogeneity and some particular cases among the most frequdiffer-ently used are:
1. 1 1 1
1 1
lim log( ) log( ) 1 k k i i i i i R fα f f S α→ α = = ⎡ ⎤ = ⎢ ⎥= − = − ⎣
∑
⎦∑
, 2. 2 log( 1 2) log(1 ) k i i R = −∑
= f = − −G ,3. 1
1,..., 1
lim log( ) log sup ( ) 1 k i i i i k R fα f α α ∞ →∞ = = ⎡ ⎤ ⎡ ⎤ = ⎢ ⎥= − ⎢ ⎥ − ⎣
∑
⎦ ⎣ ⎦.3. TWO SAMPLE TEST FOR COMPARING HETEROGENEITY
In the previous section we dealt with the notion of heterogeneity from a de-scriptive point of view, namely by considering the indices that measure the degree of heterogeneity of a frequency distribution. From now on we will take into con-sideration the inferential problem which consists of comparing the sampling het-erogeneity of a categorical variable X in two populations. That is, to test in the light of two sample data the hypothesis that the heterogeneity in one population is greater than in the other (one-sided test) or the hypothesis that two heteroge-neities are not equal (two-sided test). To this end, let Xjh , h=1,...,nj, be i.i.d. (inde-pendent and identically distributed) sample data of size nj ≥ 1 from the jth popu-lation, j=1,2. It is assumed that the values of random variable X can fall within one of the k categories A1, A2,..., Ak with probability distribution {pi ≥ 0, Σi pi = 1, i = 1,2,...k}. It is worth noting that for our testing problem population prob-abilities pji = Pr {Xj = Ai}, i = 1,2,...k, j=1,2, play the role of underlying parame-ters.
From a formal point of view, given two populations X1 e X2, if we indicate with Het(Xj) the degree of heterogeneity of population Xj (j =1,2), the problem of hypothesis testing with one-sided alternative can be expressed as
0: ( 1) ( 2)
H Het X =Het X
against
1: ( 1) ( 2)
H Het X >Het X .
We take into consideration the indeces of Gini G = Σi pi(1 - pi), of Shannon S=-Σi pi log( pi ), of Rényi for α = 3 and α → ∞, R3 = -log(Σi pi 3)/2 and R∞ = -log [supi (pi)], respectively, and that of Frosini F = (Σi (pi – 1/k)2)1/2. The choice of R3 instead of R2, which is perhaps the index of Rényi most used in the literature, is dictated by the fact that R2 is one-to-one related with G, and therefore the two indices imply the same inferential conclusions when applying theory and methods of permutation tests, since they are permutationally equivalent.
Let us indicate with p(i), i =1,2,...,k, the underlying parameters of X arranged in non-increasing order: p(1) ≥ p(2) ≥ ... ≥ p(k). We note that, indices G, S, R3, R∞ and F are order invariant, i.e. their values do not change if they are calculated with ordered parameters p(i) in place of proper parameters pi. If we indicate with pj(i), i =1,2,...,k, the ordered probabilities for population j, j = 1,2, the fact that the indices of het-erogeneity are order invariant allows us to express hethet-erogeneity through ordered parameters. To this end, let us observe that: two populations such that {p1(i) = p2(i),
i=1,2,...,k}, that is with the same ordered distribution, are equally heterogeneous. Moreover, if {p1(i) = p2(i), i=1,2,...,k} then data of two samples are exchangeable and so the permutation testing principle applies.
Then the null hypothesis of our problem can be equivalently written as: 0: 1( )i 2( )i
H p = p , for i = 1,2,...,k.
The problem is similar to stochastic dominance problem for ordinal categorical variables, with the peculiarity that the order is now determined according to the values of the parameters pi and not according to the categories the variable X can assume. Therefore, our problem can be referred to as one of dominance in heteroge-neity. We may observe that X generally is a nominal variable, because heterogene-ity is a property that concerns probabilities and does not involve the categories of X, whereas the standard problem of stochastic dominance assume that classes A1, A2,..., Ak are ordered.
For problems of stochastic dominance the literature offers quite a long list of exact and approximate solutions. Among the many, we mention those of Agresti and Klingerberg (2005), Han et al. (2004), Hirotsu (1986), Loughin and Scherer (1998), Loughin (2004), Lumely (1996), Nettleton and Banerjee (2001). For the univariate case most of the methodological solutions proposed are based on the restricted maximum likelihood ratio test. Among these we mention Cohen et al. (2000), Silvapulle and Sen (2005), Wang (1996). In general these solutions are criticized because the distributions under the null and alternative hypothesis are asymptotically mixtures of chi-squared variables with weights essentially depend-ent on the unknown population distribution. Nonparametric proposals are those of Troendle (2002), Brunner and Munzel (2000), Pesarin (1994 and 2001), and Pesarin and Salmaso (2006). The latters, based on the nonparametric combination of dependent permutation tests (NPC), provide for exact, unbiased, and consis-tent tests.
As far as we are concerned in difference of heterogeneity, it is reasonable to take into consideration as test statistic the difference of two sampling indices:
TI = I1 – I2,
where index I stands for G, S, R3, R∞, and F and, of course, Ij indicates the sam-pling value of I calculated for population j, j = 1,2. Clearly the tests will be signifi-cant for large values, i.e. large values observed in the test statistic can lead to the rejection of the null hypothesis in favour of the alternative. In order to apply the tests according to the usual approach, it is necessary to make reference to their sampling null distributions. These can be known in principle if the set of underly-ing null parameters (p•(1),p•( 2),...,p•( )k )′ were known. But since in practice this knowledge is not available, we must act subject to a proper sampling estimate un-der H0 of the marginal vector of orun-dered probabilities. That is, we must consiun-der
( ) ( ) ( )
ˆj i j i j i / j
(pj1, pj2,...,pjk)′ as well as those of the ordered probabilities (pj(1), pj(2),..., pj(k))′, j = 1,2, are unknown. In reality this question is not easy to solve exactly, with per-haps the exception where k = 2. For this purpose, instead of the true ordering of unknown parameters {pj(1), pj(2),..., pj(k); j=1,2}, we utilize its estimate (data driven solution) based on ordering the observed frequencies (empirical ordering)
(1) ( 2) ... ( ) ˆ (1) ˆ ( 2) ... ˆ ( )
j j j k j j j k
f ≥ f ≥ ≥ f ↔ p ≥ p ≥ ≥ p , j=1,2, thus, obtaining the following ordered table:
TABLE 1
Probabilities ordered by frequencies
Classes Sampling
Population (1) (2) ... (k) Dimensions
X1 n1(1) n1(2) ... n1(k) n1
X2 n2 (1) n2(2) ... n2 (k) n2
n⋅(1) n⋅(2) ... n⋅(k) N
We note that the order is realized separately for each sample and as it is based on frequencies rather than on classes, it could be that the i-th column of table 1 re-fers to two diverse classes for the two samples. In other words class (i) corre-sponds to the class whose observed frequency occupies the i-th position in the ordered sequence and can be different for the two samples. Obviously the order imposed by the frequencies presents a random component and may vary depend-ing upon sampldepend-ing variations. Therefore under H0 data are not exactly exchange-able as it would be if the true order of population parameters were known and used. The exchangeability property can only be obtained asymptotically. There-fore, permutation solutions are approximate for finite sample sizes and asymp-totically exact.
Using the data in table 1, the observed value of the test statistic o I
T is calcu-lated. For each permutation of the dataset one obtains a new permuted table (as in table 2), with different values from those of the observed table but with fixed marginal frequencies.
TABLE 2
Absolute frequencies after a permutation of data
Classes Sampling
Population (1) (2) ... (k) Dimensions
X1 n*1(1) n*1(2) ... n*1(k) n1 X2 n*2 (1) n*2 (2) ... n*2 (k) n2
n⋅ (1) n⋅ (2) ... n⋅ (k) N
Using the data of the permutated table in the calculations of test statistic, one obtains the permutation values TI∗. Calculating the values that can be obtained making all the possible permutations, one obtains the permutation distribution of each test statistic. Alternatively it is possible to extract a random sample from the
set of all permutations, thus obtaining conditional Monte Carlo estimates. In this way it is possible to calculate the p-value, that, if B is the number of considered permutations, is given by
#( o| )/
I TI TI B
λ = ∗≥ X ,
for the test based on index I, where #( o| )
I I
T∗≥T X indicates the number of times permutation values are not lower than the observed one, conditionally on the given dataset X. The dependency on X is equivalent to the dependency on the space gen-erated by all the possible permutations of X, namely the orbit associated with X. Therefore, according to the general deciding rule of the tests, if the p-value is less than or equal to the fixed significance level, the null hypothesis is rejected in favour of the alternative hypothesis otherwise the null hypothesis cannot be rejected.
The problem, with two-sided alternative hypothesis, can be expressed as fol-lows 0: ( 1) ( 2) H Het X =Het X against 1: ( 1) ( 2) H Het X ≠Het X ,
the test statistic can be based on the absolute value or on the square of difference of the sampling indexes:
TI 2 = (I1 – I2)2,
and the testing procedure is the same described for the one-sided test. 4. SIMULATION STUDY
In order to assess the properties of the test, we consider a simulation study in which data are generated according to the following model:
X ∼ 1 + Int [k ⋅ U δ],
where δ∈ R is a real number and U is uniformly distributed in the open unit in-terval (0,1).
The random variable X is therefore discrete, whose domain consists of the first k positive integers. The situation of maximum heterogeneity is simulated by making δ = 1.
Increasing δ the distribution of X moves further away from maximum hetero-geneity approaching that of maximum homohetero-geneity where frequencies tend to be concentrated on the first category. The choice of this model, as an alternative to
the generation of data hypothesizing diverse possible distributions of probabilities for the two populations, mainly depends on the fact that studying the power of a nonparametric test, the variety of proposable alternatives for simulations is so vast that it is almost impossible to consider them all (Lehmann, 1953). In this way we can generate discrete distributions with different degrees of heterogeneity us-ing a sus-ingle parameter instead of K, as we would if data were generated from a completely specified distribution, such as: p1, p2,.., pk.
Generating the data as described, for diverse sample sizes, diverse couples of parameters δ1 and δ2 for respectively population X1 and X2, and diverse values of nominal significance level, we calculated the rejection rates of some tests in order to verify their degree of approximation as well as their power. The results re-ported refer to the case of k = 16.
Table 3 reports, for the one-sided test, the rejection rates of test TG, based on Gini’s index, TS, based on Shannon’s index, TR3 and TR∞ based on Rényi’s index of order 3 and ∞ respectively, and TF, based on Frosini’s index, under the null hypothesis, for different degrees of heterogeneity with δ1 and δ2 ranging from 2 (maximum heterogeneity), to 3. 2000 dataset were generated each with 2000 per-mutations in order to approximate the related permutation distribution. Reported results show that, in general, the most conservative test is that based on the index
R∞ of Rényi. For the other tests the performances are very similar, even though
those based on R3 and F shows to be slightly anticonservative but in any case we can conclude that the tests are substantially well approximated. In general, by in-creasing of δ1 and δ2 the rejection rates tend to increase.
TABLE 3
Rejection rates for the one-sided tests in the null hypothesis
δ1 δ2 n1 n2 nominal alpha Test
0.010 0.050 0.100 2 2 20 20 0.005 0.038 0.086 TG 0.006 0.039 0.087 TS 0.010 0.067 0.124 TR3 0.002 0.029 0.069 TR∞ 0.005 0.056 0.124 TF 20 10 0.006 0.036 0.083 TG 0.007 0.037 0.084 TS 0.015 0.066 0.140 TR3 0.007 0.024 0.051 TR∞ 0.009 0.079 0.140 TF 3 3 20 20 0.010 0.052 0.115 TG 0.011 0.053 0.116 TS 0.017 0.069 0.134 TR3 0.007 0.034 0.062 TR∞ 0.012 0.060 0.127 TF 20 10 0.012 0.064 0.116 TG 0.013 0.065 0.117 TS 0.016 0.085 0.144 TR3 0.003 0.026 0.054 TR∞ 0.014 0.079 0.150 TF
To evaluate the power of five tests we considered some situations in which the heterogeneity of the two populations were different. In this case 1000 dataset
were generated and, for each of these, 1000 permutations. Obviously, the power of the tests increases with the increase in the difference of heterogeneity parame-ters δi, i=1,2, (table 4).
Comparing the performances of the four tests it emerges that the power of the test TR∞ is slightly lower than that of the others, while a preference is shown for the test TR3, based on Rényi's entropy index of order 3.
TABLE 4
Rejection rates for the one-sided tests in the alternative hypothesis
δ1 δ2 n1 n2 nominal alpha Test
0.010 0.050 0.100 2 2.5 20 20 0.016 0.097 0.224 TG 0.017 0.098 0.225 TS 0.036 0.156 0.272 TR3 0.014 0.074 0.137 TR∞ 0.017 0.100 0.204 TF 20 10 0.023 0.097 0.186 TG 0.024 0.098 0.187 TS 0.046 0.154 0.250 TR3 0.016 0.069 0.119 TR∞ 0.031 0.132 0.210 TF 2 4 40 40 0.522 0.756 0.856 TG 0.523 0.757 0.857 TS 0.542 0.767 0.860 TR3 0.409 0.659 0.776 TR∞ 0.396 0.654 0.761 TF 30 40 0.466 0.730 0.841 TG 0.467 0.731 0.842 TS 0.506 0.746 0.847 TR3 0.354 0.630 0.748 TR∞ 0.360 0.614 0.734 TF
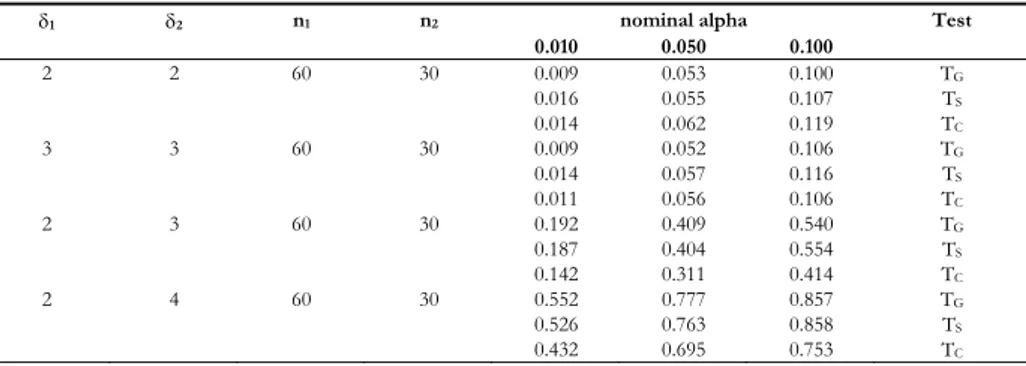
Table 5 reports, for the two-sided test, the rejection rates of test TG, TS and TC, under the null and alternative hypotheses, for different degrees of heterogeneity with δ1 and δ2 ranging from 2 to 4. Test TC is based on χ2 test statistic. The per-formance of the three tests are quite similar: under the null hypothesis the rejec-tion rates are not very different from the nominal significance level and under the alternative hypothesis the estimated powers are high. Rejection rates of TC under the alternative hypothesis are slightly less than the others.
TABLE 5
Rejection rates for the two-sided tests in the null and alternative hypotheses
δ1 δ2 n1 n2 nominal alpha Test
0.010 0.050 0.100 2 2 60 30 0.009 0.053 0.100 TG 0.016 0.055 0.107 TS 0.014 0.062 0.119 TC 3 3 60 30 0.009 0.052 0.106 TG 0.014 0.057 0.116 TS 0.011 0.056 0.106 TC 2 3 60 30 0.192 0.409 0.540 TG 0.187 0.404 0.554 TS 0.142 0.311 0.414 TC 2 4 60 30 0.552 0.777 0.857 TG 0.526 0.763 0.858 TS 0.432 0.695 0.753 TC
5. CONCLUDING REMARKS
This work consists of an inferential procedure that allows for a solution to the problem of hypothesis testing, in which the objective is that of comparing the heterogeneity of two populations on the basis of sampling data, i.e. to test the hypothesis that the heterogeneity of one population is greater or not equal than that of another.
Such a proposal consists of finding appropriate test statistics and a general methodology of hypothesis testing based on the ordering of probabilites. The test statistic consists of the comparison of the sampling indices of heterogeneity cal-culated for two samples and can vary according to the index of heterogeneity considered. The test statistics taken into consideration are those based on the in-dex of entropy of Shannon, on the inin-dex of heterogeneity of Gini, on the indices of entropy of order 3 and infinite proposed by Rényi and on the index of hetero-geneity of Frosini. The fact that the probabilites of the two distributions com-pared are unknown parameters and therefore the ordering of probabilities can only be estimated on the basis of sampling data, implies that the proposed solu-tions are approximate. As estimates of the probabilities the observed relative fre-quencies were used. The choice of the nonparamteric test proves to be both prac-tical and efficient, easy to apply and requiring few and weak assumptions without knowing the distribution of the data nor that of the test statistics.
The simulation study permitted to assess the degree of approximation in the null hypothesis and the power behaviour of the proposed non parametric tests of heterogeneity. The rejection rates increase with the increase in the homogeneity of distributions. Among the test statistics considered, that based on the index of Rényi of order 3 seems to register higher rejection rates under H0 but a slightly higher power under H1. The rejection rates under the alternative hypothesis are in any case satisfactory for all the tests considered.
Dipartimento di Matematica ROSA ARBORETTI GIANCRISTOFARO
Università di Ferrara
Dipartimento di Scienze Statistiche STEFANO BONNINI
Università di Padova FORTUNATOPESARIN
Dipartimento di Tecnica e Gestione dei Sistemi Industriali LUIGI SALMASO
Università di Padova
REFERENCES
A. AGRESTI, B. KLINGENBERG (2005), Multivariate tests comparing binomial probabilities, with
applica-tion to safety studies for drugs, “Applied Statistics”.
E. BRUNNER, U. MUNZEL (2000), The nonparametric Behrens-Fisher problem: asymptotic theory and
small-sample approximation, “Biometrical Journal”, 42, pp. 17-25.
A. COHEN, J.H.B. KEMPERMAN, D. MADIGAN, H.B.SAKROWITZ (2000), Effective directed tests for models
with ordered categorical data. “Australian and New Zealand Journal of Statistics”, 45, pp.
C. CORRAIN, F. MEZZAVILLA, F. PESARIN, U. SCARDELLATO (1977), Il valore discriminativo di alcuni
fattori Gm, tra le poplazioni pastorali del Kenya, in “Atti e Memorie dell’Accademia Patavina
di Scienze, Lettere ed Arti”, LXXXIX, Parte II: Classe di Scienze Matematiche e Natu-rali, pp. 55-63.
B.V. FROSINI (1981), Heterogeneity indeces and distances between distributions, “Metron”, XXXIX, pp. 3-4.
C. GINI (1912), Variabilità e mutabilità, in “Studi economico-giuridici della Facoltà di Giuri- sprudenza”, Università di Cagliari.
K.E. HAN, P.J. CATALANO, P. SENCHAUDHURI, C. MEHTA (2004), Exact analysis of dose-response for
multiple correlated binary outcomes, “Biometrics”, 004,60, pp. 216-24.
C. HIROTSU (1986), Cumulative chi-squared statistic as a tool for testing goodness-of-fit, “Biometrika”, 73, pp. 165-173.
E.L. LEHMANN (1953), The power of rank tests, “The Annals of Mathematical Statistics”, 24, 1, pp. 23-43.
G. LETI (1965), Sull’entropia, su un indice del Gini e su altre misure dell’eterogeneità di un collettivo, “Metron”, XXIV, pp. 1-4.
M.D. LORENZ (1905), Methods of measuring the concentration of wealth, “Journal of the American Statistical Association”, 70, pp. 209-219.
T.M. LOUGHIN (2004), A Systematic Comparison of Methods for Combining P-Values from
Independ-ent Tests, “Computational Statistics and Data Analysis”, 47, pp. 467-485.
T.M. LOUGHIN, P.N. SCHERER (1998), Testing for Association in Contingency Tables with Multiple
Column Responses, “Biometrics”, 54, pp. 630-637.
T. LUMLEY (1996), Generalized estimating equations for ordinal data: a note on working correlation
structures. “Biometrics”, 52, pp. 354-361.
D. NETTLETON, T. BANERJEE (2001), Testing the equality of distributions of random vectors with
cate-gorical components, “Computational Statistics and Data Analysis”, 37, pp. 195-208.
G.P. PATIL, C. TAILLIE (1982), Diversity as a concept and its measurement (with discussion), “Journal of the American Statistical Association”, 77, pp. 548-567.
F. PESARIN (1994), Goodness-of-fit testing for ordered discrete distributions by resampling techniques, “Metron”, LII, pp. 57-71.
F. PESARIN (2001), Multivariate Permutation Test With Application to Biostatistics. Wiley, Chiches-ter.
F. PESARIN, L. SALMASO (2006), Permutation tests for univariate and multivariate ordered categorical
data, “Australian Journal of Statistics”, 35, pp. 315-324.
E.C. PIELOU (1975), Ecological Diversity, Wiley, New York. E.C. PIELOU (1977), Mathematical Ecology, Wiley, New York. A. RÉNYI (1966), Calculus des probabilitès, Dunod, Paris.
C.E. SHANNON (1948), A mathematical theory of communication, “Bell System Technological
Journal”, 27, 379-423, pp. 623-656.
M.J. SILVAPULLE, P.K. SEN (2005), Constrained Statistical Inference, Inequality, Order, and Shape
Re-strictions. Wiley, New York.
J.F. TROENDLE (2002), A likelihood ratio test for the nonparametric Behrens-Fisher problem. “Bio-metrical Journal”, 44, 7, pp. 813-824.
Y. WANG (1996), A likelihood ratio test against stochastic ordering in several populations. “Journal of the American Statistical Association”, 91, pp. 1676-1683.
SUMMARY
One-sided and two-sided nonparametric tests for heterogeneity comparisons
This work consists of an inferential procedure that allows for a solution to the problem of hypothesis testing, in which the objective is that of comparing the heterogeneity of two populations on the basis of sampling data, i.e. to test the hypothesis that the heterogeneity of one population is greater or not equal than that of another. The simulation study igh-lights the good behaviour of the tests, i.e. the proposed tests are well approximated and powerful.