CORRELATES OF INTER-DISTRICTS MIGRATIONS IN
TANZANIA. A GRAVITY-TYPE MODELING APPROACH
Elena Pirani1
Dipartimento di Statistica, Informatica, Applicazioni “G. Parenti”, Università di Firenze, Firenze, Italia
Maria Francesca Marino
Dipartimento di Statistica, Informatica, Applicazioni “G. Parenti”, Università di Firenze, Firenze, Italia
Alessandra Petrucci
Dipartimento di Statistica, Informatica, Applicazioni “G. Parenti”, Università di Firenze, Firenze, Italia
1. INTRODUCTION
Migration is the process by which individuals, alone or in groups, leave their place of birth and move. Currently, population mobility is reaching the highest level ever achieved in modern history, and there is no reason to believe that the trend will reverse. In this respect, migration will certainly represent one of the main priorities of the 21st century. According to the most recent data of the United Nations, the total number of international migrants in the world is equal to 258 million, and the estimated number of internal migrants (or migrants inside their country of origin) is even larger, 763 million (Bell and Charles-Edwards, 2013).
Internal and external migrations are totally diverse, in terms of social, economic and environmental determinants, migrants’ capabilities and aspirations, consequences on both individuals and territories, and in terms of patterns (e.g., De Haas, 2010, 2014). The discussion of these complex differences goes beyond the intentions of this work, however. Here, we investigate the role of environmental factors as potential drivers of inter-districts migrations in Tanzania, along with a number of socio-economic factors traditionally identified as key correlates.
The bulk of African migration is directed towards other African countries and, more specifically, neighbouring countries. Recent migration processes are strictly linked to
the urbanisation process, leading to large movements from inland and marginal rural areas to fertile agricultural areas, towns, and cities. These patterns between African countries are replicated also within countries (Adepoju, 2006; Schoumakeret al., 2013; Flahaux and De Haas, 2016), and Tanzanian migrations reflect this general pattern.
International migration contributes little to population change in Tanzania (Ag-wanda and Amani, 2014), but this country has a long history of population mobility and intensive population redistribution across its regions. Whereas in the 1960s and 1970s migration was predominately related to rural-to-rural movements (also from neighbour-ing countries) due to labour recruitment for plantation agriculture, the 1980s accelerated the rural-to-urban migration (Msigwa and Mbongo, 2013). Internal migration signif-icantly influences population and urbanisation change, because of the rural-to-urban migration but also because of some forms of temporary labour migration from towns to plantations which take place seasonally for harvests. In 2012, almost 17% of the 43.9 million of Tanzanians were living outside their region of birth, i.e., 7.4 million of peo-ple, 2 million more than 10 years before. More than 50% of these migrants were young (less than 30 years old), and the proportion of women was slightly higher than 50%, es-pecially among younger migrants (National Bureau of Statistics Tanzania, 2015). Over the last decades, Tanzania has experienced a notable increase in Gross Domestic Prod-uct (GDP – annual growth rate of 7%). Notwithstanding some remarkable progress in child survival and school enrolment, improvements in the overall status of human de-velopment in Tanzania and in poverty reduction are only marginal. Moreover, strong internal differentials still persist, with deep differences especially across urban and ru-ral areas. Low productivity and output, together with the shortage of basic needs and modern amenities in rural areas, have forced young people to migrate to urban areas in the hope of meeting their expectations (United Nations Development Program, 2015).
The factors that mostly influence internal mobility in Tanzania include the pres-ence of economic resources like minerals (e.g., the case of Geita region), the availability of land for settlement (e.g., Katavi, Tabora and Manyara region), and large scale plan-tations (e.g., Morogoro region). Other areas pull more migrants thanks to their urban-isation and economic development, or strong economic activities linked, for example, to tourism (Dar es Salaam City and Mjini Magharibi, in Zanzibar). On the contrary, regions like Iringa, Dodoma, and Kilimanjaro have a big turnover of migrants largely because of population pressure and harsh environmental conditions like aridity (United Nations Development Program, 2015).
Even though the perceived or the actual lack of employment opportunities in rural areas is the main cause for rural-to-urban migration, environmental shocks are becoming increasingly important. A number of studies have found that climate change may have a significant impact on the natural resources of the country (Agrawalaet al., 2003; Majule et al., 2008; Liwenga et al., 2012), and Tanzania has been found to be especially vulnerable to droughts or floods (Raleighet al., 2008).
Motivated by these lines of evidence, we explore whether and how environmental shocks and socio-economic characteristics have affected internal migration flows across Tanzanian districts in recent years.
In this study, we follow a macro approach and focus on migration flows across Tan-zanian districts. This country represents an interesting case study due to its diversity in terms of agro-climatic conditions and ecological zones, and to its important move-ments of population across internal borders. In this respect, we implement a gravity-type model to analyse the potential impact of environmental shocks and socio-economic characteristics of both the area of origin and destination on inter-districts migration. We have a three-fold aim. First, we aim at identifying the correlates of internal migration from a macro perspective by looking at the characteristics of both the area of origin and destination of the migration process. Second, by considering socio-economic and envi-ronmental variables, we point at assessing their relative importance, in order to suggest possible strategies to face emergency situations. Third, we aim at considering a highly precise level of territorial specification i.e., the districts, which is more detailed than the one considered in previous research, i.e., the regions. The migration process is strongly correlated with distance and, especially for more disadvantaged people, financial con-straints prevent long distance movements. In these situations, focusing on internal mi-gration flows, and especially on inter-district movements, allows a better understanding of the process and of its determinants.
2. THEORETICAL AND EMPIRICAL BACKGROUND
2.1. Climate conditions and migration
People migrate for complex and diverse reasons: to find work and improve their eco-nomic situation, for family reunification, to escape conflicts or persecutions, to escape from critical environmental situations, etc. These reasons change their relative impor-tance over time and in different contexts, and also shape the direction, the disimpor-tance, and the duration of the migration process. What is certain is that environmental factors will increasingly influence migratory choices, altering the already complex model of human mobility (Blacket al., 2011).
Recent studies have clearly shown that climate has been changing in last decades and that this trend will not only persist but will also intensify in the near future (Solomon et al., 2007). Climate changes are expected to have an impact especially on those areas whose economy mainly relies on agricultural activities; here, they are expected to exert additional pressure on the economy and, as a result, act as pushing factors for population movements (Kubik and Maurel, 2016). Despite the growing acknowledgement that en-vironment is becoming increasingly important in explaining large-scale movements of migrants (Myers and Kent, 1995; Myers, 1997), understanding the association between migrations flows and changes in climate conditions remains a challenging task, especially in developing countries.
Research has also shown that adverse climate conditions have not always the same consequences on human migration across different populations or different countries. Most of these studies are based on a micro approach (e.g., Msigwa and Mbongo, 2013; Ocelloet al., 2015; Wajdi et al., 2017); that is, they focus on the individual migrating
unit (person, group or household) and study how climate conditions, in addition to in-dividual characteristics, influence the decision of the potential migrant to remain in the current location or move. For example, more vulnerable individuals, those with low educational levels or living in deprived economic conditions, cannot afford a (long dis-tance) migration. For these people, migration can difficultly become a coping strategy in case of adverse environmental shocks, with an increased risk to remain trapped in a situation that further undermines their already fragile economic livelihoods (Nawrotzki and DeWaard, 2018).
In other cases, heterogeneity in the association between climate conditions and mi-gration is linked to the different vulnerability of places, rather than individuals. In these cases, analyses considering a macro perspective are needed as they allow to study aggre-gated migration flows and, in turn, understand the relation between migration, envi-ronmental conditions, and objectively-determined characteristics. These include popu-lation size and economic descriptors of the departure and arrival territories. Findings from research following a macro approach support the hypothesis that disparities in the development of countries or regions (for example in terms of wealth, unemploy-ment, educational attainunemploy-ment, urbanisation, etc.) are important factors in pushing or pulling migration (e.g., Wajdiet al., 2017; Flahaux and De Haas, 2016). As for individu-als, also places may differ in their vulnerability to climate changes. Nevertheless, there is still little research on the macro characteristics that might help overcome mobility constraints and reduce climate vulnerability of populations (Nawrotzki and DeWaard, 2018). When the individual disadvantage sums up to the contextual disadvantage, the chance to improve individual living conditions drastically reduces. In these situations, an environmental shock may increase the risk to trap individuals and create a humani-tarian emergency.
2.2. Correlates of migration
The decision to migrate, and where to migrate, is a complex process and the final result may depend both on individual and contextual characteristics. Here, we focus only on the latter, in the specific frame of developing countries. Generally speaking, some characteristics of the area of origin may encourage out-migration or inhibit in-migration (the so-called push factors), while other characteristics of the area of destination may encourage in-migration or discourage out-migration (the so-called pull factors). See e.g., Greenwood (1997), Bunea (2012), and Bodvarsson and Van den Berg (2013).
The attractiveness of an area is expected to be higher where the income prospects of potential migrants are higher. Specifically, migration has been found to be positively related to a higher level of economic development in the region of destination (Beine et al., 2016), measured for example by the income per capita or the GDP per capita. At the same time, the level of affluence and development, both at individual and area level, represents a central push factor. People migrate if they have resources and determina-tion to do it; those with better socio-economic condidetermina-tions are overrepresented among
international migrants (and even more among intercontinental migrants) while people with fewer resources tend to move towards neighbouring countries or internally (Fla-haux and De Haas, 2016). Adams (1969) found that people are simply attracted by more industrialised areas. Moreover, the availability of job opportunities, measured, for in-stance, by the unemployment rate, increases the probability that the potential migrant will find a job at the destination within a given period of time and, in turn, the attrac-tiveness of the area (Todaro, 1969). Also, the level of educational attainment in a region is expected to have a positive effect for the destination: an area with a high level of ed-ucated inhabitants is expected to have a good level of higher-education facilities, to be highly developed, with a better occupational structure, and, also, to have better social and cultural amenities.
Among the push factors, climatic and environmental factors have been found to have heterogeneous impacts across countries. Area characteristics may increase or reduce the vulnerability of individuals and their possibility to afford migration as a coping strat-egy. For example, urbanisation might mitigate the effect of climatic factors on migra-tion (Marchioriet al., 2012). Indeed, research has found effects that can be different for internal or international migrations (Gray and Mueller, 2012). Moreover, in some cases, policies may affect the relationship between migration and environmental shocks, for example through tightening of credit constraints (e.g., Findley, 1994). Most authors did not find a direct effect of climatic and environmental conditions on migration; rather, they proved the existence of indirect effects operating through economic drivers which themselves affect migration, such as wages, agricultural productivity, industrial output, and investment (Dellet al., 2012; Beine et al., 2016). Some studies focused on the effects of droughts on migration. Most of them reveals that they act as pushing factors, even thought some exceptions are present (see Gray and Mueller, 2012). The impact of envi-ronmental and climatic factors on migration can be more severe in poor countries (or regions), or in those areas mainly depending on agriculture and/or lacking resources to invest in the technologies required to face adverse environmental conditions (Lybbert and Sumner, 2012; Mastrorilloet al., 2016). Kubik and Maurel (2016) found that weather shocks have a significant negative impact on crop production; as a consequence, this in-creases the probability of migration for those households whose income highly depends on agriculture. However, they also found that only households in the middle of the wealth distribution can react to a weather shock by spatially diversifying their income sources.
Together with the push and the pull factors, the costs of moving can also affect the decision of where moving. Closer areas, especially those sharing a border, generally have significantly lower costs than farther areas. These costs may be primarily ascribed to the increased costs of transportation, but also to cultural and language aspects (Kim and Cohen, 2010; Beineet al., 2016; Wajdi et al., 2017).
3. DATA AND METHODS
3.1. Tanzania National Panel Survey
Tanzania National Panel Survey (TZNPS) is a longitudinal survey carried out in Tan-zania between October, 2008 and January, 2016. The survey collects information on a wide range of topics, including agricultural production, non-farm income generating ac-tivities, consumption expenditures, and other socio-economic features, with the aim of monitoring poverty dynamics in the country. The survey is made up by three different questionnaires: (i) the Household Questionnaire, which collects information on house-holds, economic conditions (expenditures, loans and credits, crimes and justice, etc.) and on education, labour, and health conditions of household members; (ii) the Agri-culture Questionnaire, which collects information on household’s agricultural activities in terms of production and sales; (iii) the Community Questionnaire, which provides information on physical and economic infrastructure and events in surveyed communi-ties. The first wave of the survey (from October, 2008 to September, 2009) entails 3, 265 households; the second (from October, 2010 to November, 2011) and the third (from October, 2012 to November, 2013) entail 3, 924 and 5, 010 households, respectively. At the last wave (from October, 2014 to January, 2016), 3, 352 households were involved in the study. In the following, we will focus on data from the household questionnaire coming from the third wave of the survey (2012/2013), that is, that providing the largest sample size.
In this paper, our aim is that of analysing the effect of area-level characteristics on household’s inter-district migration in Tanzania, considering environmental and socio-economic features of both the district of origin and destination which may also have an impact on migration movements. While the survey is not specifically designed to this aim, information on household’s movements may be easily derived. In particular, com-bining information on the household’s district of residence with the answer provided by the household’s head to the Household Questionnaire item “For how many years have you lived in this community?”, we derived a migration variable at the household level. In general, a migrant is defined as a person aged 15 or more who moved from one district to another one in the four years prior to the interview. Furthermore, answers provided to the item “From which district did you move?” were employed to obtain information on the origin of the migration movement. Last, by aggregating these data at the district level, we were able to build a migration variable,Mi j, which counts the number of households migrating between districti and j during the four years prior to the interview, withi, j= 1,..., n, and j 6= i.
Information on perceived adverse environmental conditions in the different Tanza-nian districts were obtained by aggregating information at the district level from the section of the Household Questionnaire on recent shocks experienced by the house-hold. Eighteen different types of shocks are listed in the questionnaire; we focused on those directly related to the environment, namely “droughts or floods”, “crop diseases or pests”, and “severe water shortage”. Information on the time the shock was
experi-enced was available; based on this, we excluded all migrations occurred after the shock. Given the scarcity of information on contextual socio-economic characteristics at the district level from external databases, we decided to derive such information directly from the TZNPS. Based on previous theoretical and empirical literature (see e.g., Still-well, 2005), we built some indicators describing the social-economic conditions of the Tanzanian districts. In particular, for each indicator, we considered the baseline level at the first wave of the survey (i.e., 2008/2009) and the variation registered between the third (2012/2013) and the first (2008/2009) wave.
In preliminary analyses, we tested a large set of indicators. At the end, we focused on the following district-level variables: percentage of people living in urbanised areas, percentage of house-owners, percentage of unemployed people, educational level, and wealth. The latter two variables were obtained as follows. The educational status at the individual level was measured via a categorical variable. The categoryno education or primary corresponds to no more than 6 years of schooling; the category lower-secondary education corresponds to no more than 11 years of schooling; last, secondary education or higher identifies those individual who attended more than 11 years of schooling. To obtain information at the district level, we computed the percentage of people with secondary or higher education. The wealth variable was obtained by considering five different household facilities, i.e. owning a toilet, electricity, running water, a refrigera-tor, and a TV (see e.g., Nawrotzki and DeWaard, 2018). Information at the district level were obtained by computing the percentage of households owning at least three of these facilities in their own house. In our analysis, we considered data onn= 126 Tanzanian districts for which we have information both at the first and third wave of the survey.
3.2. A gravity-type model for migration flows across Tanzanian districts
The use of gravity models represents a well-established practice in the economic litera-ture. Recently, thanks to the enhanced availability of migration data, this class of models has attracted researcher’s interest also for the analysis of migration flows. The traditional gravity model, as introduced by Zipf (1946), is based on the works by Ravenstein (1885) on migration theory which state that the volume of migration is directly proportional to the population of origin and destination and inversely proportional to the distance existing between the two areas. In particular, the more populated a given area, the higher its capacity to send (respectively, attract) emigrants (respectively, immigrants). On the other hand, according to Wajdiet al. (2017), the expected negative effect of the distance between the area of origin and destination may be linked to physical costs of migration and, to some extent, also to non-physical costs, such as language and cultural barriers.
Let us denote byMi jthe total number of recorded migrants between districti and j . Furthermore, letPiandPjdenote the corresponding population size, and letdi jdenote
the distance between districtsi and j . The basic gravity model is defined as follows: Mi j= g ×P β1 i P β2 j dβ3 i j , (1)
whereβ1,β2, andβ3are the parameters summarising the effect ofPi,Pj, anddi j on
Mi j, and g is a constant term. The popularity of this simple model was undoubtedly related to the ease with which it can be estimated by ordinary least squares after a trans-formation into logarithmic form:
logMi j= β0+ β1logPi+ β2logPj+ β3logdi j+ εi j,
whereεi jdenotes a zero mean, Gaussian, error term andβ3is expected to have negative sign. However, the restrictive assumptions upon which the log-normal model in the equation above is built have led researchers to consider more elaborated specifications; see, e.g., Greenwood (1997) for a comprehensive review of modelling internal migration flows and propensities to migrate via extended gravity-type models.
In this paper, we explore two extensions of the model above. First, according to Flowerdew and Aitkin (1982) and Flowerdew (1991, 2010), we assume that migration flows follow a Poisson distribution, rather than a log-normal one; second, together with the basic variables measuring the total population of origin and destination and the dis-tance between districts, we consider in the model specification additional explanatory variables on perceived adverse environmental conditions by Tanzanian households. As stated above, the aim is that of investigating the potential impact that climate changes have on inter-district migration in Tanzania. Clearly, as socio-economic and territorial features may also have an impact on internal migration movements, we also include in the model a number of other explanatory variables that allow us to control for such fea-tures. In this framework, we model migration movements between Tanzanian districts according to the following extended gravity-type regression model:
logMi j= β0+ β1Pi+ β2Pj+ β3di j+ β4ci j+ x0iγ1+ xjγ2+ w0iφ1+ w0jφ2,
where xiand xjdenote the vector of environmental covariates for the district of origin and of destination, respectively, andγ1andγ2the corresponding vectors of parameters.
We focused on three environmental shock variables. For each district, we considered the number of households in the survey indicating to have been affected by (i) droughts or floods, (ii) crop diseases or pests, (iii) severe water shortage. On the other hand, wi and wj denote the vector of socio-economic covariates, withφ1andφ2summarizing the corresponding effects on the (log-transformed) responseMi j. Last, to control for migration costs which may influence population movements, we consider in the model a contiguity variable,ci j, that takes value 1 if districtsi and j share a border, 0 otherwise; β4denotes the corresponding effect.
4. RESULTS
4.1. Descriptive analysis
In this section, we present descriptive analyses of our data in order to provide a first insight on migration movements in Tanzania, highlighting differences between districts in terms of socio-economic and environmental conditions.
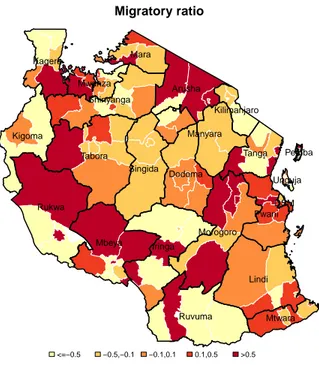
In Figure 1, we report the map of the migratory ratio distribution across Tanzanian districts referred to the period 2008/2009−2012/2013. Note that districts are delimited by white borders, while black lines are used to delimit Tanzanian regions (the adminis-trative division refers to the first wave of the survey). The migratory ratio measures the degree of attractiveness/repulsion that an area exerts to the outside and is computed as follows:
M Ri=Ii− Ei
Ii+ Ei, i= 1,..., n.
As it is clear,M Riranges in the interval[−1,1], with higher (respectively, lower) values indicating a positive (respectively, negative) balance between the registered number of immigrants and emigrants, with a consequent increase (respectively, decrease) of the population size in a given district.
Migratory ratio Arusha DSM Dodoma Iringa Kagera Kigoma Kilimanjaro Lindi Manyara Mara Mbeya Morogoro Mtwara Mwanza Unguja Pwani Rukwa Ruvuma Shinyanga Singida Pemba Tabora Tanga <=−0.5 −0.5,−0.1 −0.1,0.1 0.1,0.5 >0.5
When looking at this figure, we may observe that positive, high, values for the mi-gratory ratio (darker areas) are scattered all around the Tanzanian territory, in line with previous findings (e.g., National Bureau of Statistics Tanzania, 2015). In particular, dis-tricts belonging to the regions of Arusha, Dar Es Salaam, Rukwa (northern part of the region), Mbeya (northern part of the region), and Morogoro (northern and southern part of the region), are those attracting more migrants who decide to move within the national borders. Similar comments hold for those districts looking out onto the South shore of the Victoria Lake. Reasons pushing Tanzanians migrating to these areas are likely related to job seeking; these areas are indeed strongly devoted to agriculture and large-scale plantations (e.g., corn, rice, and coffee production), mining (e.g., kimberlite, diamonds, gold, and lead), and commercial or tourist activities. Another interesting as-pect we may observe when looking at Figure 1 is the presence of some rural-to-urban migration flows which lead Tanzanian households migrating from surroundings to the urban districts, e.g., migratory movements observed in the regions of Shinyanga and Rukwa.
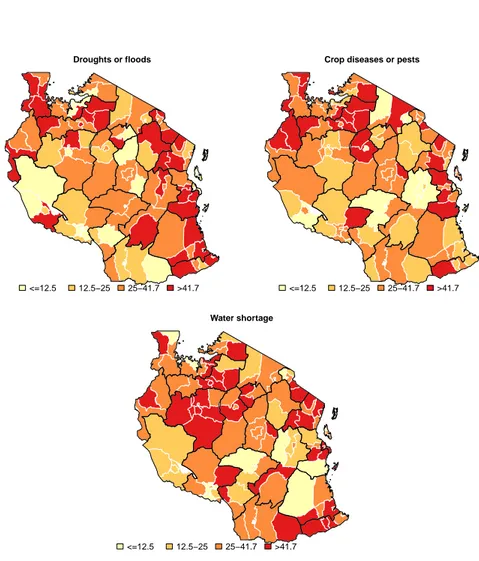
To provide information on adverse environmental conditions perceived by Tanza-nian households, we report in Figure 2 the maps highlighting the distribution across districts of the percentage of sampled households who experienced the three types of environmental shocks under investigation, in the four years prior to the interview.
When looking at these maps, we may observe that the percentage of households af-fected by the three environmental shocks under investigation is especially high for areas located on the coast of the country (districts in the regions of Pwani and Tanga) and in the adjacent region of Kilimangiaro (percentages higher than 25% for each shock). The same holds for districts in the South-East belonging to the region of Mtwara and those in the eastern part of Shinyanga. A higher concentration of family reporting to have been affected by water shortage seems to be present in the districts of Tabora region (more than the 40% of households). On the other hand, districts located in the South of Mo-rogoro and in the Lindi region present a higher percentage of households experiencing a drought or a flood in the four years prior to the interview. When comparing Figures 1 and 2, it becomes clear that lighter areas in the former (outcoming flows overtake the incoming ones) generally correspond to darker areas in the latter (higher levels of per-ceived shocks). This can somehow suggest a correlation between the decision to migrate and the environmental conditions in the area of living.
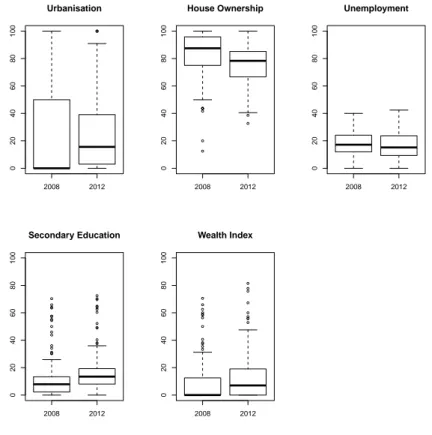
Last, we report in Figure 3 the distribution of the socio-economic variables across Tanzanian districts, at the first (2008/2009) and third (2012/2013) wave of the survey. This figure highlights the general underdeveloped conditions of the country, but also its recent improvements in all the dimensions. The distribution of the wealth index is mainly located on low values, even in 2012, suggesting that for the 75% of the districts, the percentage of Tanzanian households owning basic facilities is quite moderate. Sim-ilar conclusions may be drawn for the educational level: in the 75% of the districts, the percentage of highly educated individuals is below the 20%. On the other hand, most of the households under investigation are house-owners and the unemployment levels are rather moderate. Finally, we may observe that the distribution of the urbanisation
in-Droughts or floods
<=12.5 12.5−25 25−41.7 >41.7
Crop diseases or pests
<=12.5 12.5−25 25−41.7 >41.7
Water shortage
<=12.5 12.5−25 25−41.7 >41.7
dex is highly dispersed, suggesting that only a low number of districts has a high level of urbanisation. Nevertheless, we observe a rather consistent improvement of the urban-isation degree between the two waves of the survey we are considering. In 2008/2009, for half of the districts, the percentage of households in the sample living in a urbanised area was zero; in 2012/2013, such a percentage reaches almost the 20%.
● ● ● ● 2008 2012 0 20 40 60 80 100 Urbanisation ● ● ● ● ● ● ● ● ● 2008 2012 0 20 40 60 80 100 House Ownership 2008 2012 0 20 40 60 80 100 Unemployment ● ● ● ● ● ● ● ● ● ● ● ● ● ● ● ● ● ● ● ● ● ● ● ● ● ● ● ● ● ● 2008 2012 0 20 40 60 80 100 Secondary Education ● ● ● ● ● ● ● ● ● ● ● ● ● ● ● ● ● ● ● ● ● ● 2008 2012 0 20 40 60 80 100 Wealth Index
Figure 3 – Socio-economic and urbanisation variables across Tanzania districts at the first and third wave of the TZNPS.
4.2. Model results
To evaluate the role of environmental shocks on internal migration, we estimated a set of models. First, we considered a model (Model 1) including only the population size of the district of origin and of destination (in thousands), the distance, and the dummy vari-able indicating the contiguity between them. Second, we added the varivari-ables associated
to perceived environmental shocks in the district of origin and of destination (Model 2). Finally, we included also those variables describing the socio-economic context of the districts involved in the migration process (Model 3). As stated above, we accounted for both socio-economic conditions of the Tanzanian districts at the beginning of the observation period (four years before the time of the interview, i.e., 2008/2009) and pos-sible variations occurred during the observation period (i.e., 2008/2009 − 2012/2013). Model parameter estimates for those factors presenting, at least, one significant effect, are reported in Table 1. In the last lines of the table, we also report the value of the log-likelihood function, the deviance, and the AIC index (Akaike, 1973) of all three models under investigation to be used for model comparison.
Focusing on the last three lines of Table 1, we may observe that the optimal specifi-cation includes in the linear predictor both environmental and socio-economic factors. In particular, by comparing the deviance of Model 2 to that of Model 1, we obtain a likelihood ratio test (LRT) equal to 88.946 with 6 degrees of freedom; the lowp-value
(< 0.001) associated to such a statistic leads us to prefer the second (and more complex)
model specification. Similarly, when comparing Model 3 to Model 2, we obtain a LRT equal to 135.882 with 16 degrees of freedom. Once again, the lowp-value of such a test statistic (< 0.001) leads us to retain the more complex model specification including in the linear predictor the population size of the district of origin and destination, the dis-tance between them and the contiguity variable, the environmental factors, as well as the socio-economic ones. Identical conclusions can be drawn when looking at the AIC values reported in the last line of Table 1. Based on these findings, we will discuss in the following only results obtained under Model 3.
By looking at the estimates derived under the optimal model specification, we may firstly observe that the larger the population of destination, the bigger the migration flow, whereas, the population of origin is not significantly linked to migratory move-ments. According to the standard theory behind gravity-type models, detachment dis-courages movement, both in terms of distance and contiguity between districts (coeffi-cients equal to -0.428 and 1.562, respectively); that is, when Tanzanian inhabitants decide to migrate towards other Tanzanian areas, they generally tend to prefer closer districts and, especially, the adjacent ones.
As for environmental factors of the origin area, we found that crop diseases or crop pests are the most important factors in determining internal migrations. The higher the percentage of households experiencing such a shock, the higher the chance for them to migrate (coefficient equal to 0.060). Water shortage does not seem play a significant role in the decision to migrate (coefficient not statistically significant at 5%), even though the sign of such estimates leads to similar conclusions as those detailed above.
As regards the estimated effects for the district of destination, results highlight that the higher the percentage of households experiencing droughts or floods in a given dis-trict, the lower the likelihood for a household to migrate towards such a district (coeffi-cient equal to -0.056). On the other side, crop-related shocks seem to be positively asso-ciated with incoming migratory flows (coefficient equal to 0.031). Such a finding may be possibly related to the focus of this study which entails internal migrations only, and
Table 1
Estimates, standard errors, and p-values of model parameters under different model specifications.
Model 1 Model 2 Model 3
Estimate p-value Estimate p-value Estimate p-value (Intercept) -3.530 <0.001 -3.393 <0.001 -1.711 0.019 Pi 0.007 <0.001 0.001 0.258 0.000 0.991 Pj 0.006 <0.001 0.008 <0.001 0.007 <0.001 di j -0.489 <0.001 -0.466 <0.001 -0.428 <0.001 ci j 1.367 <0.001 1.478 <0.001 1.562 <0.001 Droughts or floodsi -0.037 0.001 -0.008 0.513 Droughts or floodsj -0.069 <0.001 -0.056 <0.001
Crop diseases or pestsi 0.053 <0.001 0.060 <0.001
Crop diseases or pestsj 0.025 0.013 0.031 0.004
Water shortagei 0.040 <0.001 0.017 0.092 Water shortagej 0.022 0.022 0.015 0.150 Urbanisation 08/09i -0.001 0.736 Urbanisation 08/09j 0.007 0.040 House ownership 08/09i -0.015 0.005 House ownership 08/09j -0.006 0.223 Unemployment 08/09i -0.001 0.904 Unemployment vari 0.005 0.625 Unemployment 08/09j -0.065 <0.001 Unemployment varj -0.052 <0.001 Secondary edu 08/09i -0.003 0.687
Secondary edu vari 0.001 0.935
Secondary edu 08/09j 0.028 <0.001
Secondary edu varj 0.040 0.001
Wealth 08/09i 0.017 0.015 Wealth vari 0.008 0.334 Wealth 08/09j 0.003 0.715 Wealth varj 0.016 0.032 Log-likelihood -1393.312 -1348.839 -1280.898 Deviance 2146.191 2057.245 1921.363 AIC 2796.624 2719.678 2615.796
to the negative sign of the estimated parameter for thedi j variable. Among all possible destinations within Tanzanian borders that households may chose, they tend to prefer the closer ones; these are likely affected by similar crop-related problems as those of the area of origin.
Model parameter estimates reported in Table 1 also highlight that when people de-cide to move within the Tanzanian borders, they generally choose more urbanised areas (coefficient significant for the district of destination, 0.007, but not for that of origin). On the contrary, ownership status represents a factor that negatively influences migra-tion: the higher the percentage of households declaring to be house-owners, the lower the chance of observing a migration.
Migratory flows are lower towards districts having higher unemployment levels. This effect holds both for the baseline unemployment level and the corresponding vari-ation observed in the period of analysis (coefficients equal to -0.065 and -0.052, respec-tively). This means that Tanzanian households generally choose as destinations those districts characterized by better economic conditions, but also those where the observed improvement of such conditions in the last four years is higher. In a similar vein, when moving within the national borders, the likelihood of observing a migration is higher for districts of destination characterized by both a higher baseline educational levels (co-efficient equal to 0.028) and a higher improvement of such a condition (co(co-efficient equal to 0.040). The wealth at area level represents both a pushing and a pulling factor for migration; results of the analysis show that the higher the improvement of the wealth conditions of a district observed during the study period, the higher the number of im-migrants (coefficient equal to 0.016). Besides, flows tend to be higher from richer areas, in line with the idea that migration is also related to the development level of an area.
We also tested the effect of objective climatic variables from external databases, such as temperature and rainfall, but none of them was statistically significant. On the one side, this result may be due to the superior usefulness of subjective measures in this con-text, which better approximate the impact of a given environmental condition. On the other side, it may be due to the need of a higher level of territorial detail to capture their actual effect on individual livelihoods and gain statistical significance. Typically, such a territorial detail is not available for objective climatic information. We also consid-ered other socio-economic variables (such as the percentage of households headed by a woman, the illiteracy rate, and the proportion of male population), but, once again, they were not significant, or their effect was already captured by other variables included in the model.
5. CONCLUSIONS
In this paper, we aimed at studying migration flows across Tanzanian districts following a macro approach. Specifically, our analysis indicates that internal migration in Tanzania may be adequately modelled via a gravity-type model, where a number of environmen-tal and socio-economic factors are taken into consideration. The results of this analysis
highlight that, as expected, socio-economic characteristics of Tanzanian districts are cor-related to migration patterns, and that environmental variables are also significant. The contribution of these latter is mainly important in explaining the departure from a given district, whereas socio-economic characteristics are especially relevant in explaining the destination of the migration process. It is also worthwhile noting that the distance re-mains the most important factor in determining the district of destination, as proved by the estimated coefficients for the distance and the contiguity variables included in the model. In brief, inter-districts migrations in Tanzania are especially pushed by crop-related shocks and, in a minor way, by severe water shortage. On the other hand, inter-nal migrants generally prefer closer destinations, where they can expect to improve their social and economic situation, that is, more developed, urbanised, and higher educated areas.
It is worthwhile noting that these findings should be interpreted in the framework of internal migration in the Tanzanian context. We are only observing a selected pop-ulation who did not leave Tanzanian borders and possibly linked to subsistence farm-ing. Other movements from more developed, urbanised, and higher educated areas may be directed outside Tanzania. Both poor and rich people (may decide to) migrate: the difference is that the level of well-being and wealth (both at individual and area level) changes the aspirations and the perceptions about geographical opportunities; thus, rel-atively richer people tend to be overrepresented among large distance international mi-grants. The selectivity of migration outside Tanzania – i.e., the fact that we do not observe those who decided to move outside the country and that these individuals are very likely to differ from internal migrants – could also explain the lack of significance of some socio-economic variables we found in preliminary analyses (such as the percentage of households headed by a woman, the illiteracy rate, and the proportion of the male population).
We showed that the prospect to live in an environment which offers greater possibil-ities of education and employment represents an important factor in attracting popula-tions. In this sense, policies should put important investments in creating employment and in developing activities, infrastructures, and facilities linked to education. More-over, newly developed areas should be prepared to receive increasing migrant flows in the future. Rural-urban migration is still an important movement in the Tanzanian context. A rapid urbanisation pulled by a massive and not well-ruled migration process could lead to the phenomenon of congestion in some areas, determining their collapse or the creation of poverty traps. Policy makers should be aware of the need to go on with the development process in act in some areas, by eventually promoting new poli-cies to increase the attractiveness of the other ones.
In addition, it should be also necessary to pay attention to the development of new infrastructures and resources, to avoid the widening of disparities between regions. Poli-cies and programs should be designed to provide maintenance and assistance in loco, in order to assist people who cannot afford a departure, especially in the poorest districts. For example, policy makers could finance adaptation strategies through the provision of credit or subsidies to smallholder farmers to overcome critical phases. Agriculture
rep-resents a factor of attachment to the area of origin, and the promotion or the support to some activities, the availability of incentives, or the creation of appropriate infrastruc-tures may help overcome environmental shocks.
Finally, in this article we focused on inter-districts movements, a territorial level not often used in previous research, but which proved its usefulness in the case of Tanzania. As discussed above, in this country migration flows are generally internal, and take the form of short distance transfers, thus a more aggregated territorial level – i.e., the re-gional one – would have hidden important flows. Moreover, the use of a highly detailed territorial level has probably favoured the lecture and the interpretation of environmen-tal variables, for which the regional level is too large to capture substantial differences.
In conclusion, our analysis adds a contribution to explain inter-districts migratory flows in Tanzania. The understanding of correlates of migration, both at individual- and area-level, is necessary to understand who migrate, why people do or do not migrate, and where they go. In some situations, migration represents a coping strategy and, in this sense, it can contribute to ameliorate living standards of migrants; in other cases, people cannot afford a migration, and the decision to stay is a forced decision linked to a deprived situation. If these situations are not appropriately faced by an informed po-litical strategy, the immobility may transform to an emergency humanitarian situation.
REFERENCES
D. W. ADAMS(1969). Rural migration and agricultural development in Colombia. Eco-nomic Development and Cultural Change, 17, pp. 527–539.
A. ADEPOJU(2006). Internal and international migration within Africa. In P. KOK, D. GELDERBLOM, J. OUCHO, J.VANZYL(eds.),Migration in South and Southern Africa: Dynamics and Determinants, HSRC Press, Cape Town, South Africa, pp. 26– 46.
S. AGRAWALA, A. MOEHNER, A. HEMP, M. V. AALST, S. HITZ, J. SMITH,
H. MEENA, S. M. MWAKIFWAMBA, T. HYERA, O. U. MWAIPOPO(2003). Devel-opment and climate change in Tanzania: Focus on Mount Kilimanjaro. Tech. rep., Or-ganisation for Economic Co-operation and Development.
A. AGWANDA, H. AMANI(2014).Population growth, structure and momentum in Tan-zania. THDR 2014: Background Paper No. 7, ESRF Discussion Paper 61, Economic and Social Research Foundation.
H. AKAIKE(1973).Information theory and an extension of the maximum likelihood prin-ciple. In B. N. PETROV, F. CSAKI(eds.),Second International Symposium on Informa-tion Theory. Akadémiai Kiado, Budapest, pp. 267–281.
M. BEINE, S. BERTOLI, J. FERNÁNDEZ-HUERTASMORAGA(2016). A practitioners’ guide to gravity models of international migration. The World Economy, 39, pp. 496– 512.
M. BELL, E. CHARLES-EDWARDS(2013). Cross-national comparisons of internal mi-gration: An update of global patterns and trends. Technical paper no. 2013/1, United Nations, Department of Economic and Social Affairs, New York.
R. BLACK, D. KNIVETON, K. SCHMIDT-VERKERK (2011). Migration and climate change: Towards an integrated assessment of sensitivity. Environment and Planning A: Economy and Space, 43, no. 2, pp. 431–450.
Ö. B. BODVARSSON, H. VAN DEN BERG (2013). The Economics of Immigration. Springer, New York.
D. BUNEA(2012). Modern gravity models of internal migration. The case of Romania. Theoretical and Applied Economics, 4, pp. 127–144.
H. DEHAAS(2010).Migration and development: A theoretical perspective. International Migration Review, 44, no. 1, pp. 227–264.
H. DEHAAS(2014).Migration theory. Quo vadis? Working Paper Series, n. 10, DEMIG Project Paper 24, International Migration Institute (IMI), University of Oxford. M. DELL, B. F. JONES, B. A. OLKEN(2012). Temperature shocks and economic growth:
Evidence from the last half century. American Economic Journal: Macroeconomics, 4, pp. 66–95.
S. E. FINDLEY(1994).Does drought increase migration? A study of migration from rural Mali during the 1983–1985 drought. International Migration Review, 28, pp. 539–553. M.-L. FLAHAUX, H. DE HAAS (2016). African migration: Trends, patterns, drivers.
Comparative Migration Studies, 4, no. 1, pp. 1–25.
R. FLOWERDEW(1991). Poisson regression modelling of migration. In J. STILLWELL, P. CONGDON(eds.),Migration Models: Macro and Micro Approaches, Belhaven Press London, London, pp. 92–112.
R. FLOWERDEW(2010).Modelling migration with Poisson regression. In J. STILLWELL, O. DUKE-WILLIAMS, A. DENNETT(eds.),Technologies for Migration and Commut-ing Analysis: Spatial Interaction Data Applications, IGI Global, Hershey, PA, USA, pp. 261–279.
R. FLOWERDEW, M. AITKIN(1982). A method of fitting the gravity model based on the Poisson distribution. Journal of Regional Science, 22, pp. 191–202.
C. L. GRAY, V. MUELLER (2012). Natural disasters and population mobility in Bangladesh. Proceedings of the National Academy of Sciences, 109, no. 16, pp. 6000– 6005.
M. J. GREENWOOD(1997). Internal migration in developed countries. Handbook of Population and Family Economics, 1, pp. 647–720.
K. KIM, J. E. COHEN(2010).Determinants of international migration flows to and from industrialized countries: A panel data approach beyond gravity. International Migration Review, 44, pp. 899–932.
Z. KUBIK, M. MAUREL(2016). Weather shocks, agricultural production and migration: Evidence from Tanzania. The Journal of Development Studies, 52, pp. 665–680. E. LIWENGA, L. KWEZI, T. AFIFI (2012). “Where the rain falls” Project. Case study:
Tanzania. Results from same district, Kilimanjaro region. Report no. 6, United Nations University Institute for Environment and Human Security (UNU-EHS), Bonn. T. J. LYBBERT, D. A. SUMNER(2012).Agricultural technologies for climate change in
de-veloping countries: Policy options for innovation and technology diffusion. Food Policy, 37, pp. 114–123.
A. MAJULE, C. NGONGONDO, M. KALLANDA-SABOLA, R. LAMBOLL,
T. STATHERS, E. LIWENGA, O. NGANA (2008). Strengthening local
Agricul-tural Innovation Systems in Less and More Favoured Areas of Tanzania and Malawi to Adapt to Climate Change and Variability: Perceptions. Impacts, vulnerability and adaptation. Research Abstracts. Issue 3, Sokoine University of Agriculture.
L. MARCHIORI, J.-F. MAYSTADT, I. SCHUMACHER (2012). The impact of weather
anomalies on migration in sub-Saharan Africa. Journal of Environmental Economics and Management, 63, pp. 355–374.
M. MASTRORILLO, R. LICKER, P. BOHRA-MISHRA, G. FAGIOLO, L. D. ESTES, M. OPPENHEIMER(2016). The influence of climate variability on internal migration flows in South Africa. Global Environmental Change, 39, pp. 155–169.
R. E. MSIGWA, J. E. MBONGO(2013).Determinants of internal migration in Tanzania. Journal of Economics and Sustainable Development, 4, no. 9, pp. 28–35.
N. MYERS(1997). Environmental refugees. Population and Environment, 19, pp. 167– 182.
N. MYERS, J. KENT(1995). Environmental Exodus: An Emergent Crisis in the Global Arena. Climate Institute, Washington, DC.
NATIONALBUREAU OFSTATISTICSTANZANIA(2015). Migration and urbanization
report 2015. Tech. rep., National Bureau of Statistics, Government of the United Republic of Tanzania.
R. J. NAWROTZKI, J. DEWAARD(2018).Putting trapped populations into place: Climate change and inter-district migration flows in Zambia. Regional Environmental Change, 18, pp. 533–546.
C. OCELLO, A. PETRUCCI, M. R. TESTA, D. VIGNOLI(2015).Environmental aspects of internal migration in Tanzania. Population and Environment, 37, pp. 99–108.
C. RALEIGH, L. JORDAN, I. SALEHYAN(2008).Assessing the impact of climate change on migration and conflict. Paper commissioned by the World Bank Group for the Social Dimensions of Climate Change workshop, The World Bank, Washington, DC. E. G. RAVENSTEIN(1885). The laws of migration. Journal of the Statistical Society of
London, 48, pp. 167–235.
B. SCHOUMAKER, M.-L. FLAHAUX, C. BEAUCHEMIN, V. MAZZUCATO, P. SAKHO
(2013).Changing patterns of African migration: A comparative analysis. MAFE Work-ing Paper 18, Institut National d’Etudes Démographiques.
S. SOLOMON, D. QIN, M. MANNING, Z. CHEN, M. MARQUIS, K. AVERYT, M. TIG -NOR, H. MILLER(2007). Climate Change 2007: The Physical Science Basis. Contribu-tion of Working Group I to the Fourth Assessment Report of the Intergovernmental Panel on Climate Change. Cambridge University Press, Cambridge, United Kingdom and New York, NY, USA.
J. STILLWELL(2005).Inter-regional migration modelling: A review and assessment. Paper prepared for the 45th Congress of the European Regional Science Association, Vrije Universiteit Amsterdam, The Netherlands, 23-27 August 2005, European Regional Science Association.
M. P. TODARO(1969). A model of labor migration and urban unemployment in less developed countries. The American Economic Review, 59, pp. 138–148.
UNITED NATIONSDEVELOPMENTPROGRAM (2015). Tanzania Human
Develop-ment Report 2014. Economic Transformation for Human DevelopDevelop-ment. Tech. rep., UNDP Tanzania Office and Economic and Social Research Foundation.
N. WAJDI, S. M. ADIOETOMO, C. H. MULDER(2017).Gravity models of interregional migration in Indonesia. Bulletin of Indonesian Economic Studies, 53, pp. 309–332. G. K. ZIPF(1946). TheP1P2
D hypothesis: On the intercity movement of persons. American
Abstract
In this paper, we investigate the role of environmental factors as potential drivers of internal mi-grations in Tanzania, along with a number of socio-economic factors traditionally identified as key correlates. Climate changes are expected to exert pressure on areas which mainly rely on agricul-tural activities and, as a result, act as push factors for population movements. Yet, understanding the association between migration, environmental conditions, and objectively-determined char-acteristics of origin and destination territories remains a challenging task, especially in developing countries. In this study, we follow a macro approach and focus on migration flows across Tanza-nian districts. By implementing a gravity-type model, we analyse the potential impact of environ-mental shocks and socio-economic characteristics of both the area of origin and destination on inter-districts migration.