UNIVERSITY OF NAPLES FEDERICO II
DOCTORATEMOLECULAR MEDICINE AND MEDICAL BIOTECHNOLOGY XXXI CYCLE
INTER-INDIVIDUAL METHYLATION VARIATION AND
ITS RELATIONSHIP WITH EVOLUTION AND CANCER
Tutor Candidate
Prof. Sergio Cocozza Domenico Palumbo
COORDINATOR
INDEX
ABSTRACT ____________________________________________ 1 ABBREVIATIONS ________________________________________ 2
1. INTRODUCTION _____________________________________ 3 1.1 DNA METHYLATION __________________________________ 3 1.2 THE DIFFERENT ROLES OF THE DNA METHYLATION IN
BIOLOGICAL PROCESSES __________________________________ 4 1.3 THE INTER-INDIVIDUAL METHYLATION VARIATION __________ 5
2. AIM _________________________________________________ 7
3. MATERIALS AND METHODS _________________________ 8 3.1 EPIC DATASET PREPROCESSING _________________________ 8 3.2 TCGA DATASETS PREPROCESSING _______________________ 9 3.3 THE GENE SET ENRICHMENT ANALYSIS ___________________ 9 3.4 ANALYSIS OF ANCIENT SELECTIVE PRESSURE SIGNALS _______ 10 3.5 ANALYSIS OF RECENT SELECTIVE PRESSURE SIGNALS ________ 11 3.6 CORRELATION MATRICES OF INTER-INDIVIDUAL METHYLATION VARIATION ___________________________________________ 12 3.7 DM-CPGS ANALYSIS ________________________________ 12 3.8 STATISTICAL ANALYSES ______________________________ 12
4. RESULTS ___________________________________________ 14 4.1 THE INTER-INDIVIDUAL METHYLATION VARIATION IS
ASSOCIATED WITH CPG CLUSTER DENSITY ___________________ 14 4.2 FUNCTIONAL ANNOTATIONS OF GENES ASSOCIATED WITH
DIFFERENT INTER-INDIVIDUAL METHYLATION VARIATION ______ 18 4.3 CPGS UNDER ANCIENT SELECTIVE PRESSURE SHOW LOW MV _ 20 4.4 CPGS UNDER RECENT SELECTIVE PRESSURE SHOW LOW MV __ 22 4.5 CANCERS SHOW HIGH MV ____________________________ 24
4.6 CORRELATIONS BETWEEN MV VALUES ARE INCREASED IN CANCERS ____________________________________________ 26 4.7 DM-CPGS SHOW HIGH MV ___________________________ 27 5. DISCUSSION _______________________________________ 30 6. CONCLUSIONS _____________________________________ 36 7. ACKNOWLEDGEMENTS ____________________________ 38 8. REFERENCES ______________________________________ 39 9. LIST OF PUBLICATIONS ____________________________ 47
ABSTRACT
Background: In recent years, epigenetics has gained interest among
scientists involved in different research areas (e.g. cancer, molecular medicine, behavior, development). It is now clear that the environment influences the methylome promoting methylation variation with possible effects on both healthy and disease-related phenotypes. I studied inter-individual DNA methylation variation in healthy individuals and in cancer tissues to identify possible factors influencing this variation.
Results: Using the EPIC-Italy dataset (1 tissue, 83 males and 83
age-matched healthy females), I analyzed methylation variation values in relation to CpG cluster density and I found a strong association between them (p-value < 2.2*10-16). Furthermore, I found that genes
related to CpGs with high methylation variation values were enriched for immunological pathways; instead, those associated with low ones were enriched for pathways related to basic cellular functions. Finally, I found an association between methylation variation values and signals of both ancient (p-value < 2.2*10-16) and recent selective pressure (p-value < 1*10-4). Furthermore, using TCGA datasets (4 healthy and cancer tissues), I analyzed methylation variation correlation among different tissues and different statuses; I found that cancer tissues show increased correlation among them and higher methylation variation than healthy tissues (p-value < 2.2*10-16).
Finally, I used a linear regression model to calculate Differentially Methylated CpGs (DM-CpGs) and I found that DM-CpGs always show higher inter-individual methylation variation especially in cancer (p-value < 2.2*10-16).
Conclusion: My results indicate the presence in healthy subjects of an
intricate interplay between genetics, epigenetics and evolutionary constraints that influence the inter-individual methylation variation. Furthermore, my results show an increase of inter-individual variation in cancers.
Abstract
Abbreviations
• BLCA= Bladder Urothelial Carcinoma • BRCA= Breast invasive carcinoma
• dbPSHP= DataBase of recent Positive Selection across Human Populations
• DM-CpGs= Differentially Methylated – CpGs • DNMT= DNA methyltransferase
• GERP-RS= Genomic Evolutionary Rate Profiling - Rejected substitutions
• GSEA= Gene Set Enrichment Analysis • HCs = High-density Clusters
• ICs= Intermediate-density Clusters • KIRC= Kidney renal clear cell carcinoma • LCs= Low-density Clusters
• LIHC= Liver hepatocellular carcinoma • MV= Inter-individual methylation variation • PBMC= Peripheral blood mononuclear cells • SAM= S-adenosyl-methionine
• TCGA= The Cancer Genome Atlas • TET= Ten-Eleven-Translocation
1. INTRODUCTION 1.1 DNA methylation
Genetics is described as the field that studies the heritable changes in gene activity due to the direct alteration of the DNA code. In contrast, epigenetics studies the changes in gene activity that are not associated with any direct alteration of the DNA sequence itself (Moore et al. 2013). The epigenetic changes result from a set of, usually, reversible modifications and include: nucleic acid modification, chromatin remodeling and histone modification (Allis C, Jenuwein T, Reinberg D 2007). Methylation is one of the major epigenetic modification on DNA in almost all living organisms (Scarano et al. 2005). It usually occurs on CpGs dinucleotides, but, in many organisms and in a low percentage, it could also occur at different sites (Scarano et al. 2005). This modification consists of an addition of a methyl group (CH3) at the 5th position of the cytosine moiety (Kulis and Esteller 2010). The reaction is catalyzed by DNA methyltransferase (DNMT) family proteins in the presence of S-adenosyl-methionine (SAM) (Kulis and Esteller 2010). DNA demethylation, instead, could be obtained either passively, by the not methylation of the new strand during DNA replication, or actively, by other enzymes (e.g. Ten-Eleven-Translocation (TET) family proteins) that have not yet been completely identified (Chen and Riggs 2011). Undoubtedly, methylation main function is to regulate gene transcription according to the environmental changes and to the cell needs (Moore et al. 2013). In brief, the presence of methylation near the promoter region of a gene is usually associated with gene transcription repression; instead, the presence of methylation in gene body is correlated with activation of gene transcription (Moore et al. 2013; Yang et al. 2014). Even if its role on DNA is well characterized (Moore et al. 2013), new findings are extending its possible biological implication (e.g. cancers and transgenerational inheritance) (Jeltsch and Jurkowska 2014). Indeed, methylation and demethylation processes, the hereditability of the methylation pattern, and the implication in tumorigenesis and in
Introduction
many other diseases are still not completely known (Kulis and Esteller 2010; Moore et al. 2013).
1.2 The different roles of the DNA methylation in biological processes
Until now, methylation seems to be implicated in different biologic functions and the scientific community put a lot of effort into achieving a full knowledge of it.
Many studies pointed out the role of methylation in tissue differentiation and embryonic development (Smith and Meissner 2013) focusing on how methylation changes on DNA allow pluripotent stem cells to differentiate and develop in different organs. All the papers that study the role of methylation in X-inactivation and imprinting in the early stages of the embryonic development can be broadly included this group (Santos and Dean 2004).
Other studies focused their attention on its possible role in cancer development and tumorigenesis (Kulis and Esteller 2010). In brief, how methylation alterations could induce tumorigenesis and how it is possible, correcting them, to kill cancer cells and heal the patient. This role, as it is possible to imagine, aroused the interest of all the scientific community and much data about methylation in cancer are freely available on public databases. However, the role of methylation in the pathogenesis of the cancer is still under debate, because aberrant methylation patterns can be sometimes found as the result of the carcinogenesis and not as the cause (Scarano et al. 2005; Kulis and Esteller 2010). The most common observed DNA methylation changes in human cancer are the loss of global methylation (hypomethylation), and the addition of methylation (hypermethylation) in CpG Island regions (Pfeifer 2018). These alterations cause the inactivation of specific genes (that normally are active) and the global activation of all the others (Pfeifer 2018). Recently, many papers suggested a possible new methylation role in evolution (Jeltsch and Jurkowska 2014). The starting idea was based on evidence that methylation patterns on DNA could be transmitted through generations (Szyf 2015). The hypothesis that methylation patterns could persist across generations seems to be counterintuitive, especially considering the demethylation process that occurs during
the epigenetic reprogramming in the mammal’s embryonic development (Soubry 2015). However, despite this consideration, there is emerging evidence showing that methylation could be inherited over generations (Szyf 2015). Indeed, epigenetic changes could explain the inheritance of some parentally acquired traits that cannot be explained by Mendelian inheritance, genetic damages or DNA mutations (Soubry 2015).
In conclusion, DNA methylation seems to be involved in many biological functions and new discoveries, day by day, are expanding our overall idea about it.
1.3 The inter-individual Methylation Variation
DNA methylation as one of the principal interfaces between our genome and the environment can be invoked to explain phenotypic variations in humans (Leenen et al. 2016).
A better understanding of how methylation varies among humans is required not only for a theoretical point of view but also from a practical one (Bock et al. 2008). Undeniably, knowing the natural changes in DNA methylation among healthy people could help us to identify the boundary between healthy and deleterious variations (Bock et al. 2008). However, until now, only a few papers focused their attention on inter-individual DNA methylation variation. A reason could be that it is difficult to analyze such variable biological processes due to a large number of factors that could modify them. Indeed, also in the same population, many variables could promote methylation variation such as age, gender, stress, food intake, and health status (Zhang et al. 2011; Heyn et al. 2013; Chatterjee et al. 2015; Jones et al. 2015).
Different methods are used to evaluate the methylation status of CpGs on DNA in order to understand the amount of methylation, how it changes, and how it modifies gene transcription. One of the most used techniques is the Illumina 450K methylation array. This array allows researchers to probe hundreds of thousands of CpGs in one shot. The fluorescence signal used in the array is then converted into a number (called beta-value) that ranges from 0 (unmethylated) to 1 (methylated). Thus, most of the CpGs in a sample fall near 0 or 1.
Introduction
Figure 1 shows an example of a normal methylome (the entire set of CpGs methylation status in a sample).
Figure 1. Beta-value density plot of a normal sample. Beta-values
from 0 to 1 (x-axis) and their frequency (y-axis) are plotted.
It is possible to note that the majority of beta-values fall near to 0 or 1 but there are a good number of probes that fall in the middle range. These probes are considered partially methylated and they are usually the result of allelic methylation or strand-specific methylation (Teschendorff et al. 2013).
During years, many datasets of methylomes have been stored and made available to the scientific community. Thanks to this sharing mood, we are now able to look at the methylation status of thousands of CpGs among hundreds of people and between different populations.
2. AIM
In this thesis, I decided to explore the CpGs inter-individual methylation variation (MV) exploiting public methylation arrays data. I focused on two major aims:
1) finding whether inter-individual methylation variation is associated with evolutionary signals
2) describing inter-individual methylation variation in cancers. In particular, for the first aim, I decided to investigate the presence of ancient and recent selective pressure signals using inter and intra-species conservation measures respectively. For the second aim, I decided to assess the MV trend in cancer and in Differentially Methylated - CpGs. In detail, I analyzed the MV trend in different tissues, and between cancers and control samples. However, I also decided to achieve other minor aims: I assessed a possible MV biological role and defined its genomic context.
In conclusion, in my thesis, I explored novel factors influencing inter-individual methylation variation and underlined its biological role in healthy and not healthy tissues.
Materials and Methods
3. MATERIALS AND METHODS 3.1 EPIC dataset preprocessing
In the first part of this thesis, Illumina 450K data of 845 people from the EPIC-Italy cohort were downloaded from the GEO database (GSE51032). The entire dataset was produced at the Human Genetics Foundation (HuGeF) in Turin (Italy), and it contains raw data and normalized methylation values (beta-values) from peripheral blood cells of 188 men and 657 women (Riboli et al. 2002). All the methylation values from the EPIC dataset were normalized by the consortium using a standard routine (Riboli et al. 2002). In particular: GenomeStudio software was used for background subtraction and dye bias correction, while COMBAT software (Demetriou et al. 2013; van Veldhoven et al. 2015) was used to correct batch effects. Finally, to test if white blood cell composition could influence the inter-individual methylation variation in these data, I performed the same method described by van Veldhoven et al. 2015 (van Veldhoven et al. 2015). In brief, the CpGs that differed significantly between each individual cell type and the Peripheral blood mononuclear cells (PBMC) using the Reinius et al. dataset (GSE35069) (Reinius et al. 2012) were identified. I used a linear regression approach (limma) (Ritchie et al. 2015) on R to calculate differential methylation between CpGs with the following thresholds: p < 1e-07 and logFC > 0.05. No notable differences were assessed before and after the filtering of the 8452 CpGs influenced by the white blood cell variability. Therefore, in this thesis, I performed all the calculations without white blood cell variability correction. Four participants were excluded from the EPIC dataset due to age or sex incongruities according to J. H. Kim and colleagues (Kim et al. 2016). Finally, 83 healthy males and 83 age-matched healthy females were selected from the entire cohort (age range = 36 - 65). This subset was created to obtain a good match between genders and ages because the methylation variation could be influenced by age and sex (Zhang et al. 2011; Jones et al. 2015). Out of 485512 CpGs, 127616 were excluded from this work for two reasons: a) CpGs falling on sex chromosomes
or on SNPs and b) CpGs showing cross-reactivity or polymorphisms (Chen et al. 2013; Price et al. 2013). The standard deviation was chosen as a measure to study CpGs inter-individual methylation variation (MV). Since this thesis was specifically focused on variation, I decided to use only the CpGs with methylation values estimated in all samples. Therefore, I excluded all the CpGs with missing values. 206441 CpGs were obtained at the end of the filtering process. To obtain MV values, mean, variance and standard deviation values of all samples for each CpGs were calculated. To associate each MV value to a CpG density cluster, the association provided by Price and colleagues (Price et al. 2013) was used.
3.2 TCGA datasets preprocessing
In the second part of this thesis, Illumina 450K methylation data of four cancer tissues from TCGA were exploited. In particular, 892 methylomes for breast cancer dataset (BRCA), 430 for liver cancer dataset (LIHC), 440 for bladder cancer dataset (BLCA) and 485 for kidney cancer dataset (KIRC) were downloaded. In each dataset, cancer methylomes and healthy control methylomes are present. As previously done with the EPIC dataset, 127616 CpGs were filtered out because: falling on sex chromosomes or on SNPs, showing cross-reactivity or polymorphisms. Since this thesis was specifically focused on variation, as done before, only the CpGs with methylation values present in all samples were used and all the CpGs with missing values were not included in the analysis. Also for these datasets, mean, variation and standard deviation of each CpGs in each tissue were calculated from beta-values. The standard deviation was chosen as a measure for MV.
3.3 The Gene Set Enrichment Analysis
To explore the link between genes function and CpGs’ MV values, I performed a Gene Set Enrichment Analysis (GSEA). Only the CpGs that fell in a range of 1500 base pairs before and after the Transcription Start Site (TSS) (-1500, +1500) were selected. The resulting CpGs were linked to a gene according to Price criteria (Price
Materials and Methods
et al. 2013). Then, MV values of CpGs that were associated with the same gene were mediated. To use the GSEAPreranked module on GenePattern (Reich et al. 2006), I transformed all the MV values in a z-score using this formula:
z = ((X-µ))/σ
where z is the z-score, X is the MV value of that gene, µ is the population MV mean, and σ is the standard deviation of all the MV values. Using this linear transformation, positive and negative values were obtained and sorted from the higher to the lower. I decided to use the KEGG gene set (“c2.cp.kegg.v5.1.symbols.gmt [Curated]”) to perform the enrichment analysis. All the gene sets that were enriched, at the same time, with a nominal p-value ≤ 0.01 and with an FDR q-value ≤ 0.25 were considered statistically significant.
3.4 Analysis of ancient selective pressure signals
To evaluate the presence of ancient selective pressure, a widely accepted conservation-based method was used: Genomic Evolutionary Rate Profiling - Rejected substitutions (GERP-RS) (Cooper et al. 2005). Briefly, the GERP-RS score calculates the conservation of each nucleotide in a multi-species alignment of 35 mammals to the human genome 19 (hg19). For each DNA base, it associates a “rejected substitutions” score that ranges from a maximum of 6.18 to a minimum of -12.36. After downloading the entire GERP-RS track (GRCh37/hg19) from the UCSC database, GERP-RS scores were intersected with CpGs position using BEDTOOLS (Quinlan and Hall 2010). Thus, I obtained a GERP-RS score for each CpG of my dataset. A GERP-RS score near zero represents no substitution deficit and no signs of base conservation; instead, positive GERP-RS scores represent a substitution deficit, thus indicating that a base could be conserved. However, negative GERP-RS scores are difficult to interpret (Cooper et al. 2005). For this reason, all the CpGs that were related to a negative GERP-RS were eliminated; therefore a total number of 80098 CpGs with a GERP-RS score ≥ 0 were analyzed.
3.5 Analysis of recent selective pressure signals
To evaluate the presence of recent selective pressure a collection of different measures were used. SNPs from the DataBase of recent Positive Selection across Human Populations (dbPSHP) (Li et al. 2014) were extracted. dbPSHP contains lists of positive selected SNPs from the 1000 Genomes Project and HapMap III, defined according to the following parameters:
- Derived Allele Frequency (DAF) > 0.05
- Genotype Frequency of Homozygous Derived Allele (GFHOM1) > 0.001
- Genotype Frequency of Heterozygote (GFHET) > 0.05
- P-value cutoff of Hardy-Weinberg equilibrium (HWE2) > 0.0001 - Heterozygosity (HET) < 0.5
- Nucleotide Diversity (PI) < 0.5
- Difference of Derived Allele Frequency (DDAF) > 0.2 - Tajima’s D (TD) < 0
- Fixation Index (FST1) > 0.05
- Integrated Haplotype Score (UIHS) > 1.5
- Cross-Population Extended Haplotype Homozygosity (UXPEHH) > 1
- Cross-Population Composite Likelihood Ratio (XPCLR) > 5
Since the population contained within the EPIC dataset is composed of Italians, SNPs from populations with low genetic distance from my cohort were used. Therefore, I included in the analysis only SNPs from TSI (Tuscany, Italy) and CEU (US residents with European ancestry) populations. Since for each population two different SNP datasets exist (1000k genomes and HapMap III), they were combined, thus obtaining one final dataset for each population. CpGs placed in a range of 2000 base pairs around each filtered SNP were named as Recent Selective Pressure-CpGs (RSP-CpGs). RSP-CpGs were recognized using BEDTOOLS (Quinlan and Hall 2010). Eventually, I obtained 272 CpGs for TSI and 328 CpGs for CEU.
Because the two datasets (CEU and TSI) differ for length from the remaining CpGs (named “Not RSP-CpGs”), I also performed a bootstrapping analysis. In brief, RSP-CpGs MV values were
Materials and Methods
compared with 10000 samples of the same population size (272 CpGs for TSI and 328 CpGs for CEU), randomly extracted from the population of Not RSP-CpGs.
3.6 Correlation matrices of inter-individual Methylation Variation
To assess the MV correlations among tissues between cancer and healthy groups, the standard deviation values of the TCGA beta-values were exploited. Two different Pearson correlation matrices were produced, one for each group. Significance was tested using
corr.test function on R. In detail, a test using “Pearson's product
moment correlation coefficient” was performed on paired MV distributions. Corrplot package on R was used to draw graphs.
3.7 DM-CpGs analysis
To extrapolate DM-CpGs between cancer and healthy samples within the same tissue a linear regression approach on the CpGs was used. In particular, limma package (Ritchie et al. 2015) on R was used and the methylation beta-values were transformed in m-values using the following equation:
M=log2(β/(1-β))
where M is the transformed methylome and β is the original beta-value methylome. After limma approach, significant DM-CpGs were filtered using the following criteria: adjusted p-value < 0.01 and absolute logFC > 2. 11599 DM-CpGs in breast cancer (BRCA), 20020 in the bladder (BLCA), 5294 in the kidney (KIRC), and 19039 in the liver (LIHC) were found. To assess whether DM-CpGs have higher MV values than Not DM-CpGs, the standard deviation for each CpGs in each tissue was calculated.
All the calculations, the statistical analyses, the correlations, the plots, and the bootstrapping estimations were achieved using R statistical package version 3.2.5, with an alpha value set for p < 0.05.
Results
4. RESULTS
In this thesis, the CpGs inter-individual methylation variation (MV) was investigated in relation to evolutionary signatures, health status, genomic context, and biological function. To achieve these results, the CpGs standard deviation was used as a measure to analyze MV. Freely available Illumina 450k methylomes data from EPIC-Italy consortium on GEO (GSE51032) and four healthy and cancer methylomes data from TCGA were exploited.
4.1 The inter-individual Methylation Variation is associated with CpG cluster density
The first part of this thesis was focused on analyzing the CpGs inter-individual methylation variation in the EPIC-Italy cohort and its relation to the genomic context, the evolutionary signals, and its possible biological function (Palumbo et al. 2018). The nature of this dataset is suitable for these aims because all the samples come from one tissue (blood), are the same ethnicity (Caucasian), and information about age, sex, and health status during years is available. This information allowed me to reduce possible variation sources as ethnicity, age, sex or the health status selecting 83 males and 83 age-matched healthy females.
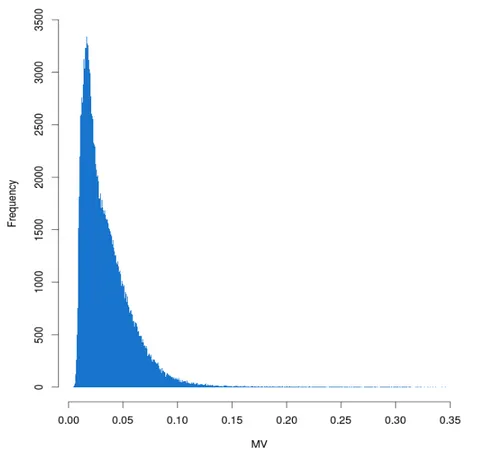
The first step was to analyze the MV trend in this reduced cohort. In Figure 2, it is possible to see the distribution of MV values in the EPIC cohort.
Figure 2. MV distribution of the 206441 CpGs of the reduced
EPIC-Italy cohort.
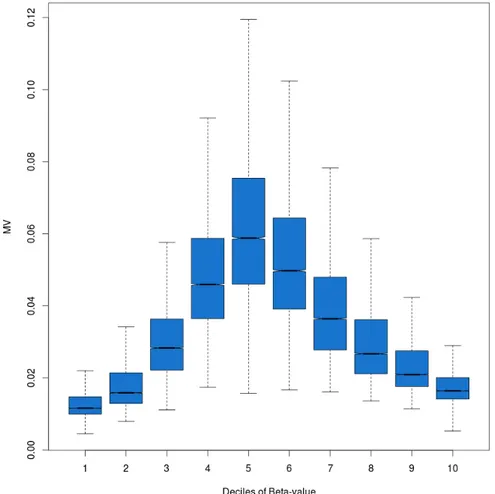
Figure 3 shows the comparison between methylation beta-values and MV values. For the latter continuous beta-values were binned in deciles.
Results
Figure 3. MV values boxplots for beta-values deciles.
I found that MV values were related to CpGs methylation levels (One-Way Test; p-value < 2.2*10-16).
In particular, CpGs with intermediate methylation levels show higher MV values, while CpGs with methylation values near the beta-value limits (0 and 1) show lower MV values.
The second step was to analyze the association between MV values and the CpGs genomic context. To fulfill this aim, MV values in relation to CpG cluster density were analyzed. The genomic regions were classified according to their CpGs content into three groups: high-density (HCs, CG content > 55%, Obs/Exp CpG ratio > 0.75 and length > 500 base pairs), intermediate-density (ICs, CG content >
50%, Obs/Exp CpG ratio > 0.48 and length > 200 base pairs) and low-density (LCs, non-HC/IC regions) as suggested by Price and colleagues (Price et al. 2013).
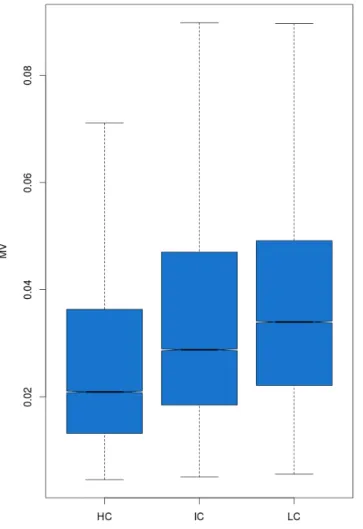
In this dataset, 61946 CpGs fall in HCs, 72496 in ICs and 71999 in LCs. Figure 4 shows the association between CpGs MV and their cluster density.
Figure 4. Boxplots of CpGs cluster density group with their MV.
I found that inter-individual methylation variation values showed a strong association with CpGs cluster density (One-Way Test, p-value
Results
< 2.2*10-16). In particular, CpGs falling in the HCs showed the lowest MV values, while, those classified as LCs showed the highest ones. Eventually, CpGs belonging to ICs showed intermediate MV values. These results, taken together, show that CpGs inter-individual methylation variation is strongly related to the surrounding genomic landscape and that the most variable CpGs in a population fall in the middle of the beta-values distribution.
4.2 Functional annotations of genes associated with different inter-individual Methylation Variation
The strong relation between genomic features and MV allowed me to consider the existence of a possible MV biological role. To achieve this aim, functional annotations of genes containing CpGs with different inter-individual methylation variation were performed. To associate each gene with an MV value, 99376 CpGs located in genomic regions of 3000 base pairs around each Transcription Start Site (TSS) were selected. This approach generated a ranked list of genes with MV values of CpGs located in their promoter regions. Furthermore, using the previously created ranked list, I performed a Gene Set Enrichment Analysis (GSEA) (Mootha et al. 2003, Subramanian et al. 2005) with KEGG pathway as gene set. GSEA results pointed out that 18 KEGG pathways are enriched (NOM p-value ≤ 0.01 and FDR q-p-value ≤ 0.25) in CpGs with high and 15 with low MV values (Table 1).
Gene set name NOM p-val FDR q-val MV
OLFACTORY TRANSDUCTION 0.000 0.000 High
GRAFT VERSUS HOST DISEASE 0.000 0.000 High
ALLOGRAFT REJECTION 0.000 0.000 High
ASTHMA 0.000 0.000 High
TYPE I DIABETES MELLITUS 0.000 0.000 High
NEUROACTIVE LIGAND RECEPTOR
INTERACTION 0.000 0.000 High
INTESTINAL IMMUNE NETWORK FOR
IGA PRODUCTION 0.000 0.001 High
METABOLISM OF XENOBIOTICS BY
CYTOCHROME P450 0.000 0.018 High
ANTIGEN PROCESSING AND
PRESENTATION 0.005 0.032 High
DRUG METABOLISM CYTOCHROME P450 0.004 0.035 High
CELL ADHESION MOLECULES CAMS 0.002 0.033 High
VIRAL MYOCARDITIS 0.009 0.033 High
COMPLEMENT AND COAGULATION
CASCADES 0.010 0.032 High
RETINOL METABOLISM 0.008 0.053 High
CYTOKINE CYTOKINE RECEPTOR
INTERACTION 0.001 0.052 High
SYSTEMIC LUPUS ERYTHEMATOSUS 0.007 0.054 High
LEISHMANIA INFECTION 0.005 0.064 High
SPLICEOSOME 0.000 0.000 Low
RNA DEGRADATION 0.000 0.000 Low
HOMOLOGOUS RECOMBINATION 0.000 0.000 Low
UBIQUITIN MEDIATED PROTEOLYSIS 0.000 0.000 Low
CELL CYCLE 0.000 0.001 Low
N-GLYCAN BIOSYNTHESIS 0.000 0.004 Low
PARKINSONS DISEASE 0.000 0.006 Low
RNA POLYMERASE 0.003 0.007 Low
LYSINE DEGRADATION 0.000 0.009 Low
HUNTINGTONS DISEASE 0.000 0.013 Low
PROTEASOME 0.004 0.018 Low
TERPENOID BACKBONE BIOSYNTHESIS 0.003 0.017 Low
OXIDATIVE PHOSPHORYLATION 0.000 0.016 Low
AMINOACYL TRNA BIOSYNTHESIS 0.000 0.015 Low
Results Table 1. The output of the Gene Set Enrichment Analysis (GSEA) for
CpGs with high or low MV.
In Table 1 shows that the CpGs with high MV values are usually associated with immunological pathways (e.g. allograft rejection, graft vs host disease, autoimmune thyroid response, diabetes I disease, etc.), while CpGs with low MV values are associated with basic cellular functions (e.g. homologous recombination, spliceosome, cell cycle, RNA degradation, etc.). These findings confirm the existence of a biological role for the inter-individual methylation variation of CpGs.
4.3 CpGs under ancient selective pressure show low MV
In order to evaluate the presence of a correlation between evolution and CpGs inter-individual methylation variation, two different types of evolutionary signatures were chosen: ancient and recent selective pressure signals. The first one is commonly detected by analyzing inter-species base conservation (Cooper et al. 2005) and the second one by analyzing intra-species SNPs conservation (Li et al. 2014). In particular, in this thesis, the Genomic Evolutionary Rate Profiling - Rejected Substitutions (GERP-RS) was chosen as signal of ancient selective pressure (Cooper et al. 2005) and a pool of measures of recent selective pressure in human population (see Materials and methods section) as signal of recent selective pressure (Li et al. 2014). GERP-RS scores near zero reveal no DNA base substitution deficit during mammals’ evolution and no conservation, while positive GERP-RS scores represent a substitution deficit and the presence of nucleotide conservation. Figure 5 shows CpGs GERP-RS values divided into quartiles and plotted with the correspondent MV value.
Figure 5. Boxplots of positive GERP-RS scores quartiles and their
relative MV.
I found the presence of an inverse relationship between GERP-RS score and MV (One-Way Test, p-value < 2.2*10-16). In brief, CpGs in genomic regions more conserved during evolution (located in the higher quartile of GERP-RS score) show the lowest level of MV among individuals.
Results 4.4 CpGs under recent selective pressure show low MV
Many different measures of recent selective pressure have been suggested (Vitti et al. 2013), but, unfortunately, none of them seems to be fully informative. To assess also the presence of recent selective pressure signals on methylation data, I decided to use an ensemble of methods able to calculate SNPs conservation among populations (Li et al. 2014).
dbPSHP database (http://jjwanglab.org/dbpshp) offers different measures combined together to assess the presence of recent selective pressure on SNPs in human populations (Li et al. 2014).
To achieve a more conservative approach, SNPs overcoming the threshold for each measure were chosen as a signal of recent selective pressure. SNPs data from other two Caucasian populations were downloaded as a reference list to assess the MV values trend of CpGs under recent selective pressure. Since recent selective signals are population specific, I selected only SNPs under recent selective pressure in TSI (Tuscans in Italy) and CEU (Utah Residents with Northern and Western Ancestry) because genetically less distant from my dataset. In particular, 124 SNPs under recent selective pressure in TSI and 135 in CEU were obtained from the dbPSHP database. For each downloaded SNP, the CpGs localized in a region of 2000 base pair around them were identified. Eventually, I identified 272 CpGs in TSI and 328 in CEU and they were named as Recent Selective Pressure CpGs (RSP-CpGs). Figure 6 shows MV values of RSP-CpGs compared to those who were not classified as recent (named as Not RSP-CpGs) in the two populations.
Figure 6. Boxplots of MV values in CpGs (blue) and Not
RSP-CpGs (red) for the two populations (TSI and CEU).
In regions under recent selective pressure (RSP-CpGs) the MV values were lower if compared with Not RSP-CpGs (RSP-CpGs TSI MV mean = 0.027, Not RSP-CpGs TSI MV mean = 0.035; RSP-CpGs CEU MV mean = 0.031, Not RSP-CpGs CEU MV mean = 0.035; Bonferroni corrected T-test analysis p-value < 1.4*10-10). Because the two datasets (CEU and TSI) differ for length from the Not RSP-CpGs datasets, I also implemented a bootstrapping analysis that confirmed the previous results (bootstrap analysis based on 10000 Monte Carlo simulations, TSI = p-value < 1*10-4, CEU = p-value < 3*10-3). Figure
7 shows the bootstrapping density plot of 10000 random resampling of MV values from the EPIC-Italy dataset. In particular, RSP-CpGs
Results
MV values were compared with 10000 samples of the same population size (272 CpGs for TSI and 328 CpGs for CEU), randomly extracted from the group of Not RSP-CpGs.
Figure 7. Bootstrapping density plot. On the x-axis is showed the MV
values, while on the y-axis the density of the distribution. Red and blue lines show CEU and TSI MV mean respectively, while red and blue curves represent the CEU and TSI random resampling distribution. P-values are indicated on the right.
To confirm that the 272 TSI RSP-CpGs were really only associated with recent and not with ancient selective pressure, a new analysis using GERP-RS score was performed. No differences were found in terms of GERP-RS scores between RSP-CpGs and Not RSP-CpGs (T-test = NS). This demonstrated that even if the two selective pressure signals showed an association with MV values, they are probably the reflection of two different phenomena.
4.5 Cancers show high MV
In the second part of this thesis, in order to explore the MV trend in cancer, methylomes data of four different cancer tissues freely available on TGCA were exploited. In particular, breast cancer dataset
(BRCA), liver cancer dataset (LIHC), bladder cancer dataset (BLCA) and kidney cancer dataset (KIRC) were used. In each dataset are present cancer methylomes and healthy control methylomes.
Usually, cancer tissues show higher genetic heterogeneity than healthy ones (Hansen et al. 2011). This phenomenon could lead to an increase in inter-individual methylation variation. To test whether this was true also in these four datasets, the MV between healthy and cancer tissues was analyzed. Figure 8 shows the distribution of MV between the cancer tissues and the corresponding healthy controls.
Figure 8. Boxplots of CpGs MV values in the different datasets. Red
Results
I found that all the cancers show higher MV than the controls (Pairwise t-test p-value < 2.2*10-16).
4.6 Correlations between MV values are increased in cancers
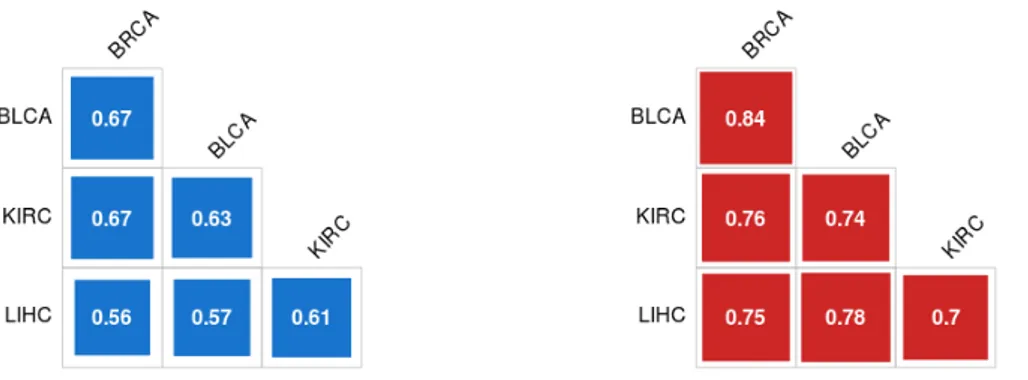
The increase in MV in all the cancer tissues could indicate that this phenomenon could be tissue independent. To test this hypothesis, an analysis of the correlations between different tissues, both in cancer and in healthy samples was performed. Figure 9 shows correlation matrices between datasets in healthy and cancer tissues.
Figure 9. Plots of the correlation matrices between MV values in
controls (blue) and cancer (red) samples. Correlation values are indicated in white in each square.
Good correlations between MVs in cancer tissues (min=0.7, max=0.84) higher than correlations in healthy ones (min=0.56, max=0.67) were found. Despite the biological differences between these tissues, the four MV distributions show a good correlation between them even in the healthy datasets. To evaluate the significance of these correlations, tests for association between paired MV distributions using “Pearson's product moment correlation coefficient” were performed. All the tests show a p-value < 2.2*10-16. These results show that, regardless of the tissue, the increase in MV leads to an increase in correlation among cancers.
4.7 DM-CpGs show high MV
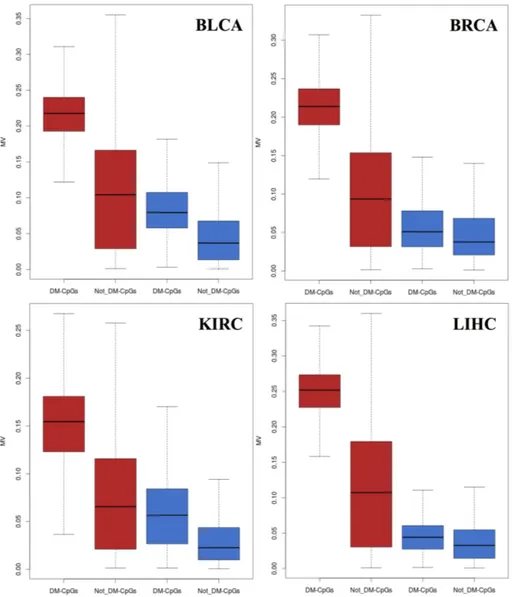
Finally, an analysis to identify Differentially Methylated - CpGs (DM-CpGs) between cancers and control samples on each dataset was performed. To identify DM-CpGs, a linear regression model on R (limma) (Ritchie et al. 2015), using m-values, with adjusted p-value < 0.01 and logFC > 2 was performed. Figure 10 shows the MV trend of the DM-CpGs in the different datasets between cancer and control samples.
Results
Figure 10. Boxplots of MV values for DM-CpGs and Not DM-CpGs
in cancer (red) and control (blue) samples. Each dataset is plotted separately.
I found that DM-CpGs, regardless of the tissue and of the status, have statistically higher MV than Not DM-CpGs (Pairwise t-test p-value < 2.2*10-16). Furthermore, even if MV differences were greater in cancer tissues than in healthy ones, DM-CpGs show higher MV than Not DM-CpGs also in the control samples. These results assess the
presence of variably methylated CpGs that, also in healthy samples, represent the most variable part of the entire set. These CpGs became DM-CpGs in cancer but, still in healthy controls, they express higher inter-individual methylation variation.
Discussion
5. DISCUSSION
Epigenetics is a field of growing interest among researchers involved in different medical areas (e.g. cell biology, molecular medicine, cancer, physiology, behavior, development, morphology).
Previous studies analyzed the DNA methylation variation in healthy individuals (Bock et al. 2008). While the presence of a stochastic component of such variation is undeniable, its relationship with demographic variables such as gender (Zhang et al. 2011), age (Jones et al. 2015), and smoking behavior (Ambatipudi et al. 2016) is well established. Similarly, it has been also demonstrated the functional impact of this variation on phenotypes (Peaston and Whitelaw 2006). DNA methylation variation has been also hypothesized to influence response to drug treatments, as well as susceptibility to common diseases (Heyn et al. 2013; Chatterjee et al. 2015). Furthermore, DNA methylation has been also described to vary between ethnicities (Zhang et al. 2011; Coit et al. 2015; Kader and Ghai 2016).
Epigenetics is also achieving a role in our understanding of natural selection and evolution. In a recent paper (Burggren et al. 2016), the authors established that about 1% of epigenetics studies were dedicated to investigating relationships with natural selection and evolution. Most of these papers treat the conservation of DNA methylation among species (Lam et al. 2012; Gokhman et al. 2014), while others treat the species-specific DNA methylation (Zeng et al. 2012).
In this thesis, I decided to focus my attention on inter-individual methylation variation (denoted as MV), because it is a not well-characterized factor that could profoundly influence methylation array results and gene transcription analyses.
In detail, in the first part, I investigated the methylation variation among healthy individuals to find its possible relationship with genomic features and evolutionary signatures (Palumbo et al. 2018). To this aim, I exploited the methylation data from the Italian section of the EPIC cohort (Riboli et al. 2002). I used beta-values previously normalized using GenomeStudio software by Illumina. I am aware that other software is now available for a more efficient
normalization. However, GenomeStudio still remains reliable and widely used by the scientific community (Pidsley et al. 2013).
I decided to use, according to previously published studies (Lam et al. 2012; Chatterjee et al. 2015; Jiang et al. 2015), the standard deviation as a measure of inter-individual methylation variation. The MV values distribution in my cohort was perfectly in agreement with that available in the literature (Chatterjee et al. 2015; Jiang et al. 2015). To find the possible relationship between inter-individual methylation variation and genomic features, I decided to exploit the CpGs cluster density. This parameter has been previously used as a suitable method to identify biologically-relevant structures (Price et al. 2013). With this approach, I found a strong relationship between MV and CpG cluster density. Indeed, HC regions showed low MV levels, while IC and LC regions showed increasingly higher levels. This result is in agreement with the current knowledge of the direct correlation between methylation levels and CpGs cluster density (Bock et al. 2008; Lam et al. 2012; Jiang et al. 2015). As said before, to date, only a few papers have focused on inter-individual methylation variation. Wagner and colleagues (Wagner et al. 2014) showed a low inter-individual methylation variation in CpGs situated near a TSS and highly variable CpGs placed far away from it. This finding is in agreement with mine because high-density CpG clusters are usually situated near a TSS (Wagner et al. 2014). A possible reason for this phenomenon could be found in the global hypomethylation of HC regions, which could cause small inter-individual methylation variations (Taudt et al. 2016). However, it should be mentioned that CpGs with the highest MV, which fall in IC and LC regions, are poorly probed by Illumina 450K array and have a propensity to fall outside the CpG Islands (Taudt et al. 2016). It has been found, in Acute Lymphoid Leukemia cells, that CpGs falling outside CpG Islands exhibit significantly more variation in methylation levels than those falling within the CpG Islands (Milani et al. 2010). Therefore, my results are consistent with the literature, because the highest number of CpGs falling outside an Island belongs to both LC or IC classes (Price et al. 2013). Eventually, also Bock and colleagues (Bock et al. 2008) demonstrated that CpGs rich regions (HC) show low and similar levels of MV while CpGs poor regions (LC) show
Discussion
high levels of MV. With this knowledge, it is possible to assert that my result is fully in agreement with the current literature.
To investigate a possible association between inter-individual methylation variation and biological pathways, I decided to use a GSEA approach. I found an enrichment of pathways associated with the immune system in highly variable CpGs, while I found an enrichment of pathways associated with basic cellular functions in CpGs with a low inter-individual variation. A previous paper studied CpGs methylation in three different human populations, showing 439 Differential Methylated CpGs (DM-CpGs) between the groups (Heyn et al. 2013). Remarkably, genes harboring these population-different CpGs in their promoters are liable for xenobiotic metabolism and immune response factors. Another recent study investigated the gene expression of blood samples acquired by 200 healthy controls, and it demonstrated that highly variable transcripts among individuals were enriched for genes mostly involved in mediating immune-related processes (Ecker et al. 2017). A possible reason for these results could be found in the biology of the blood samples. Since in these samples DNA molecules are obtained from white blood cells, it is reasonable to imagine that variable methylation signals could partly help us to face different immunological situations, with some variations between individuals. The expression of genes participating in the immune response is very variable in a population. Indeed, each individual interacts with different xenobiotics or pathogens during his life which stimulate the immune system in different ways (Lim et al. 2013). Furthermore, I also inspected the MV of CpGs that are conserved among species positing that they likely have a biologically relevant function. I discovered that CpGs more conserved during evolution showed the lowest values of MV. A recent study showed, comparing human-mouse methylation, that methylation correlates, although weakly, with sequence conservation (Xin et al. 2011). Studying the association between genetics, DNA methylation, and expression in fibroblasts, other researchers demonstrated that CpGs with low inter-individual methylation variation displayed a good degree of sequence conservation (Wagner et al. 2014). I then verified the assumption of a possible association between recent selective pressure and inter-individual methylation variation among inter-individuals of the same population. I found that inter-individual methylation variation was
lower in regions under recent selective pressure compared to the other ones. A possible explanation of this finding is that my results could indicate a recent evolutionary fixation of the methylation values. In particular, the inter-individual methylation fixation could point to both a pure epigenetic fixation or to a genetic variation associated with a specific methylation pattern (Klironomos et al. 2013). In the first scenario, it might be possible that a stochastic methylation pattern could have enhanced, somehow, the human adaptation by providing an advantageous phenotype in a specific environment. In the second scenario, it could be possible that an advantageous genetic mutation is related to a specific methylation pattern, mostly because it is the only possible one for that specific mutation. It is worth to remark that some authors demonstrated how epigenetic mechanisms can drive genetic changes (Jablonka 2013; Skinner et al. 2015), while others suggested that genetic variations could determine DNA methylation differences, and, eventually, proposed that different methylated CpGs could work as evolutionary mediators between the genetic code and the phenotypic variability (Heyn et al. 2013).
Inspired by the previous results on this topic (Palumbo et al. 2018), I decided to continue the investigation on inter-individual methylation variation trend among individuals but, this time, adding new factors: more tissues and different health status. In brief, in the second part of my thesis, I analyzed the methylation variation among healthy and not-healthy individuals in different tissues to investigate its possible relationship with the health status.
To this aim, I decided to use TCGA cancer and control methylomes of four datasets: BRCA, LIHC, BLCA, and KIRC. Each one of these datasets is composed of healthy and cancer samples; this allowed me to analyze MV differences between the two groups in all the datasets. It is well known that the health status (You and Jones 2012; Teschendorff et al. 2014; Chen et al. 2016) and the tissue (Byun et al. 2009) are important biological factors of methylation variation. To avoid any bias, the methylomes data were neither mixed together nor analyzed as one dataset due to the presence of dataset dependent confounding factors: sex, age, and ethnicity are not equally distributed among the datasets.
To assess the differences in health status among the datasets, I compared MV distribution between cancer samples and controls. As
Discussion
expected, I found a strong difference in MV distribution and all the cancer samples show higher MV than the controls regardless of the original tissue. Even if it is still unclear who is the main actor that change the methylation patterns during carcinogenesis, it is known that methylation variation is increased in cancers (You and Jones 2012; Teschendorff et al. 2014; Chen et al. 2016).
Indeed, Chen and colleagues (Chen et al. 2016), using fetal tissues, found tissue-independent patterns of DNA methylation in cancers especially in CpG Island, gene promoters and gene bodies. Instead, Teschendorff and colleagues (Teschendorff et al. 2014) demonstrated an increase in variation and co-variation of DNA methylation in normal cells transforming in cancer cells. Taken together, these studies are in accordance with my result: cancers show an increase in inter-individual methylation variation in a tissue-independent manner. As proposed by Chen (Chen et al. 2016), I decided to assess whether a global increase in MV could lead also in an increase in MV correlation among tissues in the two groups (cancer and controls). I found that cancers correlate better in MV among the tissues than the controls. The increase in correlation among cancers allows me to hypothesize the presence of a modifier factor transcending tissues. Indeed proofs of correlation between DNA context and methylation pattern were previously proposed (You and Jones 2012; Aryee et al. 2013).
Finally, I decided to test the MV trend in Differentially Methylated - CpGs (DM-CpGs). The systematic investigation of DM-CpGs or Differentially Methylated Regions (DMRs) is a common practice to detect deregulated genes in cancers (Hansen et al. 2011; Wang et al. 2017). For this aim, I used a linear regression approach (limma) (Ritchie et al. 2015) on R: a common method for detecting DM-CpGs in methylation arrays (Smyth 2005). I performed four distinct analyses on the four different tissues between control samples and cancer samples. I found, with a strong statistical significance, that DM-CpGs always show higher MV than the remaining CpGs, also in the healthy samples. This result underlines that DM-CpGs, regardless of the tissue, the sex, the age, the ethnicity, and the health status, are highly variable among individuals. This finding is in accordance with the recent work of Wang and colleagues (Wang et al. 2017) where a high inter-individual variation was found on DMRs and, to perform a
better analysis, they eventually suggest to use a new method that takes in account the MV in the dataset. Unfortunately, it is only possible to hypothesize a biological meaning of these DM-CpGs with high MV also in healthy samples. It seems that DM-CpGs are very unstable elements also before the cancer onset. DNA context, regulatory motifs, and other biological factors could be the actors of this phenomenon. However, new methods seem to deal with the problem of age and cancer variability in DMRs (Phipson and Oshlack 2014). This new awareness of the importance of inter-individual methylation variation motivates me to continue my work on this topic.
Conclusions
6. CONCLUSIONS
One of the most studied epigenetic mechanisms of gene regulation is DNA methylation. During the last decade, many researchers focused their attention on studying methylation signals among populations. This phenomenon created, over the years, many public data about DNA methylation status.
In this thesis, novel factors influencing inter-individual methylation variation (MV) were explored. In particular, evolutionary constraints, genomic landscape, biological pathways, and health status were investigated. In the first part, methylation data from EPIC-Italy cohort were used to assess MV trend in relation to evolution, genomic landscape, and its biological function. In the second part, methylation data of 4 tissues from TCGA were used to assess MV trend in relation to health status. Exploiting EPIC-Italy dataset, I found a good association between MV and CpGs cluster density. In particular, CpGs belonging to High-density CpGs (HC) group showed the lowest MV values while those belonging to Low-density CpGs (LC) group showed the highest ones. Furthermore, a GSEA approach was performed to assess the biological pathways associated with high and low MV values. Eighteen enriched pathways were found associated with high MV values and most of them are related to immunological functions. Finally, I investigated both signals of ancient and recent selective pressure in relation to MV. I found a strong association between MV and signals of both ancient and recent selective pressure. Indeed, CpGs under ancient or recent selective pressure show lower MV than the remaining ones.
In the second part of this thesis, the MV trend in relation to health status was assessed. I found that, regardless of the tissue, cancers samples always show higher MV than control ones and this phenomenon leads to an increase in correlation among cancer tissues. Furthermore, analyzing Differentially Methylated - CpGs (DM-CpGs) between cancer and control samples in each tissue, I found, surprisingly, that the DM-CpGs always show higher MV than the Not DM-CpGs, regardless of the tissue and of the health status.
In brief, I demonstrated that inter-individual methylation variation is correlated with many biological factors. According to me, a better
investigation of all possible influencing factors is required to fully understand the hidden epigenetic mechanisms of gene regulation. In particular, the last result paves the way to a better comprehension of the role of the DM-CpGs in cancer.
Acknowledgements
7. ACKNOWLEDGEMENTS
I would like to express my gratitude to Professor Cocozza, my research supervisors, for his patient guidance, enthusiastic encouragement and useful critiques about this work. I would also like to thank Dr. Monticelli, for her advice and assistance during these years. My grateful thanks are also extended to Dr. Affinito for helping me switching from bench lab to desktop and to Dr. Scala for introducing me to Bioinformatics. These years would have been unbearable without your presence and your help.
I wish also to thank my parents for their support and encouragement throughout my studies.
Finally, I would like to express my deep gratitude and say sorry to my girlfriend who tolerated my continuous absence during these three years.
8. REFERENCES
Allis C, Jenuwein T, Reinberg D. 2007. Epigenetics. 1st ed. Allis C, Jenuwein T RD, editor. Cold Spring Harbor, N.Y.: Cold Spring Harbor Laboratory Press.
Ambatipudi S, Cuenin C, Hernandez-Vargas H, Ghantous A, Le Calvez-Kelm F, Kaaks R, Barrdahl M, Boeing H, Aleksandrova K, Trichopoulou A, et al. 2016. Tobacco smoking-associated genome-wide DNA methylation changes in the EPIC study. Epigenomics 8:599–618.
Aryee MJ, Liu W, Engelmann JC, Nuhn P, Gurel M, Haffner MC, Esopi D, Irizarry RA, Getzenberg RH, Nelson WG, et al. 2013. DNA methylation alterations exhibit intraindividual stability and interindividual heterogeneity in prostate cancer metastases. Sci. Transl. Med. 5.
Bock C, Walter J, Paulsen M, Lengauer T. 2008. Inter-individual variation of DNA methylation and its implications for large-scale epigenome mapping. Nucleic Acids Res. 36.
Burggren W, O ’callaghan C, Finne J, Torday JS. 2016. Epigenetic Inheritance and Its Role in Evolutionary Biology: Re-Evaluation and New Perspectives. Biology (Basel). 4:22.
Byun HM, Siegmund KD, Pan F, Weisenberger DJ, Kanel G, Laird PW, Yang AS. 2009. Epigenetic profiling of somatic tissues from human autopsy specimens identifies tissue- and individual-specific DNA methylation patterns. Hum. Mol. Genet. 18:4808–4817.
References
RJ, Morison IM. 2015. Genome-wide DNA methylation map of human neutrophils reveals widespread inter-individual epigenetic variation. Nat. Publ. Gr.:1–16.
Chen YA, Lemire M, Choufani S, Butcher DT, Grafodatskaya D, Zanke BW, Gallinger S, Hudson TJ, Weksberg R. 2013. Discovery of cross-reactive probes and polymorphic CpGs in the Illumina Infinium HumanMethylation450 microarray. Epigenetics 8:203–209.
Chen Y, Breeze CE, Zhen S, Beck S, Teschendorff AE. 2016. Tissue-independent and tissue-specific patterns of DNA methylation alteration in cancer. Epigenetics and Chromatin 9:1–11.
Chen Z, Riggs AD. 2011. DNA methylation and demethylation in mammals. J. Biol. Chem. 286:18347–53.
Coit P, Ognenovski M, Gensterblum E, Maksimowicz-McKinnon K, Wren JD, Sawalha AH. 2015. Ethnicity-specific epigenetic variation in naïve CD4+ T cells and the susceptibility to autoimmunity. Epigenetics Chromatin 8:49.
Cooper GM, Stone EA, Asimenos G, Green ED, Batzoglou S, Sidow A. 2005. Distribution and intensity of constraint in mammalian genomic sequence. Genome Res. 15:901–913.
Demetriou CA, Chen J, Polidoro S, Van Veldhoven K, Cuenin C, Campanella G, Brennan K, Clavel-Chapelon F, Dossus L, Kvaskoff M, et al. 2013. Methylome analysis and epigenetic changes associated with menarcheal age. PLoS One 8.
Ecker S, Chen L, Pancaldi V, Bagger FO, Fernández JM, Carrillo de Santa Pau E, Juan D, Mann AL, Watt S, Casale FP, et al. 2017. Genome-wide analysis of differential transcriptional and epigenetic
variability across human immune cell types. Genome Biol. 18:18. Gokhman D, Lavi E, Prüfer K, Fraga MF, Riancho JA, Kelso J, Pääbo S, Meshorer E, Carmel L. 2014. Reconstructing the DNA Methylation. Science (80-. ). 344:523–528.
Hansen KD, Timp W, Bravo HC, Sabunciyan S, Langmead B, McDonald OG, Wen B, Wu H, Liu Y, Diep D, et al. 2011. Increased methylation variation in epigenetic domains across cancer types. Nat. Genet. 43:768–775.
Heyn H, Moran S, Hernando-Herraez I, Sayols S, Gomez A, Sandoval J, Monk D, Hata K, Marques-Bonet T, Wang L, et al. 2013. DNA methylation contributes to natural human variation. Genome Res. 23:1363–1372.
Jablonka E. 2013. Epigenetic inheritance and plasticity: The responsive germline. Prog. Biophys. Mol. Biol. 111:99–107.
Jeltsch A, Jurkowska RZ. 2014. New concepts in DNA methylation. Trends Biochem. Sci. 39:310–318.
Jiang R, Jones MJ, Chen E, Neumann SM, Fraser HB, Miller GE, Kobor MS. 2015. Discordance of DNA Methylation Variance Between two Accessible Human Tissues. Sci. Rep. 5:8257.
Jones MJ, Goodman SJ, Kobor MS. 2015. DNA methylation and healthy human aging. Aging Cell 14:924–932.
Kader F, Ghai M. 2016. DNA methylation-based variation between human populations. Mol. Genet. Genomics 292:1–31.
References
Kim JH, Park J, Kim S. 2016. Non-negligible Occurrence of Errors in Gender Description in Public Data Sets. Genomics Inform. 14:34. Klironomos FD, Berg J, Collins S. 2013. How epigenetic mutations can affect genetic evolution: Model and mechanism. BioEssays 35:571–578.
Kulis M, Esteller M. 2010. DNA Methylation and Cancer. In: Advances in genetics. Vol. 70. p. 27–56.
Lam LL, Emberly E, Fraser HB, Neumann SM, Chen E, Miller GE, Kobor MS. 2012. Factors underlying variable DNA methylation in a human community cohort. Proc. Natl. Acad. Sci. 109:17253–17260. Leenen FAD, Muller CP, Turner JD. 2016. DNA methylation: conducting the orchestra from exposure to phenotype? Clin. Epigenetics 8:1–15.
Li MJ, Wang LY, Xia Z, Wong MP, Sham PC, Wang J. 2014. DbPSHP: A database of recent positive selection across human populations. Nucleic Acids Res. 42:910–916.
Lim PS, Li J, Holloway AF, Rao S. 2013. Epigenetic regulation of inducible gene expression in the immune system. Immunology 139:285–293.
Milani L, Lundmark A, Kiialainen A, Nordlund J, Flaegstad T, Forestier E, Heyman M, Jonmundsson G, Kanerva J, Schmiegelow K, et al. 2010. DNA methylation for subtype classification and prediction of treatment outcome in patients with childhood acute lymphoblastic leukemia. Child. A Glob. J. Child Res. 115:1214–1225.
function. Neuropsychopharmacology 38:23–38.
Mootha VK, Lindgren CM, Eriksson K, Subramanian A, Sihag S, Lehar J, Puigserver P, Carlsson E, Ridderstråle M, Laurila E, et al. 2003. PGC-1α-responsive genes involved in oxidative phosphorylation are coordinately downregulated in human diabetes. 34:267–273.
Palumbo D, Affinito O, Monticelli A, Cocozza S. 2018. DNA Methylation variability among individuals is related to CpGs cluster density and evolutionary signatures. BMC Genomics 19:229.
Peaston AE, Whitelaw E. 2006. Epigenetics and phenotypic variation in mammals. Mamm. Genome 17:365–374.
Pfeifer G. 2018. Defining Driver DNA Methylation Changes in Human Cancer. Int. J. Mol. Sci. 19:1166.
Phipson B, Oshlack A. 2014. DiffVar: a new method for detecting differential variability with application to methylation in cancer and aging. Genome Biol. 15:465.
Pidsley R, Y Wong CC, Volta M, Lunnon K, Mill J, Schalkwyk LC. 2013. A data-driven approach to preprocessing Illumina 450K methylation array data. BMC Genomics 14:293.
Price ME, Cotton AM, Lam LL, Farré P, Emberly E, Brown CJ, Robinson WP, Kobor MS. 2013. Additional annotation enhances potential for biologically-relevant analysis of the Illumina Infinium HumanMethylation450 BeadChip array. Epigenetics Chromatin 6:4. Quinlan AR, Hall IM. 2010. BEDTools: A flexible suite of utilities for comparing genomic features. Bioinformatics 26:841–842.
References
Reich M, Liefeld T, Gould J, Lerner J, Tamayo P, Mesirov JP. 2006. GenePattern 2.0. Nat. Genet. 38:500–1.
Reinius LE, Acevedo N, Joerink M, Pershagen G, Dahlén S-E, Greco D, Söderhäll C, Scheynius A, Kere J. 2012. Differential DNA Methylation in Purified Human Blood Cells: Implications for Cell Lineage and Studies on Disease Susceptibility. Ting AH, editor. PLoS One 7:1–13.
Riboli E, Hunt K, Slimani N, Ferrari P, Norat T, Fahey M, Charrondière U, Hémon B, Casagrande C, Vignat J, et al. 2002. European Prospective Investigation into Cancer and Nutrition (EPIC): study populations and data collection. Public Health Nutr. 5:1113– 1124.
Ritchie ME, Phipson B, Wu D, Hu Y, Law CW, Shi W, Smyth GK. 2015. Limma powers differential expression analyses for RNA-sequencing and microarray studies. Nucleic Acids Res. 43:e47.
Santos F, Dean W. 2004. Epigenetic reprogramming during early development in mammals. Reproduction 127:643–651.
Scarano MI, Strazzullo M, Matarazzo MR, D’Esposito M. 2005. DNA methylation 40 years later: Its role in human health and disease. J. Cell. Physiol. 204:21–35.
Skinner MK, Guerrero-Bosagna C, Haque MM. 2015. Environmentally induced epigenetic transgenerational inheritance of sperm epimutations promote genetic mutations. Epigenetics 10:762– 771.
Smith ZD, Meissner A. 2013. DNA methylation: roles in mammalian development. Nat. Rev. Genet. 14:204–220.
Smyth GK. 2005. limma: Linear Models for Microarray Data. In: Bioinformatics and Computational Biology Solutions Using R and Bioconductor. New York: Springer-Verlag. p. 397–420.
Soubry A. 2015. Epigenetic inheritance and evolution: A paternal perspective on dietary influences. Prog. Biophys. Mol. Biol. 118:79– 85.
Szyf M. 2015. Nongenetic inheritance and transgenerational epigenetics. Trends Mol. Med. 21:134–144.
Taudt A, Colomé-Tatché M, Johannes F. 2016. Genetic sources of population epigenomic variation. Nat. Rev. Genet. 17:319–332. Teschendorff AE, Liu X, Caren H, Pollard SM, Beck S, Widschwendter M, Chen L. 2014. The Dynamics of DNA Methylation Covariation Patterns in Carcinogenesis. PLoS Comput. Biol. 10.
Teschendorff AE, Marabita F, Lechner M, Bartlett T, Tegner J, Gomez-Cabrero D, Beck S. 2013. A beta-mixture quantile normalization method for correcting probe design bias in Illumina Infinium 450 k DNA methylation data. Bioinformatics 29:189–196. van Veldhoven K, Polidoro S, Baglietto L, Severi G, Sacerdote C, Panico S, Mattiello A, Palli D, Masala G, Krogh V, et al. 2015. Epigenome-wide association study reveals decreased average methylation levels years before breast cancer diagnosis. Clin. Epigenetics 7:67.
Vitti JJ, Grossman SR, Sabeti PC. 2013. Detecting Natural Selection in Genomic Data. Annu. Rev. Genet 47:97–120.
References
Wagner JR, Busche S, Ge B, Kwan T, Pastinen T, Blanchette M. 2014. The relationship between DNA methylation, genetic and expression inter-individual variation in untransformed human fibroblasts. Genome Biol. 15:R37.
Wang Y, Teschendorff AE, Widschwendter M, Wang S. 2017. Accounting for differential variability in detecting differentially methylated regions. Brief. Bioinform. 4:24.
Xin Y, O’Donnell AH, Ge Y, Chanrion B, Milekic M, Rosoklija G, Stankov A, Arango V, Dwork AJ, Gingrich JA, et al. 2011. Role of CpG context and content in evolutionary signatures of brain DNA methylation. Epigenetics 6:1308–1318.
Yang X, Han H, DeCarvalho DD, Lay FD, Jones PA, Liang G. 2014. Gene body methylation can alter gene expression and is a therapeutic target in cancer. Cancer Cell 26:577–590.
You J, Jones P. 2012. Cancer Genetics and Epigenetics : Two Sides of the Same Coin ? Cancer Cell 22:9–20.
Zeng J, Konopka G, Hunt BG, Preuss TM, Geschwind D, Yi S V. 2012. Divergent whole-genome methylation maps of human and chimpanzee brains reveal epigenetic basis of human regulatory evolution. Am. J. Hum. Genet. 91:455–465.
Zhang FF, Cardarelli R, Carroll J, Fulda KG, Kaur M, Gonzalez K, Vishwanatha JK, Santella RM, Morabia A. 2011. Significant differences in global genomic DNA methylation by gender and race/ethnicity in peripheral blood. Epigenetics 6:623–629.
9. LIST OF PUBLICATIONS
Palumbo D, Affinito O, Monticelli A, Cocozza S. 2018. DNA Methylation variability among individuals is related to CpGs cluster density and evolutionary signatures. BMC Genomics. 19(1). doi:10.1186/s12864-018-4618-9.
Coretti L, Cuomo M, Florio E, Palumbo D, Keller S, Pero R, Chiariotti L, Lembo F, Cafiero C. 2017. Subgingival dysbiosis in smoker and non-smoker patients with chronic periodontitis. Molecular Medicine Reports. 15(4):2007-2014. doi:10.3892/mmr.2017.6269. Affinito O, Scala G, Palumbo D, Florio E, Monticelli A, Miele G, Avvedimento VE, Usiello A, Chiariotti L, Cocozza S. 2016. Modeling DNA methylation by analyzing the individual configurations of single molecules. Epigenetics. 11(12):881-888. doi: 10.1080/15592294.2016.1246108.
Scala G, Affinito O, Palumbo D, Florio E, Monticelli A, Miele G, Chiariotti L, Cocozza S. 2016. ampliMethProfiler: a pipeline for the analysis of CpG methylation profiles of targeted deep bisulfite sequenced amplicons. BMC Bioinformatics. 17(1):484. doi: 10.1186/s12859-016-1380-3.