© The Author(s) 2019. Published by Oxford University Press on behalf of the Maryland Psychiatric Research Center.
This is an Open Access article distributed under the terms of the Creative Commons Attribution Non-Commercial License (http://creativecommons.org/licenses/ by-nc/4.0/), which permits non-commercial re-use, distribution, and reproduction in any medium, provided the original work is properly cited. For commercial re-use, please contact [email protected]
SUPPLEMENT ARTICLE
A Cross-National Investigation of Hallucination-Like Experiences in 10 Countries:
The E-CLECTIC Study
Sara Siddi*,1,2,3,4, , Susana Ochoa1,2,3, Frank Laroi5,6,7, Matteo Cella8, Andrea Raballo9,10, ,
Sandra Saldivia11, Yanet Quijada12, Julien Laloyaux5,6,7, Nuno Barbosa Rocha13, Tania M. Lincoln14,
Björn Schlier14, Evangelos Ntouros15,16, Vasileios P. Bozikas16, Łukasz Gawęda17, Sergio Machado18,19,
Antonio E. Nardi18, Demián Rodante20, Smita N. Deshpande21, Josep Maria Haro1,2,3, and Antonio Preti4,22
1Parc Sanitari Sant Joan de Déu, Fundació Sant Joan de Déu, Institut de Recerca Sant Joan de Déu, Sant Boi de Llobregat, Spain; 2Universitat de Barcelona, Barcelona, Spain; 3Centro de Investigación Biomédica en Red de Salud Mental (CIBERSAM), Madrid, Spain; 4Department of Education, Psychology, Philosophy, University of Cagliari, Cagliari, Italy; 5Department of Biological and Medical
Psychology, University of Bergen, Bergen, Norway; 6NORMENT – Norwegian Center of Excellence for Mental Disorders, Research,
University of Oslo, Oslo, Norway; 7Psychology and Neuroscience of Cognition Research Unit, University of Liège, Liège, Belgium; 8Department of Psychology, Institute of Psychiatry, Psychology and Neuroscience, King’s College London, London, UK; 9Department
of Medicine, Section of Psychiatry, University of Perugia, Perugia, Italy; 10Department of Psychology, Psychopathology and
Development Research, Norwegian University of Science and Technology (NTNU), Trondheim, Norway; 11Department of Psychiatry
and Mental Health, Faculty of Medicine, University of Concepcion, Concepcion, Chile; 12Facultad de Psicologia, Universidad San
Sebastian, Concepcion, Chile; 13Center for Rehabilitation Research, School of Health, P.Porto, Porto, Portugal; 14Clinical Psychology
and Psychotherapy, Institute of Psychology and Movement Sciences, Universitat Hamburg, Hamburg, Germany; 15Psychiatric
Department, 424 General Military Hospital of Thessaloniki, Thessaloniki, Greece; 161st Department of Psychiatry, Aristotle University
of Thessaloniki, General Hospital “Papageorgiou”, Thessaloniki, Greece; 17II Department of Psychiatry, The Medical University
of Warsaw, Warsaw, Poland; 18Laboratory of Panic and Respiration, Institute of Psychiatry (IPUB), Federal University of Rio de
Janeiro (UFRJ), Rio de Janeiro, Brazil; 19Laboratory of Physical Activity Neuroscience, Salgado de Oliveira University, Niteroi, Brazil; 20Institute of Pharmacology, School of Medicine, University of Buenos Aires, Argentina; “Dr. Braulio A. Moyano” Neuropsychiatric
Hospital, Ciudad de Buenos Aires, Argentina; 21Department of Psychiatry, & Centre of Excellence in Mental Health, PGIMER-Dr. Ram
Manohar Lohia Hospital, Bangabandhu Sheikh Mujib Road, New Delhi, India; 22Center of Liaison Psychiatry and Psychosomatics,
University Hospital, University of Cagliari, Cagliari, Italy
*To whom correspondence should be addressed; Teaching, Research & Innovation Unit, Parc Sanitari Sant Joan de Déu, Dr. Antoni Pujadas, 42, 08830 - Sant Boi de Llobregat, Barcelona, Spain; tel: +34-93-640-63-50 Ext: (1) 2385, fax: +34-93-556-96-74, e-mail: [email protected]
Hallucination-like experiences (HLEs) are typically defined as sensory perceptions in the absence of external stimuli. Multidimensional tools, able to assess different facets of HLEs, are helpful for a better characterization of halluci-nation proneness and to investigate the cross-halluci-national vari-ation in the frequencies of HLEs. The current study set out to establish the validity, factor structure, and measurement invariance of the Launay-Slade Hallucinations Scale-Extended (LSHS-E), a tool to assess HLEs. A total of 4419 respondents from 10 countries were enrolled. Network analyses between the LSHS-E and the 3 dimensions of the Community Assessment of Psychic Experiences (CAPE) were performed to assess convergent and divergent validity of the LSHS-E. Confirmatory factor analysis was used to test its measurement invariance. The best fit was a 4-fac-tor model, which proved invariant by country and clinical status, indicating cross-national stability of the hallucina-tion-proneness construct. Among the different components
of hallucination-proneness, auditory-visual HLEs had the strongest association with the positive dimension of the CAPE, compared with the depression and negative dimen-sions. Participants who reported a diagnosis of a mental disorder scored higher on the 4 LSHS-E factors. Small effect size differences by country were found in the scores of the 4 LSHS-E factors even after taking into account the role of socio-demographic and clinical variables. Due to its good psychometric properties, the LSHS-E is a strong can-didate tool for large investigations of HLEs.
Key words: hallucination proneness/cross-national/measurement invariance
Introduction
Hallucinations and related phenomena involve sensorial experiences in the absence of stimuli that are accessible
to others.1 Hallucinatory phenomena occur on a
spec-trum ranging from vivid auditory imagery and intru-sive thoughts to fully developed hallucinations.2 In
epidemiological studies, particularly when self-report questionnaires are used, it is customary to use the term hallucination-like experiences (HLEs) to define a broader set of experiential anomalies, allegedly indicative of over-all hover-allucination proneness. HLEs are frequently associ-ated with delusional beliefs of a kind often observed in psychotic disorders, which are hence defined as psychotic-like experiences (PLEs).3 According to the continuum
hypothesis of psychosis, HLEs and PLEs lie on a contin-uum from normalcy to psychotic experiences.4 However,
although there is a tendency to consider HLEs as a proxy indicator of a predisposition to clinically-defined hallu-cinations, some studies indicate that there are disconti-nuities. In a review on the topic, Johns et al2 showed that
auditory-verbal HLEs share several similarities with audi-tory-verbal hallucinations, but also reported that there are qualitative differences along the continuum, particularly regarding the role of risk factors in determining the tran-sition from non-clinical to clinical status.
The investigation of HLEs is important in order to explore how perceptual anomalies become more patho-logical aberrations before there is a psychotic change in the way in which the sensory world is perceived and under-stood by a subject.5 The Launay-Slade Hallucinations
Scale (LSHS) is one of the most widely used tools in investigation of the occurrence of HLEs in both clinical and nonclinical samples.6–14 Over time, the LSHS has been
repeatedly revised. To account for different intensities of responses, the binary choice (ie, “true/false”; Launay and Slade14) was replaced with a 5-point Likert scale,8 and items
on visual HLEs were included.15 Larøi et al9,16 refined item
selection to include items exploring hallucinations expe-rienced in different sensory modalities and sleep-related experiences. However, depending on the response format used and the number of items included in the scale, dif-ferent factorial structures were found. These structures included 2-factor,10,15 3-factor,6,17–19 4-factor,9,13,20–22 and
5-factor16 models. Furthermore, despite the globalization
of research on the factor structure of the LSHS-Extended (LSHS-E), no study to date has explored the measure-ment invariance of this tool across countries and clinical status. The establishment of measurement invariance is a prerequisite to compare groups, since it provides evidence on whether respondents representing different clinical or socio-cultural backgrounds are interpreting a given mea-sure in a conceptually similar manner.
Cross-National Investigation of the Proportion of People With HLEs and Correlates of Hallucinations and HLEs
There is evidence that the proportion of people with HLEs varies across countries and this may be a reflection
of differing socio-cultural backgrounds and different distribution of psychotic disorders across countries. For example, the International Pilot Study of Schizophrenia reported that, despite the similar prevalence of schizo-phrenia observed across countries, the proportion of people with auditory hallucinations varied considerably, from 9% in Washington (United States), to 28% in Agra (India), and up to 46% in Cali (Colombia)23 (see also
refs.24,25). The most recent systematic review and
meta-analysis on the topic found high heterogeneity within the lifetime prevalence estimates of auditory HLEs in the general population, suggesting that factors such as age, gender, ethnicity, and participants’ culture may influence prevalence rates.26 The largest epidemiological
investiga-tions of the prevalence of PLEs and HLEs in general populations were the World Health Organization’s World Health Survey (WHS; n = 250 000 of 52 countries);25 and
the World Health Organization World Mental Health Surveys (WHO-WMHS),27 a coordinated set of
epide-miologic prevalence surveys of mental disorders in sev-eral countries (including 31 261 adults). In the WHS, data on hallucinations conflated information on auditory and visual HLEs. Wide variance was found across countries, from rates as low as 0.58% in the Czech Republic to as high as 32.03% in Nepal.25 On average, prevalence rates
were higher in countries with lower-mid/low economic level according to the World Bank category (5.49 [0.11] weighted and Sex-Age Standardized Prevalence Estimates, respectively), than in countries with high or upper-mid economic levels (2.39 [0.17]). In the WHO-WMHS, life-time prevalence rates and estimates were based on age- and gender-weighted data and were detailed for both visual (3.8% [0.2%]), and auditory HLEs (2.5% [0.1%]), again with wide variation by country.27 In contrast to the
WHS study, the lifetime prevalence estimates of HLEs in the WHO-WMHS were significantly higher in middle and high-income compared to the low-lower middle incomes countries. A higher prevalence of HLEs was found to be associated with being younger (16–19 years)28 being
female and unmarried (vs being married, in the WHS),25
unemployed27and having less education.25 However, in
the WHS, the associations between the PLEs and socio-demographic factors were measured indirectly through the health status (the prevalence of PLEs was related to a significant decrement in health status).
Aims of the Present Study
Past research into the cross-national proportion of people with hallucinations and HLEs in the general population has been limited by the use of single-item indicators, as in the WHO-WMHS, which makes it dif-ficult to assess the reliability of the reported experi-ence. Moreover, studies collapsed the data on auditory and visual HLEs into a single item, as in the WHS,25
and overlooked other sensorial modalities, or used a
broader construct of hallucination-proneness.28 The
E-CLECTIC Electronic–HalluCinationsLikeExperien cesCross-culTuralInternational Consortium set out to address these limitations and to study the cross-national proportion of people with HLEs and their correlates. Multidimensional tools can be evaluated for their reli-ability and convergent, divergent and predictive validity, and for measurement invariance in particular, a prereq-uisite for comparing means across groups.29 This article
reports on the first wave of the E-CLECTIC, aimed at testing: (a) the reliability, convergent and divergent valid-ity of the LSHS-E; (b) the factor structure and measure-ment invariance of the LSHS-E; (c) the impact of the socio-demographic and clinical factors on the different HLEs dimensions; (d) differences in the lifetime report-ing of multidimensional HLEs in population samples from Europe and South America.
Methods
The study protocol conforms to the guidelines of the 1995 Declaration of Helsinki and its revisions. The appropriate institutional ethics committee (at Sant Joan de Déu, the coordinating center, and all the involved centers) approved the study protocol. Informed consent was obtained online from all participants in accordance with the requirements of the local ethics committee. Data was collected from 11 countries across Europe (Belgium, Germany, Greece, Poland, Portugal, Spain, and United Kingdom), South America (Argentina, Brazil, and Chile), and Asia (India). However, India was excluded from analysis because not enough data was collected. Data was stored in an anonymous manner. The study was carried out between winter 2014 and summer 2016. Procedure
The study had a cross-sectional design and was car-ried out online through the Webropol Survey platform. Participants were invited through advertisements in social media (Facebook, Institutional webs, etc.), and University adverts. Participation was voluntary and no fee or other compensation was provided. Participants were required to exclude any experiences where they might have been under the effect of drugs or alcohol. Inclusion criteria were: aged 18 years and older.
Measures
Socio-Demographic Variables Schedule. Self-report data on sex, age, education, civil status, occupational status, family income, and past diagnosis of a mental or neurological disorder was used to define the socio-demographic and clinical characteristics of the sample. Variables were dichotomized to examine the associa-tions between socio-demographic factors and indicators
of HLEs. Target variables were: female (vs male); age ≤25 years (vs ≥26 years); having a university degree or higher educational qualifications (vs lower educational level); being married (vs single, divorced or widowed); being employed (vs unemployed for any reason); having a low family income (vs average or higher than average family income); having received a diagnosis of a mental disorder (vs people with no disorder).
Launay-Slade Hallucination Scale-Extended (LSHS-E). The 16-item LSHS-E taps into multiple sensory modalities including auditory, visual, olfactory and tactile, as well as hypnagogic and hypnopompic hal-lucinations and sensed presence (ie, the experience of feeling the presence of someone close who has died).9,16
Respondents are asked to rate each item on a 5-point scale: (0) “certainly does not apply to me”; (1) “possibly does not apply to me”; (2) “unsure”; (3) “possibly applies to me”; and (4) “certainly applies to me”. Standard trans-lation and back-transtrans-lation procedures were followed in the adaptation of the questionnaires to languages for which a validated version was unavailable (ie, Brazilian, Chilean, Greek, Polish, Portuguese,). For each factor, the scores were calculated by adding the responses to their respective items and dividing the sum by the number of items included in the factor, so as to preserve the 0 to 4 rating. Higher scores (3 or 4) indicated a greater likeli-hood of experiencing the phenomena summarized in the factor.
Community Assessment of Psychic Experiences (CAPE). The CAPE is a 42 item self-report tool that evaluates 3 dimensions: the Positive (20 items), Negative (14 items), and Depressive (8 items) dimensions of PLEs in the general population.30,31 It was primarily based on
the PDI-21 and PDI-40 developed by Peters, Joseph, and Garety.32,33 Each question is answered on a 4-point
Likert-type response scale that ranges from almost never (1) to almost always (4). Standard translation and back-translation procedures were followed for languages for which a validated version was unavailable (Polish). Statistical Analysis
All data were coded and analyzed using the Statistical Package for Social Sciences (SPSS) version 20. Additional analyses were carried out with dedicated packages running in R.34 All tests were 2-tailed. Due to
multiple testing, significance threshold was set at P < .005.35 Scale reliability was measured using Cronbach’s
alpha to allow for comparison with past studies. The factor structure of the LSHS-E was tested through con-firmatory factor analysis (CFA), which was carried out with the R-package lavaan.36 The following models were
compared: a 1-dimensional model, which assumes that all scale variance may be explained by a single factor;
a 2 first-order factors model (clinical and non-clinical items,10 an appealing and intuitive model, albeit obtained
in a different version of the scale), a 4-factor model including “intrusive thoughts,” “vivid daydreams,” “multisensory HLEs,” and “auditory-visual HLEs”, as defined in previous research,13,21 and 5-factor model.16 in
which the auditory and visual HLE items were separated into 2 distinct factors (see supplementary material for details). Measurement invariance was calculated accord-ing to Byrne and van de Vijver37 by using the R-package
semTools.36 Configural, metric and scalar invariance were
tested. Models were compared on the basis of changes in Confirmatory Fit Index (CFI) and Root Mean Square Error of Approximation (RMSEA) (delta-CFI and delta-RMSEA) (see supplementary material for details).
To test for convergent and divergent validity, asso-ciations between LSHS-E and CAPE factors were explored with network analysis through the Gaussian Markov random field estimation using graphical LASSO (least absolute shrinkage and selection opera-tor) and extended Bayesian information criterion (eBIC) to select an optimal regularization parameter. Regularization is a statistical procedure that restricts the links between variables to their unique variance, ie, after controlling for the effects of all the other vari-ables, thus avoiding the estimation of spurious links. These analyses were done with the bootnet package for R.38 Graphical representations were computed using
the qgraph package for R.39
The role of socio-demographic and clinical variables in the distribution of scores on the dimensions (or fac-tors) of the LSHS-E that were extracted by the best CFA model was tested with a series of multivariate analyses of covariance (MANCOVA). For each vari-able, we assessed its relationship with the construct mea-sured by the LSHS-E dimensions by taking into account all other variable as covariates. The following variables were entered into these analyses: sex, age, education, civil status, employment, family income, and diagnosis, as previously defined. Statistics were calculated on the basis of the Pillai’s trace, since it is the most conservative measure against type I error due to multiple tests and violations of homogeneity of covariance (matrices).40
With large samples the procedure is rather robust to vio-lation of assumptions. Partial η2 was used as a measure
of effect size, with values of 0.0099, 0.0588, and 0.1379 as threshold for small, medium, and large effect size.41
Sensitivity analysis was conducted to explore any potential effects of caffeine, tobacco, marihuana, and alcohol on the HLEs. Spearman correlation was per-formed to analyze the associations between substance use and the 4 LSHS-E factors. The impact of substance use in the distribution by country of 4 LSHS-E factors was explored with MANCOVA, also taking socio-demo-graphic and clinical variables into account (see
supple-mentary materials for details).
Results
A total of 4419 participants from 10 countries were involved in the study. Participants were predominantly young, with 80% of the sample ≤35 years. About two-thirds of the sample were women (table 1).
A minority of participants (18%) was from low-income families. About an eighth of the sample reported having been diagnosed with a mental disorder (n = 547; 12.3%), including anxiety disorders (n = 114: 2.6%); depression (n = 309; 7%); bipolar disorder (n = 25; 0.6%); schizophre-nia spectrum disorders (n = 8; 0.2%); other (ie, anorexia or bulimia nervosa; personality disorders; n = 91; 2.1%). Overall, 86 participants (1.9%) self-reported a diagnosis of neurological disorder, whereas 7 participants (0.2%) did not specify whether they had been diagnosed with a psychiatric or neurological disorder.
Reliability of the LSHS-E Across Countries
Reliability of the LSHS-E, as indicated by Cronbach’s alpha, was good, with values above the conventional threshold of 0.7 for all countries except Argentina (α = .69). Reliability was good in all countries for all dimensions of the CAPE (supplementary table S1). Frequency of HLEs on the LSHS-E
The proportion of participants who selected the possibly applies to me (3) or certainly applies to me (4) responses on LSHS-E varied from 7% to 64% depending on the experience assessed (figure 1).
Sleep-related (ie, hypnagogic and hypnopompic) HLEs were reported with higher frequencies (33%–42%) than auditory or visual hallucinatory HLEs (7%–12%).
The Factor Structure of the LSHS-E Across Countries The CFA models were initially tested on participants who did not report a diagnosis of a mental or neurological disorder (n = 3779). Subsequently, 2 sets of measurement invariance CFA were applied: one to assess measure-ment invariance across countries; and the other to verify whether the best model was invariant between people who reported a diagnosis of mental disorder and those who did not.
In people who did not report a diagnosis, all CFA models were identified and all models reached the threshold for a good fit, except on the chi-square test, as is often the case with large samples. McDonald’s omega was suboptimal but still acceptable (
supplemen-tary table S2). The models with the best fit were the
5-factor and the 4-factor models. However, the 5-factor model had a factor with just 2 items. Thus, the 4 factors model was judged to be the most parsimonious model with the best fit and was consequently selected for inter-pretation and invariance testing. In this model, factor
T able 1. Sample Char acteristics b y Country Country Sample Male / Female Age Dia gnosis of Mental Disor der F amil y Income
(Less Than Aver
age) Ci vil Sta tus (Single , Di vor ced or W ido w ed) Emplo yment (Unemplo yed or Student) Educa tion (Lo w er Educa tion) Mean (R ange) Eur ope Belgium 306 65 / 241 28.7 (19–68) 16 (5.2%) 62 (20%) 259 (84.6%) 230 (75.2%) 44 (14.4%) Ger man y 296 92 / 204 29.3 (19–69) 73 (24.7%) 164 (55%) 218 (73.6%) 213 (72%) 182 (61.5%) Gr eece 229 93 / 136 33.1 (21–63) 14 (6.1%) 29 (13%) 157 (68.6%) 103 (45%) 88 (38.4%) Poland 100 31 / 69 30.5 (20–68) 18 (18.0%) 11 (11%) 41 (41%) 42 (42%) 26 (26%) Portugal 154 50 / 104 32.8 (19–65) 19 (12.3%) 11 (7%) 96 (62.3%) 68 (44.2%) 58 (37.7%) Spain 342 91 / 251 37.8 (18–68) 28 (8.2%) 38 (11%) 145 (42.4%) 43 (12.6%) 104 (30.4%) United Kingdom 62 21 / 41 30.1 (18–45) 15 (24.2%) 13 (18%) 39 (62.9%) 22 (35.5%) 8 (12.9%) South America Ar gentina 92 39 / 53 25.1 (19–65) 5 (5.4%) 5 (5%) 43 (46.7%) 66 (65%) 44 (4.3%) Br azil 137 37 / 100 39.4 (18–69) 41 (29.9%) 2 (1%) 62 (45.3%) 37 (27%) 24 (17.5%) Chile 2701 1025 / 1676 26.5 (19–68) 318 (11.8%) 472 (17%) 2339 (86.6%) 2159 (80%) 2212 (81.9%) Gr and total 4419 1544 / 2875 28.9 (18–69) 547 (12.3%) 807 (18%) 3399 (76.9%) 2923 (66%) 2750 (62.0%)
1 can be labeled “intrusive thoughts” (items: 1, 2, 3); factor 2 can be seen as representing “vivid daydreams” (items 5, 6, 7); factor 3 can be labeled “multisensory HLEs” (items: 11, 12, 13, 14, 15) and factor 4 is related
to “auditory-visual HLEs” (items: 4, 8, 9, 10, 16) (
sup-plementary figure S1).
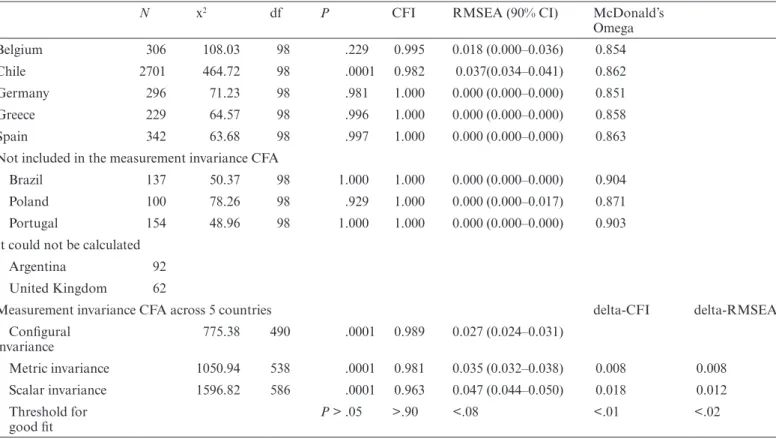
Table 2 summarizes the results of the measurement
invariance CFA across countries. The best model was
Table 2. Fit Indexes for Invariance Tests of the 4-Factor Model Across Countries (Sample: n = 3874; 5 Countries)
N x2 df P CFI RMSEA (90% CI) McDonald’s
Omega Belgium 306 108.03 98 .229 0.995 0.018 (0.000–0.036) 0.854 Chile 2701 464.72 98 .0001 0.982 0.037(0.034–0.041) 0.862 Germany 296 71.23 98 .981 1.000 0.000 (0.000–0.000) 0.851 Greece 229 64.57 98 .996 1.000 0.000 (0.000–0.000) 0.858 Spain 342 63.68 98 .997 1.000 0.000 (0.000–0.000) 0.863
Not included in the measurement invariance CFA
Brazil 137 50.37 98 1.000 1.000 0.000 (0.000–0.000) 0.904
Poland 100 78.26 98 .929 1.000 0.000 (0.000–0.017) 0.871
Portugal 154 48.96 98 1.000 1.000 0.000 (0.000–0.000) 0.903
It could not be calculated
Argentina 92
United Kingdom 62
Measurement invariance CFA across 5 countries delta-CFI delta-RMSEA
Configural invariance 775.38 490 .0001 0.989 0.027 (0.024–0.031) Metric invariance 1050.94 538 .0001 0.981 0.035 (0.032–0.038) 0.008 0.008 Scalar invariance 1596.82 586 .0001 0.963 0.047 (0.044–0.050) 0.018 0.012 Threshold for good fit P > .05 >.90 <.08 <.01 <.02
Note: CFA, confirmatory factor analysis.
Fig. 1. Distribution of scores by item for the LSHS-E in the sample. The items are ranked according to the frequency of positive endorsement.
implemented in all countries with large enough samples for model convergence (excluding Argentina and the United Kingdom). A good model-fit was found in all country-samples (table 2).
Measurement invariance was conducted across the 5 countries with enough data for this analysis (ie, Belgium, Chile, Germany, Greece, and Spain). Fit was good in all countries and across all levels of the measurement invari-ance test. There was some degradation of the fit from configural to scalar invariance, with the delta-CFI but not the delta-RMSEA above the conventional threshold for invariance acceptability. However, the MacCallum et al42 test of small differences in fit suggested that the
differences were negligible for each nested comparison (P > .1).
Supplementary table S3 summarizes the results of the
measurement invariance CFA between people who did not report a mental or neurological diagnosis (n = 3779) and people who reported a diagnosis of a mental disorder (n = 547). Results indicated an optimal fit in both sam-ples. Measurement invariance was deemed acceptable at all levels of comparison.
Convergent and Divergent Validity of the LSHS-E
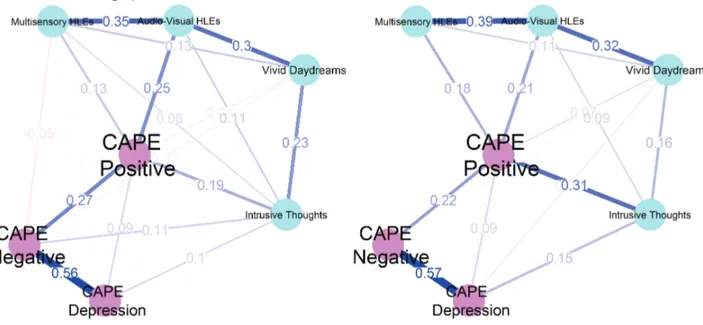
In the network analysis, the 4 LSHS-E factors were linked more with positive symptoms as measured by the CAPE than with negative or depression dimensions
(figure 2). The auditory-visual HLE factor had the
strongest link with the CAPE positive symptoms factor. However, compared with putatively “healthy” people,
those who reported a diagnosis of a mental disorder showed a greater influence of the “intrusive thoughts” factor in the association between the auditory-visual HLEs factor and the CAPE positive symptoms dimen-sion: r = .19 vs r = .31; Fisher r-z transform test, z = 2.8; P = .01 (figure 2).
Overall, the networks did not differ: van Borkulo net-work invariance test, M = 0.124; P = .072.
Impact of Socio-Demographic and Clinical Variables on the 4 LSHS-E Dimensions
After taking into account all other variables, in the whole sample women scored higher than men, particularly on the intrusive thoughts and multisensory HLEs dimen-sions of LSHS-E. The effect size of this difference was modest. Being married, having a university degree or higher education, and being employed were related to lower scores on the LSHS-E dimensions. The effect sizes of these associations were small. People who reported a diagnosis of a mental disorder scored higher on the LSHS-E dimensions, both overall and on each factor. After taking into account all other variables, age, and family income were not related to the LSHS-E dimen-sions (see supplementary table S4 for the details).
Differences by Country on the 4 Dimensions of the LSHS-E
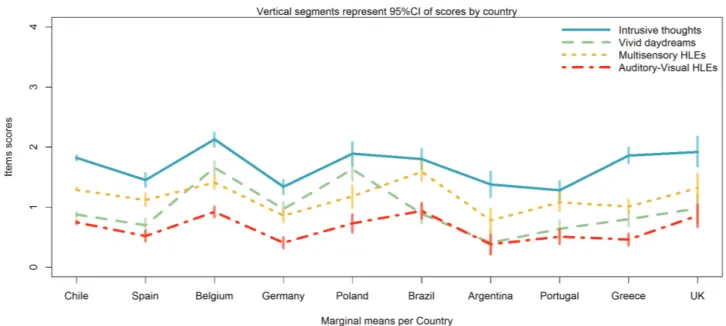
Taking into account the socio-demographic and clinical variables, scores on the LSHS-E dimensions differed by
Fig. 2. Network graph of the links among the 3 dimensions of the CAPE and the 4 factors of the LSHS-E in putatively healthy people (on the left) and in people who reported a diagnosis of a mental disorder (on the right). Colors correspond to different assessment tools (CAPE vs LSHS-E). Thickness of the lines is proportional to the estimated correlation coefficients, which are superimposed on the lines. Positive correlations are in “powder blue”; negative correlations are in “violet”.
sample at country level, both overall and on each single dimension. The effect sizes of these differences were small
(table 3 and supplementary table S5).
Participants from Belgium and Poland, and Brazil in some aspects sometime, tended to score higher than par-ticipants from other countries, while parpar-ticipants from Argentina and Portugal tended to score lower than par-ticipants from other countries. Overall, there was a large overlap among countries’ samples as far as scores on the LSHS-E dimensions were concerned (figure 3).
Impact of Substance Use on the 4 Factors of the LSHS-E, by Taking Sociodemographic and Clinical Variables Into Account
Overall, 33.4% of people reported to smoking, 79.1% consumed caffeine, 81.6% alcohol, and 28.5% marihuana. People rarely (<1%) reported the use of other substances (heroin, cocaine, hallucinogenic mushrooms, ecstasy), which were excluded from further analysis. Marihuana and tobacco were positively related to the LSHS-E dimensions (except to vivid daydreams for tobacco). Caffeine was negatively related to all dimensions (except to multisensory HLEs) and alcohol was only related to Auditory-visual HLEs (supplementary table S5). Taking into account substance use, and socio-demographic and clinical variables, the differences on the 4 LSHS-E dimen-sions by country did not change significantly (
supple-mentary table S6).
Discussion
This study provides evidence for the use of the LSHS-E as a tool to measure hallucination-proneness in epidemi-ological studies. Across 10 countries from Europe and South-America, reliability of the LSHS-E was good, allowing comparison across groups of its scores. CFA confirmed that the LSHS-E scores distribute into 4 corre-lated dimensions or factors having the best fit. The most important contribution of this study is the demonstra-tion that the best model as retrieved by CFA was repro-ducible across countries and measurement invariance of the model could be demonstrated in 5 countries that had enough data for the algorithm to converge. This find-ing confirmed that the multidimensional articulation of hallucination proneness can be reproduced across coun-tries with different languages and cultures. Other studies have confirmed the multidimensionality of this scale in various versions.6,9,16,18–22 However, structures often
dif-fered depending on the version of the LSHS used in each study. This study replicated the 4-factor structure of the LSHS-E as reported by previous studies,13,20,21providing
some consistency for 4-factors of the propensity to expe-rience HLEs in the general population. Moreover, this version fully matches the factor-structure reported by Larøi9 in one of the original studies.
Convergent and divergent validity of these dimensions were good when measured with the tool for the assessment of PLEs, the CAPE. As expected, the 4 factors identified were more closely related to the CAPE positive dimen-sion than to the negative and depressive dimendimen-sions. Impact of Socio-Demographic and Clinical Factors on HLEs
People who reported having received a diagnosis of a mental disorder were more likely to admit HLEs than healthy people and scored higher on the 4 LSHS-E dimensions even when socio-demographic variables were taken into account. Conversely, people with a high edu-cational level, those who declared themselves married and those who reported having a job scored lower than their counterparts on the 4 LSHS-E dimensions. This is in line with past studies that also showed that young age, being unemployed and being unmarried was associated with the reporting of HLEs.27,43,44 Although the reasons
for this are not fully understood, it can be speculated that older people or those who are more educated are also more aware that such experiences may be labeled as odd or socially undesirable, but these speculations are yet to be backed up empirically. Other explanations that have been put forward are that the impact of age might be due to a physiological, neurodevelopmental stage favoring the expression of psychosis proneness45 and that
hallucina-tions might be less prevalent in highly-educated popu-lations because of their strong association with social adversity that is less prevalent in groups with higher-socioeconomic status.46
Women scored higher than men with modest effect sizes on the intrusive thoughts and multisensory HLEs dimen-sions. Previous studies reported a greater occurrence of HLEs in women across countries with different cultural belonging.27,47 Morokuma et al observed, in a population
of Japanese adolescents, that the prevalence of auditory-verbal HLEs was higher among girls than boys.47
A simi-lar result was found in a study including 5000 16-year-old twins.48 Likewise, women with schizophrenia were found
more likely to report hallucinations than men.49 There is
no clear explanation for greater reporting of HLEs and hallucinations by girls/women than boys/men. One pos-sibility is the greater propensity of women to disclose symptoms of distress,50 with HLEs being related to
dis-tress in both clinical and nonclinical samples.2
Among participants who reported a diagnosis of a mental disorder, the dimension of “intrusive thoughts” had a more central role in the network, including both HLEs and PLEs, than in the healthy people. Although repeated measurement designs are necessary to establish temporal associations, we can speculate that the presence of intrusive thoughts may be a crucial factor in generat-ing hallucinations in people with psychosis.51 According
to some authors, hallucinations originate from a failure
T
able 3.
Multi
varia
te Impact of
Country on LSHS-E Dimensions T
aking Into Account Socio-Demo
gr
aphic and Clinical V
aria bles ( n = 4263) Estima ted Mar ginal Means (W ith 95% CI) MANCO VA They ar e Adjusted f or an y Other V aria
ble in the Model
Multi varia ble Sta tistics V aria ble Le vels Intrusi ve Thoughts* V ivid Da ydr eams* Multisensory HLEs* A uditory-V isual HLEs* Pillai’ s T race F v alue P artial η 2 Country Belgium 2.13 (2.01–2.24) 1.66 (1.54–1.77) 1.41 (1.30–1.53) 0.92 (0.83–1.01) 0.136 F (36; 16984) = 16.5; P < .0001 0.034 Ger man y 1.34 (1.22–1.45) 0.97 (0.86–1.08) 0.86 (0.75–0.97) 0.41 (0.32–0.50) Gr eece 1.86 (1.73–1.99) 0.80 (0.68–0.92) 1.01 (0.89–1.13) 0.46 (0.36–0.56) Poland 1.89 (1.69–2.08) 1.63 (1.44–1.82) 1.18 (0.99–1.36) 0.73 (0.58–0.88) Portugal 1.28 (1.12–1.43) 0.64 (0.49–0.79) 1.08 (0.94–1.23) 0.51 (0.39–0.63) Spain 1.45 (1.34–1.57) 0.70 (0.59–0.81) 1.12 (1.02–1.23) 0.52 (0.43–0.61) United Kingdom 1.92 (1.68–2.17) 0.98 (0.74–1.22) 1.32 (1.09–1.56) 0.86 (0.67–1.05) Ar gentina 1.38 (1.17–1.59) 0.41 (0.21–0.61) 0.78 (0.58–0.98) 0.38 (0.22–0.54) Br azil 1.80 (1.63–1.97) 0.89 (0.73–1.05) 1.59 (1.43–1.75) 0.94 (0.81–1.07) Chile 1.82 (1.78–1.86) 0.88 (0.84–0.92) 1.29 (1.25–1.33) 0.75 (0.72–0.78) Note : LSHS-E, Launa y-Slade Hallucina tions Scale-Extended. P eople w ho declar ed a past neur olo gical disor der w er e e xcluded. F or some v aria bles , inf or ma tion w as occasionall y missing. Multi varia te anal yses of co variance (MANCO VA) - Betw
een subjects sta
tistics
.
*P
< .0001.
of the self-monitoring mechanism, the misattribution of these experiences to an external source.52,53 In particular,
Bentall et al54 have suggested that traumatic experiences
may lead to intrusive thoughts that occur spontaneously without the individual having control over them55 and
their presence can complicate discrimination between thoughts and external stimuli. Another possibility could be that intrusive thoughts and HLEs might represent a variation of the same phenomenon, which is described in different ways by different people. Raballo51 has argued
that the HLEs are phenomena arising from the general transformation of the thought stream. Humpston,56
fur-ther, argued that auditory-verbal HLEs are the results of a thought process, and suggested that the intensity of thinking and related distress might cause an alienation from unwanted thoughts that then turn into auditory-verbal HLEs.
Cross-National Differences on the 4-Factors of HLEs Finally, differences by country samples were found in the HLEs scores of the 4 LSHS-E dimensions even after taking into account the role of socio-demographic and clinical variables. Participants from Belgium and Poland, and Brazil in some aspects, tended to score higher than participants from the other countries, while participants from Argentina and Portugal tended to score lower than participants from the other countries. Overall, differences by country samples were small in terms of effect sizes. In the WHS,57 authors observed a significant
associa-tion between HLEs, other PLEs and income inequality after controlling for the per capita income of a country,
regime type and number of years of democracy. We failed to find a relationship between family income and HLEs, although we did not investigate the role of income ine-quality. It should be borne in mind that the context is not limited to circumstantial details, such as family income, but also involves macroscopic, transindividual aspects, such as culture and language. Culture is likely to shape the content of HLEs, guide their appraisal, model the behav-ioral reaction, and affect the individual’s willingness to disclose the experience.58 Additional factors related to a
society’s culture, such as public attitudes and self-stigma, may have an impact on the reporting of HLEs59 and the
distress associated with them.13 Furthermore, other
fac-tors such as use of cannabis and other drugs could be related to HLEs. In fact, a recent review60 reported that
healthy individuals attributed their HLEs to substance consumption. In this study, the differences on the 4 dimensions across countries were unaffected from sub-stance use. Future studies are needed to explore this issue more in depth.
Strengths and Limitations
This study was entirely based on self-report tools, and this might have introduced some bias into responses (eg, social desirability). However, self-report measures favor the enrollment of large samples. As anonymity of data was guaranteed, participants might have been more forth-coming in replying to the questionnaires. Furthermore, the following limitations have to be considered. First, we did not ask for information on participants’ ethnic back-grounds, so we were unable to explore ethnic correlates
Fig. 3. Distribution of scores by countries for the 4 dimensions of the LSHS-E as estimated by CFA: Intrusive thoughts; Vivid daydreams; Multisensory HLEs; Auditory-Visual HLEs. Data are marginal means as estimated on the basis of the multivariate analyses of covariance (MANCOVA) taking into account the role of socio-demographic and clinical variables. Vertical segments represent 95% CI of the means.
of HLEs in the first wave of the E-CLECTIC. Second, only people that have Internet access could answer the surveys, which may explain the low participation rates among older people and people with lower income. Third, among the countries that were involved in the measure-ment invariance analysis 4 were European, and the fifth was Chile, which has been significantly influenced by Spanish culture; this limits the generalization of findings to different cultures. The results can be considered valid for EU countries, and South American countries heavily populated by individuals with European heritage, but still have to be confirmed in non-WEIRD (Western, Educated, Industrialized, Rich and Democratic) countries. However, we also included countries with different, non-Spanish cultural backgrounds: Belgium, Germany, Greece, and Poland. Fourth, we enrolled convenience samples, which cannot be considered representative of the populations of interest. Nevertheless, the analysis we did can be informa-tive at the lower boundaries of what can be observed in representative samples. Last but not least is the inclusion of countries with predominantly European heritage and a common religious background. Religion might have an impact on hallucinatory experiences. Previous studies showed that religious practices might be adopted as a strat-egy to cope with the stress caused by these experiences.61
Future Directions
In the second wave of the E-CLECTIC, a more in-depth investigation of the links between hallucination proneness and different cultural features such as ethnic, religious, regional and political affiliation,58 and the role of migrant
status43 will be explored in countries with different cultural
backgrounds. Our proposal is to use the LSHS-E in future studies to explore the multidimensionality of the HLEs. The findings presented in this study indicate measure-ment invariance across countries with different linguistic backgrounds and among people who might or not have received a diagnosis of a mental disorder. This ensures that the LSHS-E can be used to monitor HLEs in differ-ent European and South-American cultures. This is prom-ising in regard to extending the survey to include further cultures in future research that could also include an assess-ment of cultural values (eg, collectivism vs individualism) in order to be able to test for the impact of culture in a more direct manner. A better understanding and awareness of the diversity of people’s attitudes toward hallucinations based on their cultural background may eventually help cli-nicians, to take into account a person’s cultural background when assessing and treating hallucinations and respond appropriately to the distress experienced by patients.58,62
Supplementary Material
Supplementary material is available at https://academic.
oup.com/schizophreniabulletin/.
Funding
The collection of the data in Spain was supported by the Parc Sanitari Sant Joan de Déu (PSSJD: AR201404) and the publication fee by CIBERSAM (SAM15PINT1508) to S.S. Grant PRRMAB-A2011-19251 from the Sardinia Region to S.S. Ł.G. was supported by the Ministry of Higher Education and Science of Republic of Poland (0295/E-393/STY/10/2015, 1258/MOB/IV/2015/0).
Acknowledgments
The findings included in this article were, in part, pre-sented at the 4th Meeting of the International Consortium on Hallucination Research, Lille, France, November 6–8, 2017. The first author is sincerely grateful to Prof. Benedicto Crespo Facorro for giving the opportunity to present the study in the VI FORO INTERNACIONAL EN ESQUIZOFRENIA CIBERSAM, November 23–24, 2017. Authors thank Dr. Aislinne Freeman and Stephen Kelly for their help, Dr Daniel Fernandez for making valuable suggestions about the paper; and Deepak Malik for his help in translation into Hindi. The authors have declared that there are no conflicts of interest in relation to the subject of this study.
References
1. Bell V, Raballo A, Larøi F. Assessment of hallucinations. In: Larøi F, Aleman A, eds. Hallucinations: A Practical Guide to
Treatment and Management. Oxford, UK: Oxford University
Press; 2010:377–397.
2. Johns LC, Kompus K, Connell M, et al. Auditory verbal hallu-cinations in persons with and without a need for care. Schizophr
Bull. 2014;40(suppl. 4):S255–S264. doi:10.1093/schbul/sbu005
3. Johns LC, van Os J. The continuity of psychotic experiences in the general population. Clin Psychol Rev. 2001;21:1125–1141. 4. van Os J, Linscott RJ, Myin-Germeys I, Delespaul P,
Krabbendam L. A systematic review and meta-analysis of the psychosis continuum: evidence for a psychosis proneness-persistence-impairment model of psychotic disorder. Psychol
Med. 2009;39:179–195.
5. Stanghellini G. Phenomenological psychopathology, pro-fundity, and schizophrenia. Philos Psychiatry, Psychol. 2011;18:163–166.
6. Aleman A, Nieuwenstein MR, Böcker KBE, De Haan EHF. Multi-dimensionality of hallucinatory predisposition: factor structure of the Launay–Slade Hallucination Scale in a normal sample. Pers Individ Dif. 2001;30:287–292.
7. Aleman A, Nieuwenstein MR, Böcker KB, de Haan EH. Temporal stability of the Launay-Slade Hallucination Scale for high- and low-scoring normal subjects. Psychol Rep. 1999;85:1101–1104.
8. Bentall RP, Slade PD. Reality testing and auditory hallucina-tions: a signal detection analysis. Br J Clin Psychol. 1985;24 (Pt 3):159–169.
9. Larøi F, Marczewski P, Van der Linden M. Further evidence of the multi-dimensionality of hallucinatory predisposition: factor structure of a modified version of the Launay-Slade Hallucinations Scale in a normal sample. Eur Psychiatry. 2004;19:15–20.
10. Serper M, Dill CA, Chang N, Kot T, Elliot J. Factorial struc-ture of the hallucinatory experience: continuity of experi-ence in psychotic and normal individuals. J Nerv Ment Dis. 2005;193:265–272.
11. Siddi S, Petretto DR, Scanu R, et al. Deficits in metaphor but not in idiomatic processing are related to verbal hallucinations in patients with psychosis. Psychiatry Res. 2016;246:101–112. 12. Siddi S, Petretto DR, Burrai C, et al. The role of
set-shift-ing in auditory verbal hallucinations. Compr Psychiatry. 2017;74:162–172.
13. Preti A, Sisti D, Rocchi MB, et al. Prevalence and dimension-ality of hallucination-like experiences in young adults. Compr
Psychiatry. 2014;55:826–836.
14. Launay G, Slade P. The measurement of hallucinatory pre-disposition in male and female prisoners. Pers Individ Dif. 1981;2:221–234.
15. Morrison AP, Wells A, Nothard S. Cognitive factors in pre-disposition to auditory and visual hallucinations. Br J Clin
Psychol. 2000;39 (Pt 1):67–78.
16. Larøi F, Van Der Linden M. Nonclinical participants’ reports of hallucinatory experiences. Can J Behav Sci. 2005;37:33–43. 17. Paulik G, Badcock JC, Maybery MT. The multifactorial
structure of the predisposition to hallucinate and asso-ciations with anxiety, depression and stress. Pers Individ Dif. 2006;41:1067–1076.
18. Castiajo P, Pinheiro AP. On “Hearing” voices and “Seeing” things: probing hallucination predisposition in a Portuguese nonclinical sample with the launay-slade hallucination scale-revised. Front Psychol. 2017;8:1138.
19. Waters FAV, Badcock JC, Maybery MT. Revision of the factor structure of the Launay-Slade Hallucination Scale (LSHS-R).
Pers Individ Dif. 2003;35:1351–1357.
20. Siddi S, Ochoa S, Farreny A, et al. Measurement invariance of the Spanish Launay-Slade Hallucinations Scale-Extended ver-sion between putatively healthy controls and people diagnosed with a mental disorder. Int J Methods Psychiatr Res. 2018:e1741. 21. Vellante M, Larøi F, Cella M, Raballo A, Petretto DR, Preti A.
Hallucination-like experiences in the nonclinical population. J
Nerv Ment Dis. 2012;200:310–315.
22. Fonseca-Pedrero E, Lemos-giráldez S, Paino M, et al. Dimensionality of hallucinatory predisposition : confirma-tory factor analysis of the Launay-Slade Hallucination Scale-revised in college students. An Psicol. 2010;26:41–48.
23. Sartorius N, Shapiro R, Kimura M, Barrett K. WHO international pilot study of schizophrenia. Psychol Med. 1972;2:422–425.
24. Bauer SM, Schanda H, Karakula H, et al. Culture and the prevalence of hallucinations in schizophrenia. Compr
Psychiatry. 2011;52:319–325.
25. Nuevo R, Chatterji S, Verdes E, Naidoo N, Arango C, Ayuso-Mateos JL. The continuum of psychotic symptoms in the general population: a cross-national study. Schizophr Bull. 2012;38:475–485.
26. Maijer K, Begemann MJH, Palmen SJMC, Leucht S, Sommer IEC. Auditory hallucinations across the lifespan: a systematic review and meta-analysis. Psychol Med. 2018;48:879–888. 27. McGrath JJ, Saha S, Al-Hamzawi A, et al. Psychotic
experi-ences in the general population: a cross-national analysis based on 31,261 respondents from 18 countries. JAMA Psychiatry. 2015;72:697–705.
28. Johns LC, Nazroo JY, Bebbington P, Kuipers E. Occurrence of hallucinatory experiences in a community sample and ethnic variations. Br J Psychiatry. 2002;180:174–178.
29. Milfont TL, Fischer R. Testing measurement invariance across groups: applications in cross-cultural research. Int J Psychol
Res. 2010;3:111–121.
30. Konings M, Bak M, Hanssen M, van Os J, Krabbendam L. Validity and reliability of the CAPE: a self-report instrument for the measurement of psychotic experiences in the general population. Acta Psychiatr Scand. 2006;114:55–61.
31. Stefanis NC, Hanssen M, Smirnis NK, et al. Evidence that three dimensions of psychosis have a distribution in the gen-eral population. Psychol Med. 2002;32:347–358.
32. Peters E, Joseph S, Day S, Garety P. Measuring delusional ideation: the 21-item Peters et al. Delusions Inventory (PDI).
Schizophr Bull. 2004;30:1005–1022.
33. Peters ER, Joseph SA, Garety PA. Measurement of delu-sional ideation in the normal population: introducing the PDI (Peters et al. Delusions Inventory). Schizophr Bull. 1999;25:553–576.
34. R Development Core Team. R: A Language and Environment
for Statistical Computing. Vienna, Austria: R Foundation
for Statistical Computing; 2013. http://www.R-project.org/. Accessed July 31, 2018.
35. Johnson VE. Revised standards for statistical evidence. Proc
Natl Acad Sci USA. 2013;110:19313–19317.
36. Pornprasertmanit S, Miller P, Schoemann A, Yves R. SemTools: Useful tools for structural equation modeling. R package version 0.3–2; 2013. http://CRAN.R-project.org/ package=semTools. Accessed July 31, 2018.
37. Byrne BM, van de Vijver FJR. Testing for measurement and structural equivalence in large-scale cross-cultural stud-ies: addressing the issue of nonequivalence. Int J Test. 2010;10:107–132.
38. Epskamp S, Borsboom D, Fried EI. Estimating psychologi-cal networks and their accuracy: a tutorial paper. Behav Res
Methods. 2018;50:195–212.
39. Epskamp S, Cramer AOJ, Waldorp LJ, Schmittmann VD, Borsboom D. qgraph : network visualizations of relationships in psychometric data. J Stat Softw. 2012;48:1–18.
40. Olson CL. Practical considerations in choosing a
MANOVA test statistic: a rejoinder to Stevens. Psychol Bull. 1979;86:1350–1352.
41. Richardson JTE. Eta squared and partial eta squared as meas-urements of effect size in educational research. Educ Res Rev. 2011;6:135–147.
42. MacCallum RC, Browne MW, Cai L. Testing differences between nested covariance structure models: power analysis and null hypotheses. Psychol Methods. 2006;11:19–35.
43. Pignon B, Schürhoff F, Szöke A, et al. Sociodemographic and clinical correlates of psychotic symptoms in the general population: findings from the MHGP survey. Schizophr Res. 2018;193:336–342.
44. Temmingh H, Stein DJ, Seedat S, Williams DR. The preva-lence and correlates of hallucinations in a general population sample: findings from the South African Stress and Health Study. Afr J Psychiatry. 2011;14:211–217.
45. Verdoux H, van Os J, Maurice-Tison S, Gay B, Salamon R, Bourgeois M. Is early adulthood a critical developmental stage for psychosis proneness? A survey of delusional ideation in normal subjects. Schizophr Res. 1998;29:247–254.
46. Lincoln TM, Keller E. Delusions and hallucinations in stu-dents compared to the general population. Psychol Psychother. 2008;81:231–235.
47. Morokuma Y, Endo K, Nishida A, et al. Sex differences in auditory verbal hallucinations in early, middle and late adoles-cence: results from a survey of 17 451 Japanese students aged 12-18 years. BMJ Open. 2017;7:e015239.
48. Ronald A, Sieradzka D, Cardno AG, Haworth CM, McGuire P, Freeman D. Characterization of psychotic experiences in adolescence using the specific psychotic experiences ques-tionnaire: findings from a study of 5000 16-year-old twins.
Schizophr Bull. 2014;40:868–877.
49. Lindamer LA, Lohr JB, Harris MJ, McAdams LA, Jeste DV. Gender-related clinical differences in older patients with schiz-ophrenia. J Clin Psychiatry. 1999;60:61–79.
50. Galdas PM, Cheater F, Marshall P. Men and health help-seeking behaviour: literature review. J Adv Nurs. 2005;49:616–623.
51. Raballo A. From perception to thought: a phenomenological approach to hallucinatory experience. Schizophr Bull. 2017;43: 18–20.
52. Brébion G, Stephan-Otto C, Ochoa S, Roca M, Nieto L, Usall J. Impaired self-monitoring of inner speech in schiz-ophrenia patients with verbal hallucinations and in non-clinical individuals prone to hallucinations. Front Psychol. 2016;7:1381.
53. Bentall RP. The illusion of reality: a review and integration of psychological research on hallucinations. Psychol Bull. 1990;107:82–95.
54. Bentall RP, de Sousa P, Varese F, et al. From adversity to psychosis: pathways and mechanisms from specific adversi-ties to specific symptoms. Soc Psychiatry Psychiatr Epidemiol. 2014;49:1011–1022.
55. Anonymous. Intrusive thoughts, impulses, and schizoaffective disorder [published online ahead of print August 10, 2016].
Schizophr Bull. doi:10.1093/schbul/sbw107.
56. Humpston CS. Perplexity and meaning: toward a phenom-enological “core” of psychotic experiences. Schizophr Bull. 2014;40:240–243.
57. Johnson SL, Wibbels E, Wilkinson R. Economic inequality is related to cross-national prevalence of psychotic symptoms.
Soc Psychiatry Psychiatr Epidemiol. 2015;50:1799–1807.
58. Larøi F, Luhrmann TM, Bell V, et al. Culture and hallu-cinations: overview and future directions. Schizophr Bull. 2014;40(suppl 4):S213–S220.
59. Angermeyer MC, van der Auwera S, Carta MG, Schomerus G. Public attitudes towards psychiatry and psychiatric treat-ment at the beginning of the 21st century: a systematic review
and meta-analysis of population surveys. World Psychiatry. 2017;16:50–61.
60. Waters F, Fernyhough C. Hallucinations: a systematic review of points of similarity and difference across diagnostic classes.
Schizophr Bull. 2017;43:32–43.
61. Steenhuis LA, Bartels-Velthuis AA, Jenner JA, et al. Religiosity in young adolescents with auditory vocal hallucinations.
Psychiatry Res. 2016;236:158–164.
62. Bentall R. Madness Explained: Psychosis and Human Nature. London, UK: Penguin; 2003.