EXTENDED REPORT
A genome-wide association study of rheumatoid
arthritis without antibodies against citrullinated
peptides
L Bossini-Castillo,
1C de Kovel,
2H Kallberg,
3,4R van
‘t Slot,
2A Italiaander,
2M Coenen,
5P P Tak,
6M D Posthumus,
7C Wijmenga,
8T Huizinga,
9A H M van der Helm-van Mil,
9G Stoeken-Rijsbergen,
9Luis Rodriguez-Rodriguez,
10Alejandro Balsa,
11Isidoro González-Álvaro,
12Miguel Ángel González-Gay,
13Carmen Gómez-Vaquero,
14B Franke,
5LifeLines Cohort Study, S Vermeulen,
5IE van der Horst-Bruinsma,
15B A C Dijkmans,
15G J Wolbink,
16R A Ophoff,
2M T Maehlen,
17P van Riel,
18M Merriman,
19L Klareskog,
3B A Lie,
17T Merriman,
19J B A Crusius,
20E Brouwer,
7J Martin,
1N de Vries,
6R Toes,
9L Padyukov,
3B P C Koeleman
2Handling editor Tore K Kvien ▸ Additional material is published online only. To view please visit the journal online (http://dx.doi.org/10.1136/ annrheumdis-2013-204591). For numbered affiliations see end of article.
Received 10 September 2013 Revised 23 January 2014 Accepted 24 January 2014 Published Online First 14 February 2014
To cite: Bossini-Castillo L, de Kovel C, Kallberg H, et al. Ann Rheum Dis 2015;74:e15.
ABSTRACT
Introduction Rheumatoid arthritis (RA) patients can be classified based on presence or absence of anticitrullinated peptide antibodies (ACPA) in their serum. This heterogeneity among patients may reflect important biological differences underlying the disease process. To date, the majority of genetic studies have focused on the ACPA-positive group. Therefore, our goal was to analyse the genetic risk factors that contribute to ACPA-negative RA.
Methods We performed a large-scale genome-wide association study (GWAS) in three Caucasian European cohorts comprising 1148 ACPA-negative RA patients and 6008 controls. All patients were screened using the Illumina Human Cyto-12 chip, and controls were genotyped using different genome-wide platforms. Population-independent analyses were carried out by means of logistic regression. Meta-analysis with previously published data was performed as follow-up for selected signals (reaching a total of 1922 ACPA-negative RA patients and 7087 controls). Imputation of classical HLA alleles, amino acid residues and single nucleotide polymorphisms was undertaken.
Results The combined analysis of the studied cohorts resulted in identification of a peak of association in the HLA-region and several suggestive non-HLA associations. Meta-analysis with previous reports confirmed the association of the HLA region with this subset and an observed association in the CLYBL locus remained suggestive. The imputation and deep interrogation of the HLA region led to identification of a two amino acid model (B at position 9 and HLA-DRB1 at position 11) that accounted for the observed genome-wide associations in this region.
Conclusions Our study shed light on the influence of the HLA region in ACPA-negative RA and identified a suggestive risk locus for this condition.
INTRODUCTION
Rheumatoid arthritis (RA) is a common auto-immune disease that is associated with a progressive loss of the joints induced by a chronic inflammation
of the joint synovium.1In this inflammatory
envir-onment, different products of cell apoptosis and necrosis accumulate, and citrullinated proteins can be detected.2 The production of anticitrullinated peptide/protein antibodies (ACPA) is a common but not essential characteristic of RA patients, which is
thought to be influenced by the genetic
back-ground. Indeed, a strong correlation exists between
ACPA and alleles of the HLA-DRB1 gene at
chromosome 6 known as the shared epitope
(SE).3 4 Hence, the presence or absence of ACPA
divides RA patients into two serological and clinical subgroups, ACPA positive (ACPA+) and ACPA negative (ACPA−) RA.
ACPA are highly specific for RA and appear years
before the first clinical manifestation of RA.5
Moreover, a number of studies have shown that ACPA+ patients suffer more aggressive radiological joint damage.6–9 It is worth mentioning that, the most recent RA diagnostic criteria proposed by the American College of Rheumatology (ACR) includes ACPA among the classification factors.10
Remarkably, different studies suggested the exist-ence of a partial genetic overlap between the ACPA− and the ACPA+ phenotypes, but evidence supporting important genetic differences is increasing.11 In line with this, a study by Viatteet al12reported that the
SE, a HLA-DRB1*0401 tag-single nucleotide
poly-morphism (SNP) and variants located in TNFAIP3,
GIN1/C5orf30, STAT4, ANKRD55/ IL6ST, BLK and PTPN22 showed significant associations with ACPA− RA patients. However, several RA susceptibility
factors showed no association with the ACPA−
subset, and those shared independently of the sero-type revealed different strength of association and effect size. Two high-throughput genotyping efforts, a genome-wide association study (GWAS) and a SNP-dedicated Immunochip-based dense mapping,
including ACPA− RA patients have been recently
carried out. The GWAS focused on the genetic
Clinical and epidemiological research
Bossini-Castillo L, et al. Ann Rheum Dis 2015;74:e15. doi:10.1136/annrheumdis-2013-204591 1 of 10
group.bmj.com
on November 29, 2016 - Published by
http://ard.bmj.com/
comparison of both serological RA subgroups.13 Although no
genome-wide level association with the ACPA− subset was
described, significant differences between ACPA+ and ACPA−
patients in the HLA region were apparent13 The Immunochip
approach revealed genome-wide level associations in the HLA
region and theANKRD55 locus with ACPA− RA, and supported
differences with the ACPA+ subgroup in several loci.14
Additionally, a fewloci have been associated with ACPA− RA but
not with ACPA+ RA, such asCLEC16A and IRF5 that have been
found following a candidate gene strategy.15 16 In spite of the
increasing interest in the identification of genetic risk factors asso-ciated with ACPA− RA, the underlying genetic background in this subset of RA patients remains widely unknown.17
The aim of this study was to identify novel susceptibilityloci implicated in ACPA− RA susceptibility through a hypothesis-free GWA strategy. Therefore, we carried out a genome-wide com-bined analysis of three independent Caucasian European cohorts, and a follow-up phase using a previously studied
GWAS cohort, comprising a total of 1922 ACPA− RA patients
and 7087 unaffected controls.
PATIENTS AND METHODS
Populations
All RA patients participating in this study met the 1987 ACR criteria for the classification of RA and were classified as ACPA−
using standard methods as described elsewhere.13 18 Control
populations comprised unaffected unrelated individuals from the same geographical and ethnical origin as cases. All indivi-duals in this study were of European ancestry (self-reported
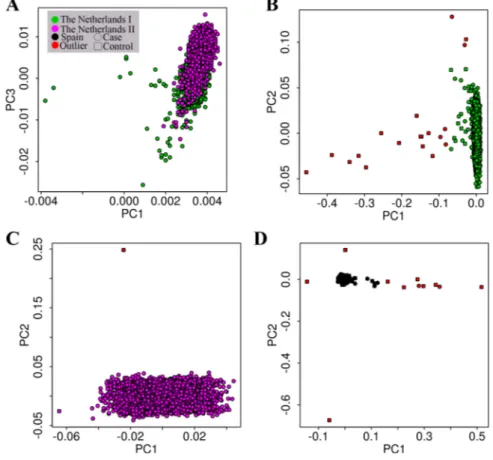
and/or principal component analysis (PCA) derived, figure 1).
This study was approved by the local ethics committees of the participating hospitals and all participating individuals gave written informed consent. A description of the analysed popula-tions is provided in online supplementary note 1.
The power to detect an association with an OR of 1.40 con-sidering 1922 cases and 7087 controls, at the p value <5×10⁻⁸ level, under an additive model and using a minor allele fre-quency (MAF) of 0.20 was of 96% (additional power calcula-tions are provided in online supplementary table S1). For power estimation we used Power Calculator for Genome Wide Studies.19
Genotyping and imputation
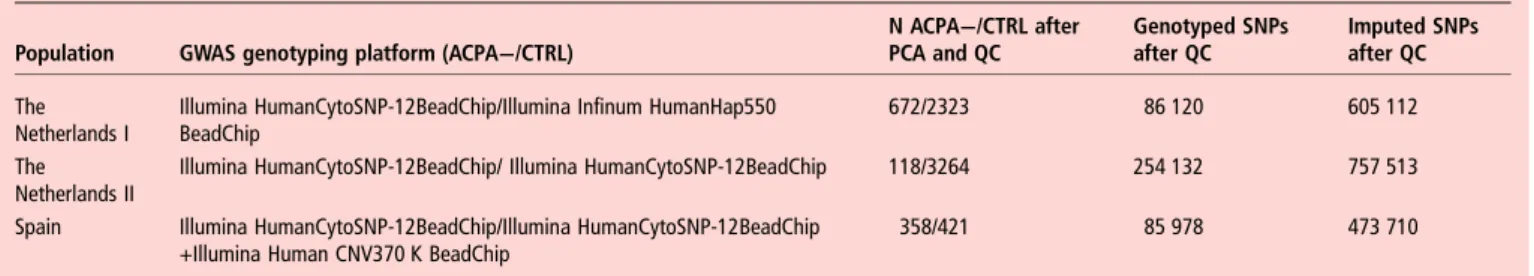
The genotyping platforms for The Netherlands I, The Netherlands II and Spain cohorts are described in table 1. Quality control (QC) and imputation was conducted separately for each cohort and each chip type, using a common approach for all datasets (details in online supplementary note 2) using
PLINK.20 The Swedish cohort genotyping and QC were
per-formed as described in Padyukovet al.13
After QC, a total of 452 367 genotyped or imputed SNPs were shared between The Netherlands I, The Netherlands II and the Spanish case-control series; and 363 330 genotyped or imputed SNPs were shared between the previously mentioned cohorts and the Swedish population in Padyukovet al.13
All SNP genotypes in the HLA region (chromosome 6 between the positions 29 000 000 and 34 000 000 reaching a
total of 3882 SNPs) underwent a specific HLA imputation
process as described in previous reports.21–23 This novel
approach resulted in the imputation of classical HLA genotypes
(HLA-A, HLA-B, HLA-C, HLA-DPA1, HLA-DPB1,
HLA-DQA1, HLA-DQB1 and HLA-DRB1), their corresponding amino acid sequences and SNPs (see online supplementary note 3 and table S2).21 23
STATISTICAL METHODS
The association of the imputed set of SNPs with ACPA− RA was tested by logistic regression, and this approach was followed
Figure 1 Principal component analysis (PCA) plot of the analysed European populations. (A) The Netherlands I versus The Netherlands II populations PC1 versus PC3 plot; (B) The Netherlands I population PC1 versus PC2; (C) The Netherlands II population PC1 versus PC2; (D) Spanish population PC1 versus PC2 population.
separately in each cohort using PLINK (Genomic inflation factors are shown in online supplementary note 4 and quantile-quantile (QQ) plots in supplementaryfigure S1). We carried out individual population PCA using EIGENSTRAT software in order to detect population substructure.24 25 Then, the associ-ation analyses for The Netherlands I, The Netherlands II and Spain cohorts were adjusted for population substructure by including thefirst 10 PCs of each population as covariates in the logistic regression (λThe Netherlands I=1.07; λThe Netherlands II=1.02;λSpain=1.07; see online supplementaryfigure S1).
A combined analysis using the inverse variance method under
a fixed effects model was performed on the basis of the
PCA-adjusted association results of The Netherlands I, The
Netherlands II and Spain cohorts using PLINK. The inflation
value for this analysis was λ=1.02. Heterogeneity across the
datasets was evaluated using Cochran’s Q test, and those loci showing a high heterogeneity (Q<0.05) were not considered for the validation step.
Non-HLA SNPs and showing a significant p value at a tier 2 association level ( p<5×10⁻⁵) in the combined analysis of The Netherlands I, The Netherlands II and Spain cohorts were selected for a validation step (table 2).
In the validation phase, a combined analysis of the previously
selected SNPs using the inverse variance method under afixed
effects model was performed using the association results of the three analysed populations and the ACPA− RA patients and
con-trols of the Swedish cohort in Padyukov et al.13 A p value
<5×10⁻⁶ was established as arbitrary threshold to consider a
SNP as a suggestive association in the meta-analysis.
Additionally,loci showing a high heterogeneity (Q<0.05) were discarded.
For the analysis of the imputed data in the HLA region, we performed the association analyses by means of unconditional and conditional logistic regression analysis to account for dependency between the observed signals (details in online sup-plementary note 3). Finally, we searched recursively for models which better explained all association present in the HLA region (see online supplementary note 3).
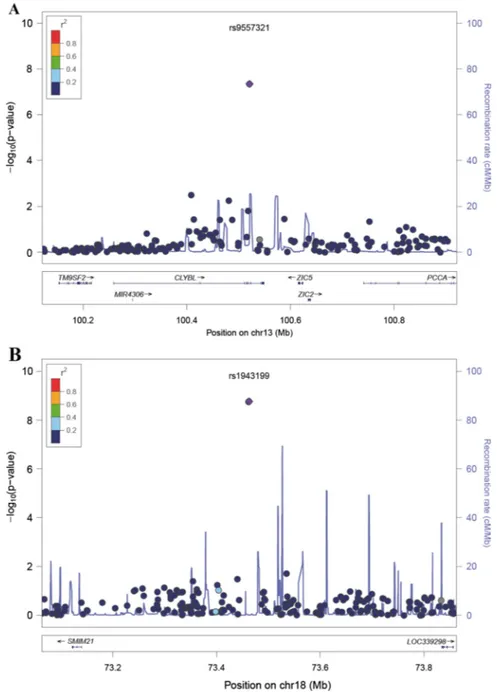
Regional plots were generated using LocusZoom, and the remainingfigures were generated using R V.2.15.1.26 27
RESULTS
Independent and combined analyses of three European ACPA− populations
Independent analysis of The Netherlands I, The Netherlands II and Spain cohorts showed no associations at genome-wide sig-nificance level (p<5×10⁻⁸) (see online supplementary figures
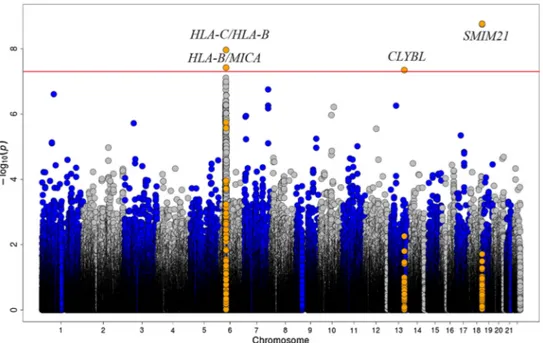
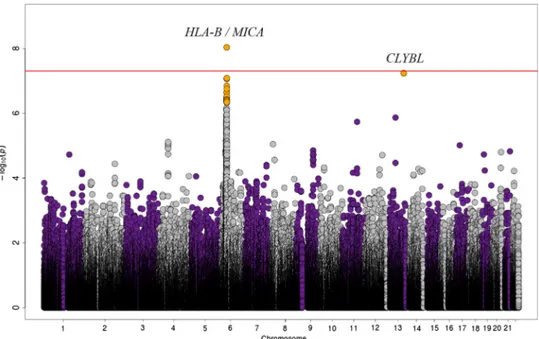
S2–S4). However, the combined analysis of the three cohorts
identified a SNP in the CLYBL locus and two in SMIM21
showing significant risk associations at this level (figure 2).
Moreover, 47 variants in 34 non-HLAloci showed a suggestive
p value <5×10⁻⁵ and no heterogeneity, and were selected for follow-up (table 2 andfigure 3). Additionally, the combined ana-lysis of the three cohorts resulted in a peak of association in the HLA region in chromosome 6.
HLA region deep interrogation
We further explored the association in the HLA region applying a new imputation method, which inferred the classical HLA alleles, polymorphic amino acid positions and SNPs in the studied populations.21 22After imputation, the most significant association corresponded with amino acid position 67 of the
HLA-DRβ1 molecule (p = 4.13×10⁻⁹, see online
supplemen-tary table S3). Three amino acids in this HLA-DRβ1 position
were observed in our population (leucine, Leu; isoleucine, Ile; phenylalanine, Phe), but only the Leu67 variant showed
genome-wide association ( p=9.41×10⁻¹⁰. Furthermore, three
additional amino acid residues showed a genome-wide level sig-nificant association in our study: two located in the HLA-DRB1 gene (the presence of threonine in the 181 amino acid position, Thr181, p value = 2.74×10⁻⁸, and the combination of serine, Ser, valine, Val and leucine, Leu, in the position 11,
SerValLeu11, p value = 4.27×10⁻⁸) and one in the HLA-B
locus (the presence of aspartic acid in the ninth position, Asp9, p value = 9.27×10⁻⁹). Moreover, these residues corresponded with the most associated amino acid positions in the omnibus test (see online supplementary note 3 and table S3). Then, we hypothesised that the association in the HLA region might be explained by polymorphic amino acid residues in the HLA molecules as observed in previous reports.14 21 22
Therefore, we performed step-wise conditional regression analysis including each of the four amino acid positions that had an amino acid residue reaching genome-wide level association.
These analyses identified two independent signals among the
selected amino acid positions: HLA-B at position 9 and HLA-DRB1 at position 11(see online supplementary table S4). After controlling for the two previously mentioned associations,
no signal showing a p<5×10⁻⁵ remained in the HLA region
(figure 4).
Additionally, we observed that the HLA-B*0801 allele was the only classical HLA allele associated at genome-wide level in our study. However, this allele was indistinguishable from the HLA-B Asp9 variant using conditional logistic regression, due to their high linkage disequilibrium (r2=0.996). Regarding the
HLA-DRB1 independent position, several classical HLA alleles share the genome-wide associated amino acid residues (see online supplementary note 5). Additionally, we confirmed that the hypothesis-free model was equivalent to the amino acid model, and addition of each amino acid variant to our model outperformed the model without it and achieved a better
Table 1 Study design
Population GWAS genotyping platform (ACPA−/CTRL)
N ACPA−/CTRL after PCA and QC Genotyped SNPs after QC Imputed SNPs after QC The Netherlands I
Illumina HumanCytoSNP-12BeadChip/Illumina Infinum HumanHap550 BeadChip
672/2323 86 120 605 112
The Netherlands II
Illumina HumanCytoSNP-12BeadChip/ Illumina HumanCytoSNP-12BeadChip 118/3264 254 132 757 513
Spain Illumina HumanCytoSNP-12BeadChip/Illumina HumanCytoSNP-12BeadChip +Illumina Human CNV370 K BeadChip
358/421 85 978 473 710
CTRL, control; GWAS, genome-wide association study; PCA, principal component analysis; QC, quality control; SNP, single nucleotide polymorphism.
Clinical and epidemiological research
Bossini-Castillo L, et al. Ann Rheum Dis 2015;74:e15. doi:10.1136/annrheumdis-2013-204591 3 of 10
group.bmj.com
on November 29, 2016 - Published by
http://ard.bmj.com/
Spain The Netherlands I The Netherlands II Combined Chr position (bp) SNP Locus P OR (CI) MAF ACPA −/CTRL P OR (CI) MAF ACPA −/CTRL P OR (CI) MAF ACPA −/CTRL PinvVar OR Q
1 (58 814 769) rs14008 TACSTD2* 1.43E-02 0.43 (0.22–0.85) 0.02/0.05 1.90E-05 0.50 (0.36–0.69) 0.04/0.07 0.95 0.98 (0.53–1.83) 0.05/0.05 7.40E-06 0.55 0.12
1 (81 205 529) rs6684037 LPHN2 0.10 0.66 (0.40–1.09) 0.04/0.06 1.17E-04 0.51 (0.36–0.72) 0.03/0.07 0.41 0.72 (0.34–1.55) 0.03/0.04 3.70E-05 0.57 0.56
1 (151 350 870) rs383582 SPRR2F 0.49 1.13 (0.80–1.60) 0.11/0.09 6.00E-06 1.63 (1.32–2.01) 0.13/0.09 0.40 1.19 (0.79–1.79) 0.11/0.10 2.52E-05 1.42 0.14
2 (234 061 305) rs10929178 USP40 0.20 1.24 (0.89–1.71) 0.13/0.10 5.62E-05 1.51 (1.24–1.84) 0.14/0.10 0.46 1.17 (0.78–1.74) 0.11/0.10 4.80E-05 1.39 0.39
3 (55 865 516) rs7609626 ERC2 4.22E-04 0.44 (0.28–0.70) 0.04/0.10 1.05E-03 0.60 (0.45–0.82) 0.05/0.08 0.30 0.68 (0.33–1.39) 0.04/0.05 1.91E-06 0.56 0.45
3 (64 112 733) rs929701 PRICKLE2 0.11 1.34 (0.93–1.93) 0.11/0.09 7.71E-04 1.43 (1.16–1.76) 0.13/0.10 0.06 1.44 (0.99–2.11) 0.14/0.11 3.23E-05 1.42 0.95
3 (65 270 367) rs13100540 ADAMTS9-AS2—MAGI1 0.23 1.15 (0.91–1.45) 0.33/0.30 6.70E-05 1.33 (1.15–1.52) 0.38/0.33 0.19 1.20 (0.92–1.57) 0.39/0.35 2.41E-05 1.26 0.54 3 (106 853 033) rs9857831 ALCAM—CBLB 1.10E-02 1.36 (1.07–1.72) 0.36/0.31 1.64E-02 1.19 (1.03–1.36) 0.37/0.33 1.07E-02 1.42 (1.08–1.85) 0.42/0.34 3.94E-05 1.26 0.40
4 (102 253 020) rs2732512 PPP3CA 0.12 1.42 (0.91–2.23) 0.07/0.05 1.26E-02 1.47 (1.09–2.00) 0.05/0.04 1.72E-03 2.09 (1.32–3.31) 0.09/0.05 4.67E-05 1.58 0.40
5 (126 163 281) rs17598783 LMNB1* 0.29 1.13 (0.90–1.42) 0.33/0.31 1.89E-03 1.24 (1.08–1.43) 0.36/0.32 2.61E-03 1.50 (1.15–1.96) 0.42/0.32 3.32E-05 1.26 0.27
5 (165 080 723) rs12657428 TENM2 9.32E-04 2.49 (1.45–4.27) 0.06/0.03 7.16E-04 1.77 (1.27–2.45) 0.05/0.03 0.92 1.03 (0.57–1.86) 0.05/0.05 2.61E-05 1.72 0.09
7 (9 537 527) rs6463923 NXPH1* 0.13 0.84 (0.68–1.05) 0.35/0.36 1.36E-06 0.71 (0.62–0.82) 0.33/0.41 0.35 0.88 (0.67–1.16) 0.36/0.39 1.14E-06 0.77 0.25
7 (19 498 740) rs10216141 TWISTNB 5.34E-03 2.29 (1.28–4.11) 0.05/0.02 3.57E-02 1.48 (1.03–2.13) 0.04/0.02 1.13E-02 2.06 (1.18–3.60) 0.06/0.03 4.53E-05 1.76 0.38
7 (108 372 672) rs848324 THAP5 3.67E-03 0.44 (0.25–0.77) 0.03/0.07 5.25E-04 0.55 (0.39–0.77) 0.04/0.06 0.99 0.99 (0.52–1.89) 0.04/0.04 4.29E-05 0.58 0.16
7 (140 342 281) rs38723 BRAF-MRPS33* 2.78E-03 0.42 (0.24–0.74) 0.03/0.06 2.70E-05 0.48 (0.34–0.68) 0.03/0.07 0.22 0.64 (0.31–1.31) 0.03/0.05 1.77E-07 0.49 0.67 7 (140 426 209) rs557962 Transmembrane protein
178-like 1.14E-04 0.40 (0.25–0.64) 0.04/0.09 2.19E-03 0.66 (0.50–0.86) 0.06/0.09 0.50 0.83 (0.49–1.42) 0.06/0.07 7.87E-06 0.61 0.09
8 (18 286 035) rs17642674 NAT1—NAT2 0.07 1.35 (0.98–1.86) 0.14/0.10 3.61E-03 1.35 (1.10–1.65) 0.13/0.10 1.16E-02 1.59 (1.11–2.27) 0.16/0.11 2.90E-05 1.39 0.72
9 (120 110 400) rs7047525 TLR4* 3.25E-02 0.72 (0.54–0.97) 0.15/0.18 1.99E-04 0.67 (0.54–0.83) 0.10/0.15 0.12 0.68 (0.42–1.11) 0.08/0.12 5.70E-06 0.69 0.92
10 (69 579 808) rs10997948 MYPN* 3.75E-02 1.57 (1.03–2.40) 0.08/0.05 3.46E-05 1.64 (1.30–2.07) 0.10/0.07 0.10 1.41 (0.93–2.14) 0.11/0.08 1.07E-06 1.58 0.83
10 (72 178 560) rs7921298 ADAMTS14 2.98E-02 0.52 (0.29–0.94) 0.03/0.05 5.21E-04 0.55 (0.40–0.77) 0.04/0.06 0.13 0.50 (0.21–1.24) 0.02/0.04 1.35E-05 0.54 0.97
10 (84 025 408) rs4329625 NRG3 8.90E-04 2.58 (1.48–4.52) 0.06/0.03 3.88E-04 1.96 (1.35–2.84) 0.04/0.02 0.11 1.63 (0.89–3.00) 0.05/0.03 6.10E-07 2.02 0.54
11 (60 123 089) rs7927817 MS4A13—MR_026 946.1 0.10 1.36 (0.95–1.95) 0.11/0.09 1.39E-05 1.52 (1.26–1.83) 0.16/0.11 0.96 0.99 (0.68–1.45) 0.13/0.13 2.48E-05 1.39 0.14 11 (63,641,881) rs3824854 FLRT1 4.71E-02 1.29 (1.00–1.66) 0.26/0.22 4.62E-03 1.29 (1.08–1.53) 0.19/0.16 2.10E-02 1.46 (1.06–2.02) 0.21/0.15 4.18E-05 1.32 0.78
11 (88,307,788) rs518167 GRM5 9.12E-03 2.55 (1.26–5.14) 0.04/0.02 5.66E-04 2.22 (1.41–3.49) 0.03/0.01 0.21 1.66 (0.75–3.66) 0.03/0.02 9.68E-06 2.17 0.72
12 (78,361,110) rs7959721 SYT1 0.97 1.01 (0.48–2.13) 0.02/0.02 1.53E-06 2.55 (1.74–3.74) 0.04/0.02 0.39 1.34 (0.68–2.65) 0.04/0.03 2.50E-05 1.92 0.05
13 (50 474 171) rs3790022 RNASEH2B-FAM124A 1.19E-03 0.51 (0.34–0.77) 0.06/0.10 4.60E-04 0.62 (0.48–0.81) 0.06/0.08 0.08 0.53 (0.26–1.08) 0.03/0.06 5.56E-07 0.58 0.69
13 (99 319 102) rs9557321 CLYBL 0.08 1.62 (0.94–2.77) 0.05/0.04 4.33E-07 2.08 (1.57–2.77) 0.07/0.04 0.07 1.48 (0.97–2.28) 0.11/0.08 4.51E-08 1.83 0.38
16 (60 319 776) rs16963882 CDH8 4.36E-02 0.71 (0.51–0.99) 0.10/0.14 9.02E-05 0.67 (0.55–0.82) 0.12/0.16 0.80 0.95 (0.64–1.41) 0.13/0.14 3.62E-05 0.72 0.30
17 (23 876 812) rs598858 FOXN1 0.22 1.42 (0.81–2.50) 0.05/0.03 2.45E-05 1.85 (1.39–2.47) 0.07/0.04 0.10 1.49 (0.93–2.37) 0.08/0.06 4.50E-06 1.69 0.59
17 (43 952 192) rs11651168 SKAP1—HOXB1* 3.07E-02 0.79 (0.64–0.98) 0.44/0.50 5.45E-04 0.79 (0.69–0.90) 0.45/0.51 0.14 0.82 (0.63–1.07) 0.42/0.48 1.46E-05 0.80 0.98 18 (71 591 842) rs1943199 SMIM21* 2.01E-03 2.84 (1.47–5.51) 0.05/0.02 1.54E-07 2.66 (1.85–3.84) 0.05/0.02 0.12 1.53 (0.90–2.61) 0.07/0.05 1.73E-09 2.33 0.20
19 (57 624 232) rs8182486 ZNF534 2.52E-02 1.58 (1.06–2.36) 0.10/0.06 3.44E-04 1.62 (1.25–2.12) 0.07/0.05 0.45 1.20 (0.75–1.91) 0.08/0.07 3.49E-05 1.53 0.53
20 (51 981 774) rs6013838 BCAS1 0.09 0.55 (0.27–1.11) 0.02/0.04 7.71E-05 0.40 (0.26–0.63) 0.02/0.04 0.51 0.68 (0.21–2.17) 0.01/0.02 2.33E-05 0.46 0.61
22 (21 946 433) rs12166802 BCR (Breakpoint Cluster
Region) 5.48E-03 2.18 (1.26–3.78) 0.06/0.03 2.60E-03 1.62 (1.18–2.22) 0.05/0.04 0.30 1.39 (0.74–2.60) 0.05/0.03 4.66E-05 1.68 0.53
Controls are used as reference for all comparisons. The genome-wide significant p value is shown in bold.
CTRL, control; MAF, minor allele frequency; OR, OR for the minor allele; p, logistic regression p value including 10 PC as covariates; PInvVar, inverse variance fixed effects combined-analysis p value; Q, Cochran Q test p value.
*Multiple signals fulfilling the selection criteria in the locus, the reported variant corresponds with the most strongly associated polymorphism.
and
e
pidemiological
resear
ch
Bossini-Cas tillo L, et al . Ann Rheum Dis 2015; 74 :e15. doi:10.1136/an nrheumdis-20 13-204591 group.bmj.com on November 29, 2016 - Published by http://ard.bmj.com/ Downloaded fromgoodness-of-fit (table 3 and see online supplementary note 3).
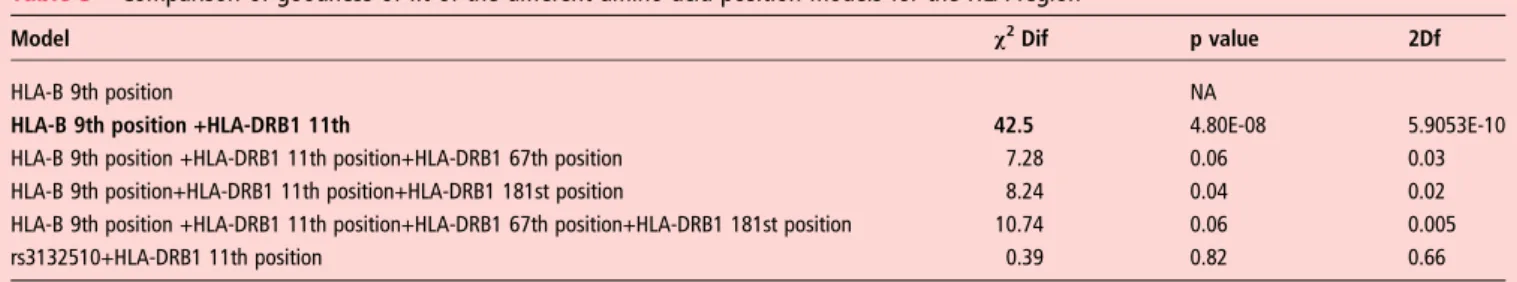
We also confirmed that the model including the two
independ-ent amino acid variants was the most parsimonious explanation for our data, and the addition of the remaining amino acids did not lead to a better goodness-of-fit (table 3).
Follow-up meta-analysis
After imputation, 363 330variants were shared among all three previously described European populations and the Swedish cohort described in Padyukovet al.13 Thefinal set of 452 367
SNPs analysed in our cohorts tagged (with r2>0.8) a 52.37% of the SNPs with MAF>0.05 included in the HapMap phase 3 Caucasian of EUropean Ancestry (CEU) population and 51.63% of the SNPs in the CEU/Tuscans in Italy (TSI) populations (fol-lowing the same parameters). As it can be observed infigure 5 and table 4, the variant inCLYB that previously showed wide level association (rs9557321) did not reach the genome-wide significance threshold after meta-analysis but maintained a
suggestive association ( p value=5.82×10⁻⁸ OR=1.73). In the
case of the genome-wide level associations in theSMIM21 locus
(rs1943199, rs11663465), significant heterogeneity was found in the meta-analyses (Q<0.05) and the SNPs were discarded from analysis. Additionally, 30 out of 34loci selected for the follow-up phase were shared between the genotyped and the Swedish popu-lations, and two of them,CLYBL and SMIM21, were still signifi-cant considering a p value <5×10⁻⁶in the meta-analysis (figure 3, regional plots are given infigure 2). The variants showing tier 2 associations were rs518167 (located in the 2nd intron of the GRM5 gene) and rs3790022 (located in the RNASEH2B-FAM124A intergenic region, ie, GUCY1B2 pseudogene) (table 4 and see online supplementary table S5).
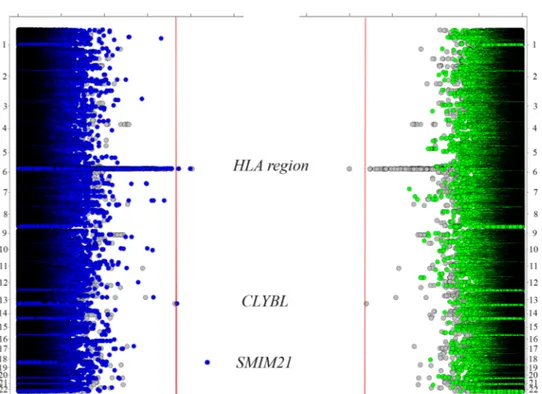
Regarding the HLA region, no classical HLA allele informa-tion was available for the Swedish cohort, and unfortunately, our two-variant models could not be tested in this cohort. Nevertheless, the genome-wide associated variant in the HLA class I region, rs2596565, was included in the combined ana-lysis, showed nominal association in the Swedish cohort
( p=2.12×10⁻² OR=1.24) and was the only SNP showing
genome-wide significance in the HLA region (p=9.26×10⁻⁹
OR=1.4) (figure 6).
Figure 2 Regional association plots showing (A) the CLYBL locus (B) the SMIM21 locus.
Clinical and epidemiological research
Bossini-Castillo L, et al. Ann Rheum Dis 2015;74:e15. doi:10.1136/annrheumdis-2013-204591 5 of 10
group.bmj.com
on November 29, 2016 - Published by
http://ard.bmj.com/
Five out of 7loci previously associated with ACPA− RA by
Viatte et al12 were properly covered in our study (directly
included or tagged by a variant showing r2>0.8). For theseloci, we observed trends of association ( p<0.05) in the TNFAIP3, GIN1/C5orf30 and PTPN22 loci (see online supplementary
table S6). In the case of the HLA-DRB1* 04 : 01 tag-SNP, a
trend association was observed, but the meta-analysis showed
significant heterogeneity. Thus, we applied a random effects
model and the initial association was lost (see online supplemen-tary table S6).
The previously reported variant of CLEC16A (rs6498169)
was filtered out from the current analyses during QC, but the
most strongly associated variant located in the gene showed a nominal association in the combined analysis (rs17803698
p=2.12×10⁻² OR=1.14, r2=0.12).15 In the case of
TNPO3-IRF5 region, we selected variants from Viatte et al12
and Sigurdssonet al16that were included in the combined ana-lysis. The rs12531711 showed a remarkably strong association
with ACPA− RA in the combined analysis (p=4.35×10⁻⁵
OR=1.30).
DISCUSSION
This report comprises the largest ACPA− RA cohort genotyped
and analysed with a genome-wide platform to date (1922 ACPA − RA patients and 7087 non-affected controls). Our study iden-tified a suggestive new risk factor for this condition, (CLYBL),
confirmed the association of the HLA region with this subset
and proposed a two-variant model including the HLA-DRB1
andHLA-B loci to explain the observed HLA association peak.
Thefirst GWAS that focused on the ACPA+ versus ACPA−
genetic differences did not show evidence for an association of
ACPA− RA with the HLA region in a cohort of Swedish RA
patients.13 Nevertheless, recent reports have suggested a
previ-ously unidentified role for the HLA region.12 14 Taking into account that the Immunochip platform includes a dense mapping of the HLA region, and that the cohorts analysed in the present study are partially overlapping with the populations
in Eyreet al, we consider that the resemblance of the results in
genome-wide and Immunochip platforms confirm previous
find-ings, and indicate that the coverage of the HLA region in our study was appropriate.14Moreover, in Eyreet al, the five-amino
acid model which was described by Raychaudhuri et al21 and
accounted for the observed association in the HLA region was
confirmed.14 Nevertheless, this novel HLA allele and amino
acid residue imputation approach was not applied separately in
the ACPA− group. In our ACPA− study, we used this approach
to detect two-amino acid position (HLA-B at position 9 and HLA-DRB1 at position 11), as the most parsimonious model explaining the observed association in the HLA region in our data. The two of the identified amino acid position, HLA-DRB1 11th amino acid and HLA-B 9th amino acid, were located in the peptide binding groove of their corresponding HLA
mole-cules.21 Moreover, both amino acid positions were shared
between our model and the ACPA+ RA model proposed by Raychaudhuriet al21 and confirmed by Eyre et al14 However,
no significant association was found for the SE variants or other ACPA+-related HLA-DRB1 amino acid positions (HLA-.DRB1 13, 71 and 74 positions), which can be due to real association divergences in these subgroups. Moreover, given the observed
association of HLA-B, it can be hypothesised that HLA class
I has a more relevant role in ACPA− RA than in ACPA+ RA,
while the HLA class II association seems more predominant ACPA+ RA. However, the partial overlap and the differences between the proposed HLA models for both RA serological sub-groups would require further studies to clarify if the HLA-DRB1 and HLA-B signals belong to both RA subgroups or are restricted to ACPA+ or ACPA−, respectively. Additionally, individuals showing borderline ACPA titres and seroconversion from negative to positive ACPA is a rare event (only 2%), but it may act as a confounding factor.28
In relation to the novel candidate association with a SNP in
the CLYBL gene, although the signal is slightly below the
genome-wide significance level, our findings might support
future studies to clarify the veracity of this association.CLYBL
Figure 3 Manhattan plot of the genome-wide association study (GWAS) of the three European cohorts comprising 1148 anti-citrullinated peptide antibodies-Rheumatoid arthritis (ACPA- RA) cases and 6008 healthy controls (The Netherlands I, The Netherlands II and Spanish populations). The −log10 of the inverse variance test p value of 452 367 SNPs is plotted against its physical chromosomal position. Chromosomes are shown in alternate colours. SNPs above the red line represent those with a p value <5×10⁻⁸and variants in GWAS level loci are shown in orange.
encodes a citrate lyase subunit β-like protein which has citrate ( pro-3S)-lyase and ion-binding activities that are transported to the mitochondria. Interestingly, a SNP in theCLYBL locus has
been recently associated with low serum levels of vitamin B12
(also known as cyanocobalamin).29 30 Although the relation
between CLYBL and the vitamin B12 serum levels remains
Figure 4 Manhattan plots showing the results of the unconditioned and conditioned analyses of the imputed HLA region. (A) Unconditioned analysis of the HLA region. (B) Conditional analysis controlling for the independent association of the 9th amino acid position at HLA-B. (C) Conditional analysis controlling for the previously mentioned association in the 9th amino acid position at HLA-B and the independent association of the 11th amino acid position at HLA-DRB1.
Table 3 Comparison of goodness-of-fit of the different amino acid position models for the HLA region
Model χ2Dif p value 2Df
HLA-B 9th position NA
HLA-B 9th position +HLA-DRB1 11th 42.5 4.80E-08 5.9053E-10
HLA-B 9th position +HLA-DRB1 11th position+HLA-DRB1 67th position 7.28 0.06 0.03
HLA-B 9th position+HLA-DRB1 11th position+HLA-DRB1 181st position 8.24 0.04 0.02
HLA-B 9th position +HLA-DRB1 11th position+HLA-DRB1 67th position+HLA-DRB1 181st position 10.74 0.06 0.005
rs3132510+HLA-DRB1 11th position 0.39 0.82 0.66
The goodness-of-fit for each model was compared with the previous one. Best fitting model in bold.
χ2Dif, improvement in the goodness of fit (by calculating the deviance, defined as−2 × the log likelihood, and following a χ2distribution of the model compared with the preceding
one; p value, p value for the model comparison.
*Comparison between the hypothesis free model and the amino acid model.
Clinical and epidemiological research
Bossini-Castillo L, et al. Ann Rheum Dis 2015;74:e15. doi:10.1136/annrheumdis-2013-204591 7 of 10
group.bmj.com
on November 29, 2016 - Published by
http://ard.bmj.com/
unclear, a link between vitamin B12 and RA has been described. In a report by Regalet al, 24% of RA patients had low vitamin
B12 serum levels and 26% of them had true vitamin B12 de
fi-ciency.31 Besides, a previous study described that RA patients with vitamin B12 deficiency, folate deficiency, vitamin B6 defi-ciency and impaired renal function showed associated hyperho-mocysteinemia that may have a role in promoting high
cardiovascular morbidity in patients with RA.32 Moreover, sig-nificant associations with the familial risk of RA in offspring according to parental proband were reported for pernicious anaemia, which is usually the result of intrinsic factor insuf fi-cient secretion and consequent vitamin B12 deficiency.33
Additionally, the design of our study led to some limitations mainly due to the variety of genotyping platforms used.
Figure 5 Manhattan plot showing the meta-analysis comprising 1922 cases and 7087 controls from all the studied populations (The Netherlands I, The Netherlands II, Spain and Sweden populations). The−log10 of the inverse variance test p value of 363 330 SNPs is plotted against its physical chromosomal position. Chromosomes are shown in alternate colours. SNPs above the red line represent those with a p value <5×10⁻⁸ and variants in genome-wide association study level loci are shown in orange.
Table 4 Previously selected non-HLA SNPs showing a p value <5×10⁻⁶and HLA SNPs showing a p value <5×10⁻⁷in the inverse variance meta-analysis of all the cohorts included the study
CHR BP SNP Locus PInvVar OR Q
Non-HLA loci 11 88 307 788 rs518167 GRM5 1.84E-06 2.24 0.74
13 50 474 171 rs3790022 RNASEH2B-FAM124A 1.36E-06 0.67 0.18
13 99 319 102 rs9557321 CLYBL 5.82E-08 1.73 0.32
HLA loci 6 31 202 682 rs3130557 PSOR1C1 3.33E-07 1.35 0.36
6 31 443 433 rs2844573 HLA-B/MICA 3.88E-07 1.25 0.59 6 31 456 056 rs9266669 HLA-B/MICA 2.27E-07 1.34 0.41 6 31 461 308 rs2596565 HLA-B/MICA 9.26E-09 1.4 0.17 6 31 542 600 rs3131618 MICA/MICB 8.63E-08 1.39 0.19 6 31 573 026 rs3094005 MICA/MICB 4.61E-07 1.35 0.26 6 31 613 459 rs2734583 DDX39B 4.46E-07 1.35 0.28 6 31 820 175 rs3132445 MSH5 3.79E-07 1.36 0.06 6 31 823 861 rs3130484 MSH5 3.89E-07 1.36 0.06 6 31 829 012 rs3131379 MSH5 3.05E-07 1.37 0.06 6 31 833 209 rs3117574 MSH5 3.80E-07 1.36 0.06 6 31 833 264 rs3131378 MSH5 3.90E-07 1.36 0.06 6 31 834 232 rs3117575 MSH5 3.96E-07 1.36 0.06 6 31 835 453 rs3117577 MSH5 3.89E-07 1.36 0.07 6 31 835 876 rs3115672 MSH5 4.22E-07 1.36 0.07 6 31 915 519 rs3130679 C6orf48 4.57E-07 1.36 0.06 6 31 986 412 rs519417 C2 8.67E-08 1.38 0.06 6 32 000 463 rs497309 C2 1.44E-07 1.37 0.06 6 32 048 876 rs389884 STK9 8.32E-08 1.39 0.05 6 32 167 845 rs1150753 TNXB 1.77E-07 1.38 0.05 6 32 691 720 rs9271348 HLA-DRB1/HLA-DQA1 4.79E-07 0.78 0.31
Controls are used as reference for all comparisons.
Therefore, some associations might have been overlooked due to a limited coverage in the region despite the imputation step (ie, theANKRD55/IL6ST locus). In spite of the large size of the
ACPA− patient cohort, our study might have been
underpow-ered to detect modest associations. Additionally, our conclusions may be applicable only in populations of European ancestry.
The present report analysed the genetic component of a large
cohort of ACPA− RA patients compared to non-affected
con-trols following a genome-wide strategy, replicated previous
find-ings in different non-HLA loci, such as TNFAIP3, GIN1/
C5orf30, PTPN22, CLEC16A and TNPO3/IRF5, and revealed a
novel suggestive susceptibility gene, CLYBL. Moreover, our
study provided a deep insight into the influence of the HLA
region in ACPA− RA and identified a two-amino acid residue
model explaining this association. The present study together
with previous evidence supported the existence of an
ACPA-specific genetic component, and highlighted the
import-ance of comprehensive genetic analysis of large ACPA− cohorts. Author affiliations
1Instituto de Parasitología y Biomedicina López-Neyra, Consejo Superior de
Investigaciones Científicas (IPBLN-CSIC), Granada, Spain
2Department of Medical Genetics, UMCU, Utrecht, The Netherlands 3
Rheumatology Unit, Department of Medicine, Karolinska University Hospital, Karolinska Institutet, Stockholm, Sweden
4
Institute of Environmental Medicine, Karolinska Institutet, Sweden
5Department of Human Genetics, Radboud University Nijmegen Medical Centre,
Nijmegen, The Netherlands
6Division of Clinical Immunology and Rheumatology, AMC, University of Amsterdam,
Amsterdam, The Netherlands
7Department of Rheumatology, UMCG, Groningen, The Netherlands 8
Department of Medical Genetics, UMCG, Groningen, The Netherlands
9Department of Rheumatology, LUMC, Leiden, The Netherlands 10
Rheumatology Service, Hospital Clínico San Carlos, Madrid, Spain
11Rheumatology Service, Hospital Universitario La Paz, Madrid, Spain 12
Rheumatology Service, Hospital Universitario La Princesa, Instituto de Investigación Sanitaria La Princesa, Madrid, Spain
13
Rheumatology Service, Hospital Universitario Marqués de Valdecilla, IFIMAV, Santander, Spain
14
Rheumatology Service, Hospital Universitari Bellvitge, Barcelona, Spain
15Department of Rheumatology, VUMC, Amsterdam, The Netherlands 16Jan van Breemen Research Institute, Amsterdam, The Netherlands 17
Department of Medical Genetics; University of Oslo and Oslo University, hospital, Oslo, Norway; K. G. Jebsen Inflammation Research Centre, University of Oslo, Oslo, Norway
18Department of Rheumatology, Radboud University Nijmegen Medical Centre,
Nijmegen, The Netherlands
19Department of Biochemistry, University of Otago, New Zealand
20Laboratory of Immunogenetics, Department of Medical Microbiology and Infection
Control, VU University Medical Center, Amsterdam, The Netherlands
Correction notice This article has been corrected since it was published Online First. The initials and family names of some authors were in inverse order, such that family name was listedfirst followed by the initials; these have been corrected. Acknowledgements We thank Sofía Vargas and Sonia García for their excellent technical assistance. We thank Banco Nacional de ADN (University of Salamanca, Spain), which supplied part of the control DNA samples, and we thank all patients and donors for their collaboration. Principal investigators of the Nijmegen Biomedical Study are LALM Kiemeney, M den Heijer, ALM Verbeek, DW Swinkels and B Franke. Contributors MJHC, PPT, MDP, AZ, TH, AHMHM, GSR, LRR, AB, IGA, M AGG, CGV, SHV, BF, LLCS, IEHB, BACD, GJW, RAO, JF, PLCMR, LK, JBAC, EB, NV, RT, JM, and LP provided samples and clinical information, or control genotypes. BPCK, LP, LK, JM, NV, RT, designed the GWAS. LBC, CK, HK RS, AI performed genotyping quality control and association analyses of the GWAS data. The paper was written by LBC, CK and BPCK with contributions from all other authors. BPCK and CK coordinated the genotyping, analysis, and manuscript writing efforts for this study. Funding This work was supported by the Dutch Arthritis Foundation (grant DAA 0901069) a Spanish grant from RETICS Program, RD12/0009/0004 (RIER) from Instituto de Salud Carlos III (ISCIII) and also by the grant BTCure for Rheumatoid Arthritis from the European IMI Program. Genotyping of the Dutch control samples was sponsored by US National Institutes of Mental Health funding, R01 MH078075 (ROA)
Competing interests None. Patient consent Obtained.
Ethics approval Ethics Committee of participating academic centers. Provenance and peer review Not commissioned; externally peer reviewed.
REFERENCES
1 McInnes IB, Schett G. The pathogenesis of rheumatoid arthritis. N Engl J Med 2011;365:2205–19.
Figure 6 Twin Manhattan plot showing the results of the combined analysis of the three European cohorts (left, dark blue), the Swedish cohort (right, green) and the meta-analysis of all the available cohorts (both sides, grey).
Clinical and epidemiological research
Bossini-Castillo L, et al. Ann Rheum Dis 2015;74:e15. doi:10.1136/annrheumdis-2013-204591 9 of 10
group.bmj.com
on November 29, 2016 - Published by
http://ard.bmj.com/
2 van Venrooij WJ, van Beers JJ, Pruijn GJ. Anti-CCP antibodies: the past, the present and the future. Nat Rev Rheumatol 2011;7:391–8.
3 Huizinga TW, Amos CI, van der Helm-van Mil AH, et al. Refining the complex rheumatoid arthritis phenotype based on specificity of the HLA-DRB1 shared epitope for antibodies to citrullinated proteins. Arthritis Rheum 2005;52:3433–8. 4 Lundstrom E, Kallberg H, Alfredsson L, et al. Gene-environment interaction between
the DRB1 shared epitope and smoking in the risk of anti-citrullinated protein antibody-positive rheumatoid arthritis: all alleles are important. Arthritis Rheum 2009;60:1597–603.
5 van Gaalen FA, Linn-Rasker SP, van Venrooij WJ, et al. Autoantibodies to cyclic citrullinated peptides predict progression to rheumatoid arthritis in patients with undifferentiated arthritis: a prospective cohort study. Arthritis Rheum 2004;50:709–15.
6 Aho K, Heliovaara M, Maatela J, et al. Rheumatoid factors antedating clinical rheumatoid arthritis. J Rheumatol 1991;18:1282–4.
7 Nielen MM, van Schaardenburg D, Reesink HW, et al. Specific autoantibodies precede the symptoms of rheumatoid arthritis: a study of serial measurements in blood donors. Arthritis Rheum 2004;50:380–6.
8 Rantapaa-Dahlqvist S, de Jong BA, Berglin E, et al. Antibodies against cyclic citrullinated peptide and IgA rheumatoid factor predict the development of rheumatoid arthritis. Arthritis Rheum 2003;48:2741–9.
9 van der Helm-van Mil AH, Verpoort KN, Breedveld FC, et al. Antibodies to citrullinated proteins and differences in clinical progression of rheumatoid arthritis. Arthritis Res Ther 2005;7:R949–58.
10 Aletaha D, Neogi T, Silman AJ, et al. 2010 rheumatoid arthritis classification criteria: an American College of Rheumatology/European League Against Rheumatism collaborative initiative. Ann Rheum Dis 2010;69:1580–8.
11 Kurreeman F, Liao K, Chibnik L, et al. Genetic basis of autoantibody positive and negative rheumatoid arthritis risk in a multi-ethnic cohort derived from electronic health records. Am J Hum Genet 2011;88:57–69.
12 Viatte S, Plant D, Bowes J, et al. Genetic markers of rheumatoid arthritis susceptibility in anti-citrullinated peptide antibody negative patients. Ann Rheum Dis
2012;71:1984–90.
13 Padyukov L, Seielstad M, Ong RT, et al. A genome-wide association study suggests contrasting associations in ACPA-positive versus ACPA-negative rheumatoid arthritis. Ann Rheum Dis 2011;70:259–65.
14 Eyre S, Bowes J, Diogo D, et al. High-density genetic mapping identifies new susceptibility loci for rheumatoid arthritis. Nat Genet 2012;44:1336–40. 15 Skinningsrud B, Lie BA, Husebye ES, et al. A CLEC16A variant confers risk for
juvenile idiopathic arthritis and anti-cyclic citrullinated peptide antibody negative rheumatoid arthritis. Ann Rheum Dis 2010;69:1471–4.
16 Sigurdsson S, Padyukov L, Kurreeman FA, et al. Association of a haplotype in the promoter region of the interferon regulatory factor 5 gene with rheumatoid arthritis. Arthritis Rheum 2007;56:2202–10.
17 Perricone C, Ceccarelli F, Valesini G. An overview on the genetic of rheumatoid arthritis: a never-ending story. Autoimmun Rev 2011;10:599–608.
18 Arnett FC, Edworthy SM, Bloch DA, et al. The American Rheumatism Association 1987 revised criteria for the classification of rheumatoid arthritis. Arthritis Rheum 1988;31:315–24.
19 Skol AD, Scott LJ, Abecasis GR, et al. Joint analysis is more efficient than replication-based analysis for two-stage genome-wide association studies. Nat Genet 2006;38:209–13.
20 Purcell S, Neale B, Todd-Brown K, et al. PLINK: a tool set for whole-genome association and population-based linkage analyses. Am J Hum Genet 2007;81:559–75.
21 Raychaudhuri S, Sandor C, Stahl EA, et al. Five amino acids in three HLA proteins explain most of the association between MHC and seropositive rheumatoid arthritis. Nat Genet 2012;44:291–6.
22 Achkar JP, Klei L, de Bakker PI, et al. Amino acid position 11 of HLA-DRbeta1 is a major determinant of chromosome 6p association with ulcerative colitis. Genes Immun 2012;13:245–52.
23 Jia X, Han B, Onengut-Gumuscu S, et al. Imputing amino Acid polymorphisms in human leukocyte antigens. PLoS ONE 2013;8:e64683.
24 Patterson N, Price AL, Reich D. Population structure and eigenanalysis. PLoS Genet 2006;2:e190.
25 Price AL, Patterson NJ, Plenge RM, et al. Principal components analysis corrects for stratification in genome-wide association studies. Nat Genet 2006;38:904–9. 26 Pruim RJ, Welch RP, Sanna S, et al. LocusZoom: regional visualization of
genome-wide association scan results. Bioinformatics 2010;26:2336–7. 27 Team RC. R: A language and environment for statistical computing. R Foundation
for Statistical Computing 2012.
28 Ursum J, Bos WH, van Dillen N, et al. Levels of anti-citrullinated protein antibodies and IgM rheumatoid factor are not associated with outcome in early arthritis patients: a cohort study. Arthritis Res Ther 2010;12:R8.
29 Lin X, Lu D, Gao Y, et al. Genome-wide association study identifies novel loci associated with serum level of vitamin B12 in Chinese men. Hum Mol Genet 2012;21:2610–17.
30 Grarup N, Sulem P, Sandholt CH, et al. Genetic architecture of vitamin B12 and folate levels uncovered applying deeply sequenced large datasets. PLoS Genet 2013;9:e1003530.
31 Segal R, Baumoehl Y, Elkayam O, et al. Anemia, serum vitamin B12, and folic acid in patients with rheumatoid arthritis, psoriatic arthritis, and systemic lupus erythematosus. Rheumatol Int 2004;24:14–19.
32 Pettersson T, Friman C, Abrahamsson L, et al. Serum homocysteine and methylmalonic acid in patients with rheumatoid arthritis and cobalaminopenia. J Rheumatol 1998;25:859–63.
33 Hemminki K, Li X, Sundquist J, et al. Familial associations of rheumatoid arthritis with autoimmune diseases and related conditions. Arthritis Rheum 2009;60: 661–8.