Scuola di Dottorato di Ricerca in SCIENZE
Curriculum BIOLOGIA ed ECOLOGIA MARINA
XIV° ciclo n.s.
Molecular analysis of marine benthic biodiversity:
methodological implementations and perspectives
Tesi di Dottorato di:
Tutor:
Laura
Carugati
Prof. Roberto Danovaro
Co-Tutor:
Prof. Antonio Dell’Anno
2
Index
RIASSUNTO ... 3
ABSTRACT ... 4
CHAPTER 1. INTRODUCTION ... 5
1.1 A comparison of the degree of implementation of marine biodiversity indicators by European countries in relation to the MSFD ... 13
1.2 Indicator-based assessment of marine biological diversity – lessons from 10 case studies across the European Seas ... 39
CHAPTER 2. METHODOLOGICAL IMPLEMENTATION ... 92
2.1 Implementing and innovating marine monitoring approaches for the assessment of the environmental status ... 92
2.2 Metagenetic tools for the census of marine meiofaunal biodiversity: An overview ... 149
CHAPTER 3. IMPLEMENTATION OF METAGENETIC ANALYSIS OF MEIOFAUNAL BIODIVERSITY ... 180
3.1 Sensitivity of metagenetic analysis of meiofaunal biodiversity ... 180
3.2 Unveiling the Biodiversity of Deep-Sea Nematodes through Metabarcoding: Are We Ready to Bypass the Classical Taxonomy? ... 201
CHAPTER 4. CASE STUDY AND APPLICATION TO MEIOBENTHIC BIODIVERSITY ... 234
4.1 Meiofaunal biodiversity in the Ross Sea continental shelf, Antarctica ... 234
CHAPTER 5. CONCLUSIONS ... 259
5.1 Perspectives in the use of molecular tools for the analysis of marine benthic biodiversity ... 259
3
RIASSUNTO
La biodiversità marina regola il funzionamento ecosistemico, responsabile della produzione di beni e servizi importanti per la biosfera e il benessere umano. La stima della biodiversità è uno degli obiettivi fondamentali della scienza. I cambiamenti globali e le attività antropiche stanno avendo un impatto crescente sugli ecosistemi. Le valutazioni d'impatto e i programmi di monitoraggio si basano su specie di grandi dimensioni, trascurando gli organismi di piccola taglia come la meiofauna (20-500 µm), a causa delle difficoltà connesse con la tradizionale identificazione morfologica. L’obiettivo di questo lavoro è quello di implementare i metodi per lo studio della meiofauna, combinando l’approccio morfologico e molecolare. Al fine di rispondere alle esigenze della Direttiva Quadro sulla Strategia Marina sono stati testati, in diversi ecosistemi marini, uno strumento per la valutazione dello stato ambientale e varie metodologie innovative di campionamento. Gli strumenti molecolari, come il metabarcoding, insieme ai nuovi sistemi di campionamento, mostrano un grande potenziale per lo studio della biodiversità marina. Il protocollo molecolare qui messo a punto, permette di analizzare la diversità di organismi di piccola taglia in modo rapido ed economicamente efficiente, migliorando la capacità di studiare la biodiversità della meiofauna anche in ecosistemi marini profondi. Nonostante i numerosi vantaggi, l'applicazione del metabarcoding al monitoraggio richiede il superamento di alcuni limiti. L'incompletezza delle banche dati e la presenza di copie multiple di geni in individui della stessa specie ostacolano l'interpretazione dei dati e non consentono di effettuare stime quantitative di biodiversità. Per garantire che le analisi di metabarcoding possano essere ulteriormente convalidate, risulta cruciale conservare la competenza nell’identificazione morfologica. L’approccio tradizionale e quello molecolare forniscono informazioni diverse, quindi dovrebbero essere usati entrambi per ottenere stime accurate di biodiversità.
4
ABSTRACT
Marine biodiversity regulates ecosystem functions that are responsible for the production of goods and services for the entire biosphere and human wellbeing. Censusing species inhabit oceans is among the most fundamental questions in science. Global changes and human activities are having an increasing impact on ocean biodiversity and ecosystem functioning. Impact assessments and monitoring programmes are almost based on large and conspicuous species. Small and cryptic organisms including eukaryotic meiobenthic fauna (20-500 µm) remain overlooked due to the difficulties associated with the traditional, morphology-based identification. We here aim to implement methods for the study of meiofaunal biodiversity, combining classical morphological and molecular approaches. In order to answer to the needs of the Marine Strategy Framework Directive, an environmental status assessment tool and a variety of innovative sampling methodologies have been tested in different ecosystems. Along with new sampling approaches, molecular tools, as metabarcoding, have a great potential in innovating the analysis of marine biodiversity. Molecular protocol set up in this work allows to analyse the diversity of tiny organisms in a rapid and cost-effective way, thus increasing our ability to investigate meiofaunal biodiversity, also in the deep sea. Beyond its many advantages, the routine application of metabarcoding for monitoring requires overcoming some limitations. The incompleteness of public databases and the presence of multi-copy genes within meiofaunal species hamper the interpretation of metabarcoding data and do not allow to infer biodiversity quantitative estimates. It is thus critically important to maintain expertise in morphological identification to ensure that metabarcoding analyses can be further validated. Morphological- and molecular-based approaches provide different information, thus they should be combined to obtain better evaluations of the actual marine biodiversity.
5
CHAPTER 1. INTRODUCTION
Almost 20 years ago, Gray stated: “Complete loss of habitat is the most serious threat to marine biodiversity” (Gray, 1997). Although habitat loss would have dramatic effects on marine biodiversity, nowadays, it is recognized that pressures and threats due to anthropogenic activities and climate changes can erode biodiversity before habitat is completely lost. These stressors can act in synergy and cause changes in biodiversity that are more pervasive than those caused by single disturbances (Sala and Knowlton, 2006).
Human activities such as overfishing, agricultural expansion, dumping, mining, waste, pollution, species introductions can reduce marine biodiversity, by i) accelerating food webs (increasing the turnover of communities via fishing down food webs and enhancing microbial activity), ii) causing pollution-mediated mass mortalities of marine organisms (e.g., dead zones), and iii) facilitating the dominance of invasive species (Halpern et al., 2008). While anthropogenic activities are considered the main direct drivers of biodiversity loss during recent years (Hoffmann et al., 2010), climate change is likely to become the main cause of extinction over the coming century (Burrows et al., 2011; Doney et al., 2012). In addition, human-forced climate changes, such as those provoked by anthropogenic greenhouse gas emissions, have already caused increased temperatures, sea level rise, altered rainfall patterns and the frequency and severity of extreme events (IPCC, 2014). Climate changes induced by human activities may also have an indirect impact on marine ecosystems, altering how and where people interact with environment (Watson, 2014). The increasing attitude to build seawalls to protect against sea-level rise, has led to habitat loss (Dugan et al., 2008; Grantham et al., 2011) and changes in fish distribution (Pinsky and Fogarty, 2012). The impacts of relocation of urban areas and agricultural land due to future sea level rise may be more severe than the direct influence of sea-level rise (Wetzel et al., 2012).
Widespread impacts of human activities and climate changes on marine biodiversity can threaten ecosystem functions and thus ecosystem services, reduce ecosystem stability and resilience and hinder the recovery of biodiversity (Lotze et al., 2006; Sala and Knowlton, 2006; Worm et al., 2006; Danovaro et al., 2008; Halpern et al., 2008; Butchart et al., 2010). These effects have been reported for different geographic areas (Duffy, 2003; Springer et al., 2003; Sala and Knowlton, 2006). With the increasing awareness about the benefits that healthy marine ecosystems provide to people (MEA, 2005; McLeod and Leslie, 2009), the protection of biodiversity and the essential ecosystem services it supports has
6
become a priority for the scientific community, resource managers and national and international policy agreements.
Concerns about human impacts on marine life can be traced back in 1992 in Rio de Janeiro where Convention on Biological Diversity was signed. In 2002, during the Conference of the Parties (COP 6), the Strategic Plan for the Convention has been adopted and world leaders agreed “to achieve by 2010 a significant reduction of the current rate of biodiversity loss” (Secretariat of the Convention on Biological Diversity, 2005). The World Summit on Sustainable Development, held in Johannesburg in 2002, reviewed progress made during the last 10 years, confirming the “2010 target” and reaffirming that biodiversity plays a critical role in overall sustainable development. More recently, recommendations for marine biodiversity conservation were also risen by the United Nation Environmental Programme (Corrigan and Kershaw, 2008) and the Ocean Policy Task Force (Force, I.O.P. T. 2010). In September 2015 at an historic UN Summit in New York, the Sustainable Development Goals were signed. Goal 14 focuses on the conservation and sustainably use of the oceans, seas and marine resources for sustainable development (United Nations. General Assembly, 2015). For these reasons, regional and global assessments of the status, trends and future scenarios of biodiversity and ecosystem services need to be produced (Visconti et al., 2016).
Efforts to address the loss of biodiversity need to be strengthened, integrating biodiversity into broad-scale land-use planning and incorporating its economic value into decision making (Butchart et al., 2010). With the increasing appreciation of marine biodiversity and the importance of its conservation, directives that specifically address marine environmental protection and management began to appear in 1990, such as the EU Habitat Directive of 1992. More recently, in 2008, European Commission enacted the Marine Strategy Framework Directive (MSFD; 2008/56/EC), which aims to manage the European seas by using an ecosystem-based approach in order to achieve Good Environmental Status (GES; i.e. a healthy and productive state of marine ecosystems) by 2020 (Borja et al., 2013).
Despite the central role of marine biodiversity in conventions, regional and national legislations, our knowledge about how many species live in the ocean is still scant. Millennium Ecosystem Assessment (MEA, 2005) provided a state-of-the-art of the condition and trends of the world’s ecosystems and the services they provide, making clear that obtaining realistic assessment of marine biodiversity is crucial to better understand the potential consequences of species loss on ecosystem functioning (Danovaro et al., 2008). Despite this, after 250 years of taxonomic classification only a small fraction of marine species (ca. 9%) have been indexed in central databases (Mora et al., 2011; Appeltans
7
et al., 2012). With extinction rates now exceeding natural background rates by a factor of 100 to 1,000 (Pimm et al., 1995; Payne et al., 2016), the slow advance in the description of species will lead to species becoming extinct before we know they even existed (Mora et al., 2011). Recent projections, based on genera containing IUCN-assessed species, predict an extinction rate of 24 to 40% of genera. The lower value is twice the background rate, and the higher is comparable to the End-Cretaceous mass extinction. If current biodiversity loss rates persist, the so called “sixth mass extinction” may exceed the magnitude of the five major extinctions occurred during the past 550 million years (Barnosky et al., 2011).
The biodiversity loss should incentive the study of marine living species and lead to a shift in the business-as-usual course for marine management (Payne et al., 2016). So far, impact assessments and monitoring programmes are based almost exclusively on large and conspicuous species that represent a small portion of marine biodiversity (Leray and Knowlton, 2016). Tiny organisms (with body size < 2 mm) including eukaryotic meiobenthic fauna, remain overlooked. Meiofauna are defined on the basis of body size as organisms passing through 500 μm mesh net and retained by a 20 μm mesh net (Mare, 1942). Meiofaunal organisms dominate benthic metazoan assemblages in all marine systems, from intertidal ecosystems down to the deep sea. Meiofauna play key roles in ecosystem functioning, contributing to nutrient cycling and being an important link between macrofauna and microbial assemblages (Danovaro and Fraschetti, 2002; Giere, 2009). All these characteristics make meiofaunal organisms excellent candidates to study biodiversity patterns (Snelgrove, 1999; Danovaro et al., 2001, 2008; Nascimento et al. 2011, 2012; Bonaglia et al. 2014). Meiofauna are also recently used as indicators of the status of marine environments, due to their high sensitivity to environmental changes and anthropogenic impacts (Moreno et al., 2011; Pusceddu et al., 2011; Bonaglia et al. 2014). The identification bottleneck associated with meiofaunal taxonomy is related to the classification of species, based on morphological characters, which is time-consuming, requires taxonomic expertise and does not allow to identify cryptic species (Bhadury et al., 2008; Fontaneto et al., 2009; Carugati et al., 2015). All these issues hamper the inclusion of meiofaunal diversity in marine monitoring programs. Molecular methods can open new perspective in the field of marine ecology, enhancing our ability to assess the biodiversity of tiny metazoans. Standard barcoding, based on Sanger sequencing, can allow us to study cryptic diversity within marine species, but it is not an ideal tool for investigating biodiversity at large spatial scales. At the beginning of XXI century, the advent of high-throughput sequencing platforms, capable of producing millions of sequences per run, may significantly increase our ability to assess meiofaunal biodiversity at larger spatial scale (Creer et al., 2010; Fonseca et al., 2010, 2014; Pawlowski
8
et al., 2011; Porazinska et al., 2010, 2012). “Metagenetics” or “Metabarcoding” refer to large-scale analyses of biodiversity through the amplification and sequencing of homologous genes (Creer et al., 2010).
So far, metabarcoding analyses carried out to assess marine metazoan biodiversity have been primarily based on protocols and methods implemented from prokaryotic studies. However, how such approaches could be transferred over to the metazoan assemblages has not been extensively explored. Morphological and molecular approaches have long been considered complementary, but doubts still exist regarding the accuracy and reliability of metabarcoding. Some attempts to compare morphological and metabarcoding-based taxonomic identification have been recently performed on macrofauna (Cowart et al., 2015). We still lack a pilot study aiming to analyse the reliability of metabarcoding to assess the biodiversity of meiofaunal organisms.
We here aim to implement methods for the study of marine benthic biodiversity, by using a combined approach based on classical morphological identification and molecular tools. In order to answer to the needs of the Marine Strategy Framework Directive, an environmental status assessment tool and a variety of innovative sampling methodologies, including metabarcoding, have been tested in different ecosystems. Then, we evaluated the reliability of metabarcoding for the study of meiofaunal biodiversity, through the following main steps:
i) the identification of the limits of high-throughput sequencing analyses for the assessment of marine biodiversity; such limitations need to be addressed in order to use metabarcoding in routine marine monitoring;
ii) the set up of a molecular method to analyze meiofaunal biodiversity by using high-throughput sequencing platforms (e.g., 454 pyrosequencing, Illumina MiSeq);
iii) the comparison of the morphology- and molecular-based approaches to assess the biodiversity of meiofaunal organisms, in different marine ecosystems, spanning from the deep sea to extreme environments, such as Antarctica.
9 References
Appeltans, W., Ahyong, S.T., Anderson, G., Angel, M.V., Artois, T., Bailly, N., et al. (2012). The magnitude of global marine species diversity. Curr. Biol. 22, 2189–2202. doi: 10.1016/j.cub.2012.09.036
Barnosky, A.D., Matzke, N., Tomiya, S., Wogan, G.O., Swartz, B., Quental, T.B., et al. (2011). Has the Earth/'s sixth mass extinction already arrived? Nature, 471(7336), 51-57.
Bhadury, P., Austen, M.C., Bilton, D.T., Lambshead, P.J.D., Rogers, A.D., Smerdon, G.R. (2008). Evaluation of combined morphological and molecular techniques for marine nematode (Terschellingia spp.) identification. Mar Biol 154, 509-518.
Bonaglia, S., Nascimento, F.J.A., Bartoli, M., Klawonn, I., Brüchert, V. (2014) Meiofauna increases bacterial denitrification in marine sediments. Nature Comm 5, 5133
Borja, A., Elliott, M., Andersen, J.H., Cardoso, A.C., Carstensen, J., Ferreira, J.G., et al. (2013). Good Environmental Status of marine ecosystems: what is it and how do we know when we have attained it? Mar. Pollut. Bull. 76, 16–27. doi: 10.1016/j.marpolbul.2013.08.042
Burrows, M.T., Schoeman, D.S., Buckley, L.B., Moore, P., Poloczanska, E.S., et al. (2011). The Pace of Shifting Climate in Marine and Terrestrial Ecosystems. Science 334, 652–655.
Butchart, S.H., Walpole, M., Collen, B., Van Strien, A., Scharlemann, J.P., Almond, R.E., e al. (2010). Global biodiversity: indicators of recent declines. Science, 328(5982), 1164-1168.
Carugati, L., Corinaldesi, C., Dell'Anno, A., Danovaro, R., (2015). Metagenetic tools for the census of marine meiofaunal biodiversity: An overview. Marine Genomics, DOI: 10.1016/j.margen.2015.04.010
Corrigan, C. Kershaw, F. (2008). Working Toward High Seas Marine Protected Areas: An Assessment of Progress Made and Recommendations for Collaboration. UNEPWCMC, Cambridge, UK.
Cowart, D.A., Pinheiro, M., Mouchel, O., Maguer, M., Grall, J., Miné, J., et al. (2015). Metabarcoding is powerful yet still blind: a comparative analysis of morphological and molecular surveys of seagrass communities. PLoS ONE 10: e0117562. doi: 10.1371/journal.pone.0117562
Creer, S., Fonseca, V.G., Porazinska, D.L., Giblin-Davis, R.M., Sung, W., Power, D.M., et al. (2010). Ultrasequencing of the meiofaunal biosphere: practice, pitfalls and promises. Mol. Ecol. 19, 4–20. doi: 10.1111/j.1365-294X.2009. 04473.x
Danovaro, R., Gambi, C., Dell’Anno, A, Corinaldesi, C, Fraschetti, S, et al. (2008). Exponential decline of deep-sea ecosystem functioning linked to benthic biodiversity loss. Current Biology 18, 1–8.
10
Danovaro, R., Dell’Anno, A., Fabiano, M., Pusceddu, A., Tselepides, A., (2001). Deep-sea ecosystem response to climate changes: The eastern Mediterranean case study. Trends Ecol. Evol. 16, 505–510. Danovaro, R., Fraschetti, S., (2002). Meiofaunal vertical zonation on hard bottoms: comparison with
soft-bottom meiofauna. Mar. Ecol. Progr. Ser. 230, 159–169.
Doney, S.C., Ruckelshaus, M., Duffy, J.E., Barry, J.P., Chan, F., English, C.A., et al. (2012). Climate change impacts on marine ecosystems. Mar. Sci. 4, 11–37. doi: 10.1146/annurev-marine-041911-111611
Duffy, J.E. (2003). Biodiversity loss, trophic skew and ecosystem functioning. Ecology Letters 6, 680– 687.
Dugan, J.E., Hubbard, D.M., Rodil, I.F., Revell, D.L., Schroeter, S., (2008). Ecological effects of coastal armoring on sandy beaches. Mar. Ecol. 29, 160–170.
Fonseca, V.G., Carvalho, G.R., Nichols, B., Quince, C., Johnson, H.F., Neill, S.P., et al. (2014) Metagenetic analysis of patterns of distribution and diversity of marine meiobenthic eukaryotes. Global Ecol Biogeogr 23, 1293–1302.
Fonseca, V.G., Carvalho, G.R., Sung, W., Johnson, H.F., Power, D.M., Neill, S.P., et al. (2010). Second-generation environmental sequencing unmasks marine metazoan biodiversity. Nat Commun 1, 98. Fontaneto, D., Kaya, M., Herniou, E.A., Barraclough, T.G., (2009). Extreme levels of hidden diversity
in microscopic animals (Rotifera) revealed by DNA taxonomy. Mol. Phylogenet. Evol. 53, 182–189. Force, I.O.P.T. (2010). Final recommendations of the interagency ocean policy task force. Washington,
DC: The White House Council on Environmental Quality.
Giere, O., (2009). Meiobenthology: The Microscopic Motile Fauna of Aquatic Sediments. Springer-Verlag, Heidelberg.
Grantham, H.S., McLeod, E., Brooks, A., Jupiter, S.D., Hardcastle, J., Richardson, A.J., et al. (2011). Ecosystem-based adaptation in marine ecosystems of tropical Oceania in response to climate change. Pac. Conserv. Biol. 17, 241–258.
Gray, J.S. (1997). Marine biodiversity: patterns, threats and conservation needs. Biodivers. Conserv. 6, 153–75.
Halpern, B.S., Walbridge, S., Selkoe, K.A., Kappel, C.V., Micheli, F., et al. (2008). A global map of human impact on marine ecosystems. Science 319, 948–952.
Hoffmann, M., Hilton-Taylor, C., Angulo, A., Böhm, M., Brooks, T.M., Butchart, S. H., et al. (2010). The impact of conservation on the status of the world’s vertebrates. Science, 330(6010), 1503-1509.
11
Intergovernmental Panel on Climate Change. (2014). Climate Change 2014–Impacts, Adaptation and Vulnerability: Regional Aspects. Cambridge University Press.
Leray, M., Knowlton, N. (2016). Censusing marine eukaryotic diversity in the twenty-first century. Philos. Trans. R. Soc. B. 371:20150331. doi: 10.1098/rstb.2015.0331
Lotze, H.K., Lenihan, H.S., Bourque, B.J., Bradbury, R.H., Cooke, R.G., et al. (2006). Depletion, degradation, and recovery potential of estuaries and coastal seas. Science 312, 1806–1809.
Mare, M.F. (1942). A study of a marine benthic community with special reference to the micro-organisms. Journal of the Marine Biological Association of the United Kingdom, 25(03), 517-554. McLeod, K.L., Leslie, H.M. (2009). Why ecosystem-based management. Ecosystem-based management
for the oceans, 3-12.
Millennium Ecosystem Assessment (2005). Ecosystems and Human Well-being: Biodiversity Synthesis. Washington, DC: World Resources Institute.
Mora, C., Tittensor, D.P., Adl, S., Simpson, A.G.B., Worm, B. (2011). How Many Species Are There on Earth and in the Ocean? PLoS Biol 9(8): e1001127. doi: 10.1371/journal.pbio.1001127
Moreno, M., Semprucci, F., Vezzulli, L., Balsamo, M., Fabiano, M. (2011). The use of nematodes in assessing ecological quality status in the Mediterranean coastal ecosystems. Ecol. Indic. 11, 328–336. doi: 10.1016/j.ecolind.2010.05.011
Nascimento, F.J.A., Karlson, A.M.L., Näslund, J., Elmgren, R. (2011). Diversity of larger consumers enhances interference competition effects on smaller competitors. Oecologia 166, 337–347.
Nascimento, F.J.A., Näslund, J., Elmgren, R. (2012). Meiofauna enhances organic matter mineralization in soft sediment ecosystems. Limnol Oceanogr 57(1), 338–346.
Pawlowski, J., Christen, R., Lecroq, B., Bachar, D., Shahbazkia, H.R., et al. (2011). Eukaryotic richness in the abyss: insights from pyrotag sequencing. PLoS One 6: e18169. doi: 10.1371/journal.pone.0018169 PMID: 21483744
Payne, J.L., Bush, A.M., Heim, N.A., Knope, M.L., McCauley, D.J. (2016). Ecological selectivity of the emerging mass extinction in the oceans. Science, aaf2416
Pimm, S.L., Russell, J.L., Gittleman, Brooks, T.M. (1995). The future of biodiversity. Science 269, 347– 350.
Pinsky, M., Fogarty, M., (2012). Lagged social-ecological responses to climate and range shifts in fisheries. Clim. Chang. 115, 883–891.
12
Porazinska, D.L., Giblin-Davis, R.M., Powers, T.O., Thomas, W.K., (2012). Nematode Spatial and Ecological Patterns from Tropical and Temperate Rainforests. PloS One 7, e44641.
Porazinska, D.L., Giblin-Davis, R.M., Sung, W., Thomas, W.K., (2010). Linking operational clustered taxonomic units (OCTUs) from parallel ultrasequencing (PUS) to nematode species. Zootaxa 2427, 55–63.
Pusceddu, A., Bianchelli, S., Gambi, C., Danovaro, R. (2011). Assessment of benthic 1314 trophic status of marine coastal ecosystems: significance of meiofaunal rare taxa. 1315 Estuar. Coast. Shelf Sci. 93, 420–430.
Sala, E., Knowlton, N. (2006). Global marine biodiversity trends. Annu. Rev. Environ. Resour., 31, 93-122.
Secretariat of the Convention on Biological Diversity (2005). Handbook of the Convention on Biological Diversity Including its Cartagena Protocol on Biosafety, 3rd edition, (Montreal, Canada).
Secretariat of the Convention on Biological Diversity (2010). Strategic Plan for Biodiversity 2011–2020, including Aichi Biodiversity Targets. Montreal: CBD.
Snelgrove, P.V.R. (1999). Getting to the bottom of marine biodiversity: sedimentary habitats. BioScience.; 49, 129–138.
Springer, A.M., Estes, J.A., Vliet, G.Bv., Williams, T.M., Doak, D.F., et al. (2003). Sequential megafaunal collapse in the North Pacific Ocean: An ongoing legacy of industrial whaling? Proceedings of the National Academy of Sciences 100, 12223–12228.
United Nations. General Assembly. (2015). Resolution adopted by the General Assembly on 25 September 2015. Washington: United Nations.
Visconti, P., Bakkenes, M., Baisero, D., Brooks, T., Butchart, S.H., Joppa, L. et al., (2016). Projecting global biodiversity indicators under future development scenarios. Conservation Letters, 9(1), 5-13. Watson, J.E.M., (2014). Human responses to climate change will seriously impact biodiversity
conservation: It's time we start planning for them. Conserv. Lett. 7, 1–2.
Wetzel, F.T., Kissling, W.D., Beissmann, H., Penn, D.J., (2012). Future climate change driven sea-level rise: Secondary consequences from human displacement for island biodiversity. Glob. Chang. Biol. 18, 2707–2719.
Worm, B., Barbier, E.B., Beaumont, N., Duffy, J.E., Folke, C., et al. (2006). Impacts of biodiversity loss on ocean ecosystem services. Science 314, 787–790.
13 1.1 A comparison of the degree of implementation of marine biodiversity indicators by European countries in relation to the MSFD
Ref: Hummel H., Frost M., Juanes J.A., Kochmann J., Castellanos Perez Bolde C.F., Aneiros F.,
Vandenbosch F., Franco J.N., Echavarri B., Guinda X., Puente A., Fernandez C., Galvan C., Merino M., Ramos E., Ernandez P., Pitacco V., Alberte M., Wojcik D., Grabowska M., Jahnke M., Crocetta F.,
Carugati L., Scorrano, S., Fraschetti, S., García, P.P., Sanabria Fernández, J.A., Poromov, A.,
Iurchenko, A., Isachenko, A., Chava, A., Pavloudi, C., Bordeyne, F., Andersen, S.F., Eronat, E.G.T., Cakmak, T., Louizidou, P., Rico, J., Ruci, S., Corta Diego, D., Mendez, S., Rousou, M., de Clippele, L., Eriksson, A., van Zanten, W., Diamant, A. and de Matos, V.K.F., 2015. A comparison of the degree of implementation of marine biodiversity indicators by European countries in relation to the Marine Strategy Framework Directive (MSFD). Journal of the Marine Biological Association of the United Kingdom, doi:10.1017/S0025315415000235
Abstract
The degree of development and operability of the indicators for the Marine Strategy Framework Directive (MSFD) using Descriptor 1 (D1) Biological Diversity was assessed. To this end, an overview of the relevance and degree of operability of the underlying parameters across 20 European countries was compiled by analysing national directives, legislation, regulations, and publicly available reports. Marked differences were found between countries in the degree of ecological relevance as well as in the degree of implementation and operability of the parameters chosen to indicate biological diversity. The best scoring EU countries were France, Germany, Greece and Spain, while the worst scoring countries were Italy and Slovenia. No country achieved maximum scores for the implementation of MSFD D1. The non-EU countries Norway and Turkey score as highly as the top-scoring EU countries. On the positive side, the chosen parameters for D1 indicators were generally identified as being an ecologically relevant reflection of Biological Diversity. On the negative side however, less than half of the chosen parameters are currently operational. It appears that at a pan-European level, no consistent and harmonized approach currently exists for the description and assessment of marine biological diversity. The implementation of the MSFD Descriptor 1 for Europe as a whole can therefore at best be marked as moderately successful.
14 Introduction
From June 2008 the member countries of the European Union (EU) have been working towards the implementation of the Marine Strategy Framework Directive (MSFD). The MSDF aims to provide a holistic and effective mechanism for the protection of the marine environment with the ultimate aim being to achieve Good Environmental Status (GES) of the European marine water bodies by 2020. The timeline for MSFD implementation includes an initial status assessment (2012); an identification of environmental indicators and targets (2012); establishment of a monitoring programme (2014) and the implementation of a programme of measures towards achieving GES (2016). One of the most challenging aspects of the implementation has been the development of a consistent, scientifically-sound and harmonized approach for describing the marine environment utilising indicators of environmental status at a national and pan-European level. These indicators and their associated targets provide the information required against which the appropriate policy and adaptive management tools can be used to achieve the delicate balance between environmental protection and the sustainable use of the critical marine zone.
Among the positive aspects of implementing the MSFD are that it promotes cooperation among the involved countries and institutions, particularly through the Regional Sea Conventions i.e. the Barcelona Convention for the Mediterranean; Bucharest Convention for the Black Sea; the Oslo-Paris Convention (OSPAR) for the NE Atlantic, and the Helsinki Convention (HELCOM) for the Baltic. The MSFD also promotes the integration of approaches to inventory environmental issues at an international and national level, partly due to its robust legal and obligatory character (Milieu 2014b). It is also intended to provide a more thorough and complete “picture” of the marine environment as a whole by complementing earlier directives such as the Water Framework Directive (WFD) for transitional and coastal waters (up to 1nm or 3nm offshore).
Although the willingness to implement the MSFD may seem high in many countries, in practice there is a wide divergence in the degree to which new indicators and targets have been developed to operationalize the directive. Regarding the development of the indicators, there is a tendency among member states to extract parameters already used for OSPAR or HELCOM, Natura 2000, the Bird Directive or WFD (European Commission, 2012; OSPAR Commission, 2012b; BMUB, 2014c). Although this is necessary as a first step to ensure standardization across the various pieces of legislation, merely limiting the key parameters to those used in previous instruments would undermine the spirit and usefulness of the (new) MSFD directive.
15
A current key question therefore is to what extent are the GES descriptors and their underlying indicators developed in the different European countries. Moreover, since many countries are relying heavily on indicators and associated parameters from earlier directives, the question arises to what extent these parameters are relevant to the overlying descriptor. Both these questions are important as reported legal compliance with the directive presented as progress (against the MSFD milestones) may mask underlying issues with the basic science needed to report on progress towards GES.
The aim of the current study therefore was to assess the degree of development and operability of the indicators for MSFD using Descriptor 1 (D1) Biological Diversity as a test case. Descriptor D1 is a key descriptor focusing on whether Biological Diversity is maintained, and should be able to show whether the quality and occurrence of habitats and the distribution and abundance of species are in line with prevailing physiographic, geographic and climatic conditions (Directive 2008/56 EC1; European
Commission, 2011). Good Environmental Status for Descriptor 1 should be achieved by ensuring on the one hand no further loss of the diversity of genes, species and habitats/communities at ecological relevant scales and, on the other hand, that deteriorated components, where intrinsic environmental conditions allow, are restored to target levels.
The assessment of MSFD D1 Biological Diversity parameters was carried out by compiling an overview of the relevance and degree of operability of the parameters across different European countries.
The difficulty of accessing all the relevant information means the study is not exhaustive but the large number of countries involved means it should be comprehensive enough to provide a unique assessment of the relative progress across member states.
Material and methods
Information Collation
A survey of 20 European countries was conducted to determine the actual status and degree of development of Descriptor 1 of the MSFD. The survey was undertaken by compiling and analyzing national directives, legislation, regulations, and publically available reports. Where feasible, the available information was supplemented with interviews of experts from ministries and research institutes.
1 Directive 2008/56/EC Establishing a framework for community action in the field of marine environmental
policy (Marine Strategy Framework Directive) http://eur-lex.europa.eu/legal-content/EN/TXT/PDF/?uri=CELEX:32008L0056&from=EN
16
As some countries voluntarily have adopted the MSFD Descriptor system or installed homologous systems, the survey was extended with some neighbour-countries of the EU to assess the degree of concurrence or differentiation of those countries with the EU.
Descriptor 1 ‘Biological Diversity’ is comprised of 7 criteria each including a range of associated indicators (or ‘types’ of indicators) for which parameters have been developed. Most countries have developed the indicators by breaking down the ecosystem into several components or features (i.e. functional groups and categories of taxa or habitats) (Cochrane, 2010; European Commission, 2011) (see Table 1) the key ones being Marine Mammals; Fish; Birds; Benthos; Pelagic habitats; Rock and biogenic reef habitats; Sediment habitats; and Other habitats. This results in about 40 “State Variables”, also called Parameters or Metrics (OSPAR Commission, 2012a; henceforth referred to as ‘parameters’)2, to be
classified for D1. Since not every country develops parameters for the same component set, the number of Parameters may differ slightly between countries. The assessment omitted components for which few (less than 6) countries have developed parameters such as jellyfish, turtles and cephalopods.
2OSPAR Commission 2012a, p. 113: A parameter or metric is a measureable single characteristic of a species or habitat (e.g. number of individuals, biomass in g dry weight, sediment particle size diameter in mm). Parameters of this nature can be used as simple indicators, and indeed several such metrics are included in the list of indicators provided in the
17 Table 1. Overview of the criteria, indicators and most common groups for which Parameters are described
with regard to Descriptor D1 Biological Diversity (codes are used in Table 2).
Criteria Indicator Group
1.1 Species distribution Distributional range (1.1.1) a. Mammals b. Fish c. Benthos d. Birds Distributional pattern within the latter (1.1.2) a. Mammals
b. Fish c. Benthos d. Birds Area covered by the species (1.1.3) Benthos 1.2 Population size Population abundance and/or biomass (1.2.1) a. Mammals
b. Fish c. Benthos d. Birds 1.3 Population
condition Population demographic characteristics (e.g. body size or age class structure, sex ratio, fecundity rates, survival/mortality rates) (1.3.1)
a. Mammals b. Fish c. Benthos d. Birds Population genetic structure (1.3.2) Benthos
1.4 Habitat distribution Habitat distributional range (1.4.1) a. Pelagic habitats
b. Rock and biogenic reef habitats c. Sediment habitats
d. Other habitats Habitat distributional pattern (1.4.2) a. Pelagic habitats
b. Rock and biogenic reef habitats c. Sediment habitats
1.5 Habitat extent Habitat area (1.5.1) a. Rock and biogenic reef habitats b. Sediment habitat
c. Other habitats Habitat volume where relevant (1.5.2)
1.6 Habitat condition Condition of the typical species and communities
(1.6.1) a. Pelagic habitats b. Rock and biogenic reef habitats c. Sediment habitat
d. Benthos Relative abundance and/or biomass (1.6.2) a. Pelagic habitats
b. Rock and biogenic reef habitats c. Other Habitats
Physical, hydrological and chemical conditions
(1.6.3) Sediment habitat
1.7 Ecosystem structure Composition and relative proportions of ecosystem
components (habitats and species) (1.7.1) a. Fish b. Pelagic habitats c. Foodweb
18
Analysis of information
Two criteria were used to assess the indicators as described below. The evaluation was firstly carried out in May 2013, and updated from May 2014 onwards by scientists assembled in two meetings as part of the EMBOS network (COST Action ES1003 on the European Marine Biodiversity Observatory System).
CRITERION 1
Firstly, the ecological relevance of a parameter proposed by each country was assessed as to its ecological relevance, i.e. how realistically it was likely to represent the impacts of the state of the natural species or community diversity or the natural habitats in an area. The two key determinants when considering this were firstly, whether a parameter is easy to measure or not and secondly how representative a parameter is of the structural and functional state of diversity in a coastal system. For the latter determinant, an additional consideration is how sensitive the parameter is to stressors and other impacts so state change can be identified. The indicators were classified on a scale representing not relevant (0); somewhat relevant (1); definitely relevant (2).
For example, the presence of a specific rare seabird species (as in Italy; MATTM, 2009), which is difficult to observe, would not be deemed as being a proper ecological measure of the diversity of a coastal system, both due to the problems with measuring the parameter and in being a poor link to the state of the coastal biodiversity it is supposed to be an indicator for. Thus the parameter would be judged as not relevant (0) or at most somewhat relevant (1). In contrast, parameters based on multivariate measures of diversity are more likely to be representative of the biological diversity of the habitat and can be linked to pressures through known effects on biodiversity.
In most cases, the ecological relevance of the indicator was based on the expert judgment of the scientists undertaking the assessment supplemented with information from the literature on the importance given to the different parameters (e.g. for Spain: Borja et al., 2011; Velasco et al., 2012).
CRITERION 2
The second criterion for the assessment was the degree of operability of a parameter. Parameters were considered as not being operational when they were either still under discussion by member states or not being taken forward at all at the present time, in which case they were assigned a score of 0. If a parameter is in development (e.g. R&D is being carried out to operationalize it) then it was assigned a score of 1. Finally, if an indicator is already operational then it was assigned a score of 2.
19
The sum of the scores was calculated with the score for each parameter ranging from 0 to 4. A combined score of 0 means that the parameter is currently not deemed to be implemented or is poorly implemented at best; a score of 4 means the parameter is being well implemented by that member state.
Results and discussion
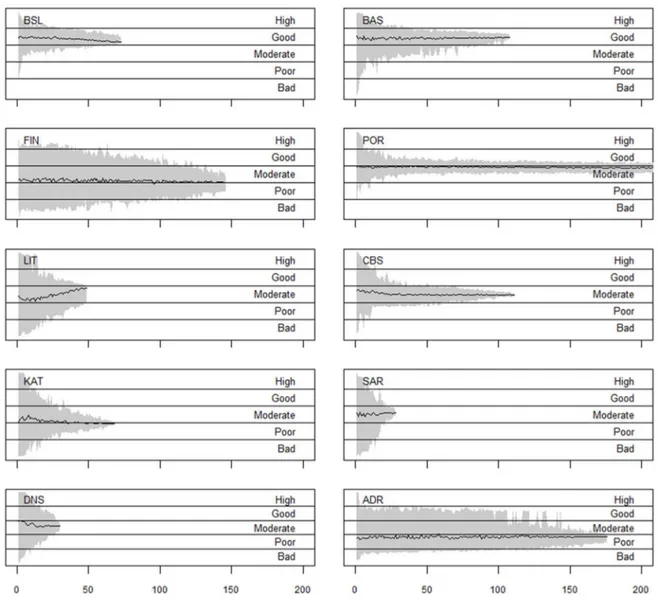
Marked differences were found between countries in the degree of ecological relevance as well as in the degree of implementation and operability of the parameters chosen to indicate biological diversity (Figure 1, Table 2).
Figure 1. Average score on relevance and operability of Parameters for Descriptor D1 on Biological
Diversity proposed by the different European countries. Color codes mean that the MSFD D1 has been implemented: poorly (red), inadequately (orange), moderately (yellow), good (light green) and fully (dark green) (see for color codes also the legend in Table 2; data were checked for blank countries; not any country falls in the ‘fully implemented’ category).
20
The first thing to notice in the results of the evaluation is the wide disparity between countries in the implementation of D1 via its parameters. There is also variation within countries with some functional components and some indicator classes are better developed than other. For example, in the Netherlands, Norway and Poland some clusters of related parameters are considered relevant and operational while other clusters are neither relevant nor operational. It is also noticeable that in certain countries such as Turkey, relevant parameters have been developed for almost all groups but with a relatively low degree of operationalization. This variation illustrates strong differences between countries in their strategies for developing this descriptor, some developing parameters that are relevant and largely operational, whereas other focusing on the development of a wider range of (theoretical) parameters but which are far from being made operational.
These differences between countries are corroborated by the German National Measuring Programme (BLMP, 2014) stating that the listed German indicators are at different stages of development, some being operational, while others are lacking evaluation criteria and/or monitoring.
Some differences have been identified across sub-regions within the same country. The same way, indicators and descriptors have not been implemented/assessed in all the regions of a country (e.g. Spain).
Table 2: Country scores for the ecological relevance and operability of Parameters for Descriptor D1 on Biological Diversity proposed by
the different countries (group-codes are according Table 1).
References used are for Belgium: Belgische Staat 2012, État Belge 2012; Cyprus: DFMR 2012a,b,c, 2014a,b; Denmark: DME 2012, 2014; Finland: SYKE 2012, 2014; France: Guérin et al 2013, Dupont et al 2014, SRMC 2014, SRMG 2014, SRMM 2014; Germany: BLMP 2014, BMUB 2014a,b,c; Greece: MEECC 2014, Italy: MATTM 2009, 2010, Munari & Mistri 2010, COREM 2012, Cima & Ballarin 2013, ISPRA 2013, Tunesi et al 2013, Milieu 2014a; Latvia: LHEI 2012, 2014, MARMONI 2014; Netherlands: MIE 2012, 2014; Norway: Certain et al 2011, Nybø et al 2011, 2012, Aslaksen & Garnåsjordet 2012, Aslaksen et al 2012; Poland: Krzymiński 2013, 2014; Portugal: MAMAOT 2012, 2014; Russia: Guide to hydrological work in the oceans and seas 1977, Anonymous 1985, VNIRO 2004; Slovenia: Peterlin et al 2013; Spain: Anonymous 2010, Borja et al 2011, Arcos et al 2012, Gil et al 2012, Gil de Sola et al 2012, Hernández et al 2012, MAGRAMA 2014, Ruiz et al 2012, Santos Vázquez et al 2012, Velasco et al 2012, Milieu 2014b, Palialexis et al 2014; Turkey: UNEP/MAP 2007, MFWM 2008, Şekeroğlu et al 2011, Sumer & Muluk 2011; Ukraine: Losovskaya 2005, Zamora et al 2005, Anistratenko et al 2007, Mikhalev 2008, Gladilina 2010, MENRU 2010, Petrenko 2013, Vishnyakova & Gol'din 2014, United Kingdom: Cook et al 2012, ICES 2013, OSPAR Commission 2013, Burrows et al 2014a,b, DEFRA 2014, Fariñas-Franco et al 2014, Haynes et al 2014.
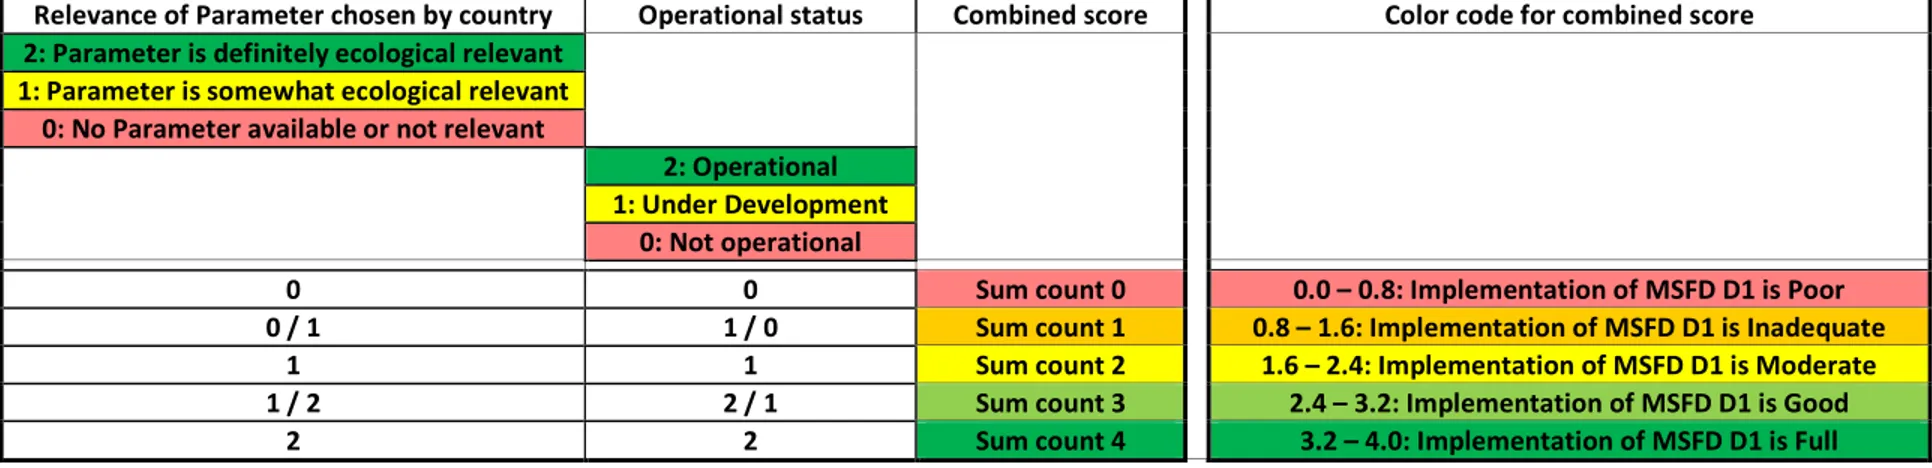
Legend to Table 2:
Relevance of Parameter chosen by country Operational status Combined score Color code for combined score 2: Parameter is definitely ecological relevant
1: Parameter is somewhat ecological relevant 0: No Parameter available or not relevant 2: Operational 1: Under Development 0: Not operational
0 0 Sum count 0 0.0 – 0.8: Implementation of MSFD D1 is Poor 0 / 1 1 / 0 Sum count 1 0.8 – 1.6: Implementation of MSFD D1 is Inadequate
1 1 Sum count 2 1.6 – 2.4: Implementation of MSFD D1 is Moderate 1 / 2 2 / 1 Sum count 3 2.4 – 3.2: Implementation of MSFD D1 is Good
22
Group Albania Albania Albania Belgium Belgium Belgium Cyprus Cyprus Cyprus Denmark Denmark Denmark Finland Finland Finland Code Relevance Operational
status
Combined Relevance Operational status
Combined Relevance Operational status
Combined Relevance Operational status
Combined Relevance Operational status Combined 1.1.1.a 0 0 0 1 2 3 1 1 2 1 2 3 2 2 4 1.1.1.b 0 0 0 1 2 3 2 2 4 0 0 0 1 2 3 1.1.1.c 0 0 0 2 0 2 2 2 4 0 0 0 0 0 0 1.1.1.d 0 0 0 1 2 3 1 1 2 1 2 3 2 1 3 1.1.2.a 0 0 0 1 0 1 1 1 2 1 2 3 2 2 4 1.1.2.b 0 0 0 1 0 1 2 2 4 0 0 0 0 0 0 1.1.2.c 0 0 0 2 0 2 1 2 3 0 0 0 0 0 0 1.1.2.d 0 0 0 1 0 1 1 1 2 1 2 3 2 1 3 1.1.3 0 0 0 2 1 3 1 2 3 2 0 2 1 1 2 1.2.1.a 0 0 0 1 2 3 1 1 2 1 2 3 0 0 0 1.2.1.b 0 0 0 1 2 3 2 2 4 0 0 0 2 1 3 1.2.1.c 0 0 0 2 1 3 1 2 3 0 0 0 0 0 0 1.2.1.d 0 0 0 1 2 3 1 1 2 1 1 2 2 1 3 1.3.1.a 0 0 0 1 2 3 1 1 2 1 2 3 2 2 4 1.3.1.b 0 0 0 1 2 3 2 2 4 0 0 0 2 2 4 1.3.1.c 0 0 0 2 0 2 0 0 0 0 0 0 2 2 4 1.3.1.d 0 0 0 1 1 2 1 1 2 2 2 4 2 2 4 1.3.2 0 0 0 0 0 0 0 0 0 0 0 0 0 0 0 1.4.1.a 0 0 0 1 0 1 1 0 1 0 0 0 2 1 3 1.4.1.b 0 0 0 1 0 1 1 0 1 2 1 3 2 1 3 1.4.1.c 0 0 0 2 1 3 1 0 1 1 1 2 2 1 3 1.4.1.d 0 0 0 1 1 2 1 1 2 1 1 2 2 1 3 1.4.2.a 0 0 0 0 0 0 0 0 0 0 0 0 0 0 0 1.4.2.b 0 0 0 1 1 2 0 0 0 1 1 2 0 0 0 1.4.2.c 0 0 0 2 1 3 0 0 0 1 1 2 0 0 0 1.5.1.a 0 0 0 2 0 2 0 0 0 2 1 3 2 1 3 1.5.1.b 0 0 0 1 0 1 0 0 0 1 1 2 2 1 3 1.5.1.c 0 0 0 1 0 1 1 1 2 1 1 2 2 1 3 1.5.2 0 0 0 0 0 0 0 0 0 1 1 2 2 1 3 1.6.1.a 0 0 0 1 0 1 0 0 0 0 0 0 2 1 3 1.6.1.b 0 0 0 0 0 0 1 2 3 1 2 3 2 1 3 1.6.1.c 0 0 0 2 2 4 1 2 3 1 2 3 2 1 3 1.6.1.d 0 0 0 1 1 2 2 2 4 1 2 3 2 1 3 1.6.2.a 0 0 0 1 0 1 1 0 1 0 0 0 0 0 0 1.6.2.b 0 0 0 2 0 2 1 2 3 2 1 3 0 0 0 1.6.2.c 0 0 0 2 0 2 1 2 3 1 2 3 1 1 2 1.6.3 0 0 0 2 0 2 1 1 2 2 2 4 2 2 4 1.7.1.a 0 0 0 2 0 2 1 1 2 1 1 2 2 1 3 1.7.1.b 0 0 0 1 0 1 0 0 0 1 1 2 2 1 3 1.7.1.c 0 0 0 1 0 1 0 0 0 1 1 2 2 1 3 Average score 0 1,875 1,825 1,775 2,3
23
Group France France France Germany Germany Germany Greece Greece Greece Italy Italy Italy Latvia Latvia Latvia Code Relevance Operational
status
Combined Relevance Operational status
Combined Relevance Operational status
Combined Relevance Operational status
Combined Relevance Operational status Combined 1.1.1.a 1 2 3 2 2 4 1 1 2 0 0 0 0 0 0 1.1.1.b 2 1 3 2 2 4 2 2 4 0 0 0 2 2 4 1.1.1.c 0 0 0 2 1 3 1 2 3 0 0 0 2 2 4 1.1.1.d 2 2 4 2 2 4 0 2 2 0 0 0 2 1 3 1.1.2.a 1 2 3 2 2 4 1 1 2 0 0 0 0 0 0 1.1.2.b 2 1 3 2 2 4 2 2 4 0 0 0 0 0 0 1.1.2.c 0 0 0 2 1 3 0 1 1 0 0 0 0 0 0 1.1.2.d 2 2 4 2 2 4 0 2 2 0 0 0 2 1 3 1.1.3 0 0 0 2 1 3 2 2 4 0 0 0 0 0 0 1.2.1.a 2 2 4 2 2 4 1 1 2 1 2 3 0 0 0 1.2.1.b 2 1 3 1 1 2 2 2 4 1 2 3 2 1 3 1.2.1.c 0 0 0 2 2 4 2 1 3 1 2 3 0 0 0 1.2.1.d 2 2 4 2 2 4 1 1 2 1 1 2 2 2 4 1.3.1.a 1 2 3 2 2 4 1 1 2 0 0 0 0 0 0 1.3.1.b 2 1 3 1 1 2 1 2 3 1 2 3 0 0 0 1.3.1.c 0 0 0 2 1 3 0 0 0 1 2 3 2 2 4 1.3.1.d 2 2 4 2 2 4 1 1 2 1 1 2 2 1 3 1.3.2 1 0 1 0 0 0 0 1 1 1 1 2 0 0 0 1.4.1.a 2 1 3 0 0 0 2 2 4 0 0 0 0 0 0 1.4.1.b 2 1 3 2 1 3 1 1 2 0 0 0 2 2 4 1.4.1.c 2 1 3 2 1 3 1 1 2 0 0 0 0 0 0 1.4.1.d 1 0 1 0 0 0 2 2 4 0 0 0 0 0 0 1.4.2.a 2 1 3 1 1 2 1 1 2 0 0 0 0 0 0 1.4.2.b 2 1 3 2 1 3 1 1 2 0 0 0 0 0 0 1.4.2.c 2 1 3 2 1 3 1 1 2 0 0 0 0 0 0 1.5.1.a 2 1 3 2 1 3 2 1 3 1 2 3 2 1 3 1.5.1.b 2 1 3 2 1 3 2 1 3 0 0 0 0 0 0 1.5.1.c 1 0 1 0 0 0 2 2 4 1 2 3 0 0 0 1.5.2 1 1 2 0 0 0 1 0 1 0 0 0 0 0 0 1.6.1.a 2 1 3 1 1 2 1 1 2 0 0 0 2 1 3 1.6.1.b 2 1 3 0 0 0 1 1 2 1 2 3 2 2 4 1.6.1.c 2 1 3 0 0 0 2 2 4 0 0 0 2 2 4 1.6.1.d 1 0 1 2 1 3 2 2 4 1 2 3 2 2 4 1.6.2.a 2 1 3 1 1 2 1 1 2 1 2 3 2 1 3 1.6.2.b 2 1 3 2 1 3 1 1 2 0 0 0 2 2 4 1.6.2.c 1 0 1 2 1 3 1 1 2 1 2 3 1 1 2 1.6.3 2 1 3 1 1 2 2 1 3 0 0 0 1 1 2 1.7.1.a 2 1 3 2 1 3 1 2 3 1 1 2 2 2 4 1.7.1.b 2 1 3 1 1 2 1 1 2 1 1 2 2 1 3 1.7.1.c 2 1 3 2 1 3 0 0 0 1 1 2 0 0 0 Average score 2,475 2,575 2,45 1,125 1,7
24 Group Nether lands Nether lands Nether lands
Norway Norway Norway Poland Poland Poland Portugal Portugal Portugal Russia Russia Russia Code Relevance Operational
status
Combined Relevance Operational status
Combined Relevance Operational status
Combined Relevance Operational status
Combined Relevance Operational status Combined 1.1.1.a 1 2 3 2 2 4 0 0 0 0 0 0 1 1 2 1.1.1.b 2 1 3 2 2 4 1 0 1 0 0 0 2 2 4 1.1.1.c 2 1 3 2 2 4 1 0 1 0 0 0 2 2 4 1.1.1.d 1 2 3 2 2 4 0 0 0 0 0 0 0 0 0 1.1.2.a 1 2 3 2 2 4 0 0 0 0 0 0 1 1 2 1.1.2.b 2 1 3 2 2 4 1 0 1 2 1 3 1 1 2 1.1.2.c 2 1 3 2 2 4 1 0 1 2 1 3 2 2 4 1.1.2.d 1 2 3 2 2 4 0 0 0 2 1 3 0 0 0 1.1.3 2 2 4 1 1 2 0 0 0 0 0 0 2 1 3 1.2.1.a 1 2 3 2 2 4 2 2 4 0 0 0 0 0 0 1.2.1.b 2 1 3 2 2 4 2 1 3 2 1 3 1 2 3 1.2.1.c 2 2 4 2 2 4 1 0 1 2 1 3 2 2 4 1.2.1.d 1 2 3 2 2 4 0 0 0 2 1 3 0 0 0 1.3.1.a 0 2 2 1 1 2 2 2 4 0 0 0 0 0 0 1.3.1.b 1 1 2 1 1 2 2 2 4 0 0 0 0 0 0 1.3.1.c 1 2 3 1 1 2 2 1 3 0 0 0 1 0 1 1.3.1.d 1 2 3 1 1 2 2 2 4 0 0 0 0 0 0 1.3.2 0 0 0 1 1 2 1 0 1 1 0 1 2 0 2 1.4.1.a 0 0 0 2 2 4 0 0 0 2 1 3 0 0 0 1.4.1.b 0 0 0 2 2 4 0 0 0 2 1 3 0 0 0 1.4.1.c 0 0 0 2 2 4 0 0 0 2 1 3 1 0 1 1.4.1.d 1 2 3 1 1 2 0 0 0 2 1 3 0 0 0 1.4.2.a 0 0 0 0 0 0 0 0 0 2 1 3 0 0 0 1.4.2.b 0 0 0 0 0 0 0 0 0 2 1 3 0 0 0 1.4.2.c 0 0 0 0 0 0 0 0 0 2 1 3 0 0 0 1.5.1.a 0 0 0 2 2 4 1 2 3 2 1 3 0 0 0 1.5.1.b 0 0 0 2 2 4 1 2 3 2 1 3 1 0 1 1.5.1.c 1 2 3 1 1 2 1 2 3 2 1 3 0 0 0 1.5.2 0 0 0 0 0 0 1 2 3 0 0 0 0 0 0 1.6.1.a 0 0 0 2 2 4 2 2 4 2 1 3 1 0 1 1.6.1.b 0 0 0 2 2 4 0 0 0 2 1 3 0 1 1 1.6.1.c 0 0 0 2 2 4 2 2 4 2 1 3 1 2 3 1.6.1.d 2 2 4 2 2 4 2 2 4 2 1 3 1 2 3 1.6.2.a 0 0 0 2 2 4 2 2 4 2 1 3 1 2 3 1.6.2.b 0 0 0 2 2 4 0 0 0 2 1 3 0 1 1 1.6.2.c 2 2 4 0 0 0 2 2 4 2 1 3 0 1 1 1.6.3 2 1 3 0 0 0 2 2 4 0 0 0 2 2 4 1.7.1.a 0 1 1 1 1 2 2 2 4 0 0 0 1 0 1 1.7.1.b 0 1 1 1 1 2 1 0 1 0 0 0 0 1 1 1.7.1.c 1 2 3 0 0 0 0 0 0 0 0 0 1 0 1 Average score 1,825 2,8 1,725 1,75 1,325
25
Group Slovenia Slovenia Slovenia Spain Spain Spain Turkey Turkey Turkey UK UK UK Ukraine Ukraine Ukraine Code Relevance Operational
status
Combined Relevance Operational status
Combined Relevance Operational status
Combined Relevance Operational status
Combined Relevance Operational status Combined 1.1.1.a 2 2 4 2 1 3 2 1 3 1 2 3 1 2 3 1.1.1.b 0 0 0 2 2 4 2 1 3 2 2 4 2 0 2 1.1.1.c 0 0 0 2 0 2 2 1 3 0 0 0 0 0 0 1.1.1.d 2 2 4 1 2 3 2 1 3 0 0 0 1 2 3 1.1.2.a 0 0 0 1 1 2 2 1 3 1 2 3 2 0 2 1.1.2.b 0 0 0 1 2 3 2 1 3 2 2 4 1 0 1 1.1.2.c 0 0 0 1 0 1 2 1 3 0 0 0 0 0 0 1.1.2.d 0 0 0 1 2 3 2 1 3 1 2 3 0 0 0 1.1.3 2 1 3 2 0 2 2 1 3 0 0 0 0 0 0 1.2.1.a 2 2 4 1 2 3 2 1 3 1 2 3 2 2 4 1.2.1.b 0 0 0 2 2 4 2 1 3 2 2 4 2 0 2 1.2.1.c 0 0 0 2 0 2 2 1 3 0 0 0 2 1 3 1.2.1.d 2 2 4 1 2 3 2 1 3 1 2 3 2 0 2 1.3.1.a 0 0 0 1 2 3 2 1 3 1 2 3 2 2 4 1.3.1.b 0 0 0 2 2 4 2 1 3 1 2 3 2 2 4 1.3.1.c 0 0 0 1 0 1 2 0 2 0 0 0 2 1 3 1.3.1.d 0 0 0 0 2 2 2 1 3 1 2 3 2 1 3 1.3.2 0 0 0 0 0 0 2 0 2 0 0 0 0 0 0 1.4.1.a 2 1 3 1 1 2 2 1 3 2 2 4 0 0 0 1.4.1.b 2 1 3 2 2 4 2 1 3 1 1 2 0 0 0 1.4.1.c 2 1 3 2 2 4 2 1 3 1 1 2 0 0 0 1.4.1.d 0 0 0 0 0 0 2 1 3 0 0 0 0 0 0 1.4.2.a 0 0 0 1 1 2 2 1 3 2 2 4 0 0 0 1.4.2.b 0 0 0 1 0 1 2 1 3 1 1 2 0 0 0 1.4.2.c 0 0 0 1 0 1 2 1 3 1 1 2 0 0 0 1.5.1.a 2 1 3 1 2 3 2 1 3 1 1 2 0 0 0 1.5.1.b 2 1 3 1 2 3 2 1 3 1 1 2 0 0 0 1.5.1.c 2 1 3 0 0 0 2 0 2 0 0 0 0 0 0 1.5.2 0 0 0 0 0 0 2 0 2 0 0 0 0 0 0 1.6.1.a 2 1 3 2 1 3 2 1 3 2 2 4 0 0 0 1.6.1.b 2 1 3 2 2 4 2 1 3 2 2 4 0 0 0 1.6.1.c 2 1 3 2 2 4 2 1 3 2 2 4 0 0 0 1.6.1.d 2 1 3 2 2 4 2 1 3 0 0 0 0 0 0 1.6.2.a 0 0 0 2 0 2 2 1 3 1 2 3 0 0 0 1.6.2.b 0 0 0 2 2 4 2 1 3 1 1 2 0 0 0 1.6.2.c 0 0 0 1 0 1 2 1 3 0 0 0 0 0 0 1.6.3 0 0 0 1 1 2 2 2 4 2 1 3 2 2 4 1.7.1.a 0 0 0 1 2 3 2 1 3 1 2 3 2 1 3 1.7.1.b 0 0 0 1 1 2 2 1 3 2 2 4 2 1 3 1.7.1.c 0 0 0 2 1 3 2 0 2 0 0 0 2 1 3 Average scores 1,225 2,425 2,9 2,075 1,225
The EU countries that scored highest in the evaluation were France, Germany, Greece and Spain, those scoring lowest were Italy and Slovenia (Figure 1, Table 2). No country achieved maximum scores by demonstrating that its parameters were all ecologically relevant (thus scientifically robust) and operational.
Among countries not belonging to the EU the results also vary. In Ukraine and Albania, for example, the implementation of instruments homologous to the MSFD seems to be rather lacking as they are not obliged to follow the EC regulation. In contrast, Turkey and Norway although also under no obligation, have chosen to implement the MSFD. Both these countries are among the highest scoring in the evaluation meaning that they have outperformed many EU countries that were legally required to transpose the directive.
Although the MSFD descriptor for biodiversity appears to be well-developed with at least 40 parameters, the evaluation as undertaken for this study reveals serious weaknesses in many of the parameters in terms of ecological relevance. Many of the parameters are no more than general qualitative statements with little quantitative underpinning or information on species groups (e.g. changes of plankton form-types, or presence of monk seal). Moreover, as the development of the indicators and underlying parameters is often based on previously available data, the degree of development is strongly biased in favor of species of commercial interest (e.g. proportion of large fish) or endangered species or habitats: these may not necessarily reflect wider marine biodiversity. Such a biased approach, often top-down (politically) driven, resulted in low numbers of relevant parameters for biological diversity (as in the Netherlands), yielding a low average score. On the other hand, in countries where in-depth consultations with experts have taken place, such a bottom-up process can result in the selection of relevant biodiversity parameters. Yet, a low degree of operationalization, as e.g. for Turkey having a very high score for relevance, may yield again a somewhat lower average score.
Other reasons for low performance of parameters and the wide disparity in performance deduced from the country reports to the EU or similarly relevant documentation include the lack of clear and shared homologous definitions on the criteria whereby the choice of parameters relied more on (expert) opinion than on true data. As Palialexis et al. (2014) stated, although some indicators of D1 are very clear and specific (e.g. 1.2.1 Population abundance and/or biomass) having a straight-forward implementation, many other are more sophisticated and general (as e.g. 1.7.1 Composition and relative proportions of ecosystem components); more open to interpretation and reliant on a suite of methods and models to be implemented. Even for established parameters there may be major knowledge gaps and a lack of quantification of the targets (e.g. threshold level values) for what is, or is not, GES (Milieu, 2014b). The
27
lack of shared definitions can be overcome by collaboration between member states. In certain cases, however, lack of collaboration and coordination between governmental and research institutions, or lack of communication among regions within each country, and even conflicts between scientists and policy makers were also mentioned in interviews as a reason for a delayed development of GES indicators. A complex reporting structure and lack of funding for reaching more detailed and advanced results was often pointed out too in the interviews.
As a consequence of all these flaws in the establishment and implementation of the GES indicators and underlying Parameters, for Europe as a whole, the average combined score (for all 40 Parameters of all 20 countries) is only 1.9 (out of a score of maximally 4). This means that the performance of most European countries with regard to the implementation of the MSFD is still far below that necessary if GES is truly to be achieved. There is also an urgent need for harmonised monitoring networks and standardized sampling strategies, for a full implementation of the MSFD to all European countries, as advocated by e.g. the COST Action EMBOS (Heip & McDonough, 2012, p. 19). This would facilitate the establishment of a proper internationally integrated set of parameters, and allow a full gaps and weakness analysis to be undertaken.
In conclusion, even though it is clear a lot of effort has gone in to ensuring parameters are ecologically relevant reflections of Biological Diversity, the real weakness is in the lack of operational indicators: less than half of the established Parameters at this point in the process are operational. There also needs to be more effort for coordination at the Pan-European level so a consistent and harmonized approach to describing marine biological diversity with comparable parameters can be developed. Although a couple of countries are on track in implementing the MSFD, our results suggest that several European countries are not properly prepared to introduce the MSFD, partly because in those countries most parameters are neither bottom-up science driven, nor well-described. Therefore, the implementation of the MSFD Descriptor 1 can for Europe as a whole only be marked as moderate. Ultimately, the need to summarize the large environmental variability and assess impacts using a relatively small group of parameters is a hugely ambitious task. From a scientific point of view, several parameters are still under development because of the need to better understand the functional relationships between biological and abiotic factors, or on how to discriminate between the natural variability of the ecological systems in space and time and the shifts caused by human pressures. Official reports may contain parameters and monitoring as required for legal obligations but the need to scrutinize the scientific robustness of the MSFD work is more crucial than ever.
28 Acknowledgements
The authors wish to thank Victor Yasynsky, Oksana Savenko (Schmalhausen Institute of Zoology, Kiev, Ukraine), Juha-Markku Leppa¨nen, Jan-Erik Bruun, Samuli Korpinen (Finnish environment institute, SYKE, Helsinki, Finland), and Martina Orlando Bonaca (Marine Biology Station, Piran, Slovenia) for their contributions.
Financial support
Meetings to prepare this paper were made possible by funding through COST Action ES1003 EMBOS on the Development and Implementation of a Pan-European Marine Biodiversity Observatory System. Carlos Castellanos Perez Bolde acknowledges MARES Grant FPA 2011–0016 under the Erasmus Mundus framework, Marlene Jahnke has been supported by a SZN PhD fellowship, and Joa˜o N. Franco by Portuguese PhD FCT grant SFRH/BD/84933/2012.
29 References
Anistratenko V.V., Anistratenko O. and Haliman I.A. (2007) The composition of the mollusk fauna of the Azov Sea as a function of its salinity regime. Reports of the National Academy of Sciences of Ukraine, 4, 161-166 (in Russian).
Anonymous (1985) Environmental studies in engineering prospecting on the continental shelf. RD 51 11-01-85, 110 pp. (in Russian).
Anonymous (2010) Ley 41/2010, de 29 de diciembre, de protección del medio marino. Boletín Oficial del Estado, Núm. 317 (Jueves 30 de diciembre de 2010), Sec. I., 108464-108488.
Arcos J.M., Bécares J., Cama A. and Rodríguez B. (2012) Estrategias Marinas. Grupo Aves. Evaluación inicial y buen estado ambiental. D. de Armas, J. Bellas & L. Gil de Sola (Coords.). Ministerio de Agricultura, Alimentación y Medio Ambiente, Secretaría General Técnica, Centro de Publicaciones, Madrid, 296 pp.
Aslaksen I. and Garnåsjordet P.A. (2012) The Norwegian Nature Index, Norsk Geografisk Tidsskrift -Norwegian Journal of Geography, 66:5, 239-240.
Aslaksen I., Framstad E., Garnåsjordet P.A., Nybø S. and Skarpaas O. (2012) Knowledge gathering and communication on biodiversity: Developing the Norwegian Nature Index, Norsk Geografisk Tidsskrift - Norwegian Journal of Geography, 66:5, 300-308.
Belgische Staat (2012) Omschrijving van Goede Milieutoestand en vaststelling van Milieudoelen voor de Belgische mariene wateren. Kaderrichtlijn Mariene Strategie – Art 9 & 10. BMM, Federale Overheidsdienst Volksgezondheid, Veiligheid van de Voedselketen en Leefmilieu, Brussel, België, 34 pp.
BLMP (2014) Entwicklung nationaler Indikatorlisten für die Nord- und Ostsee, Sachstand 07.03.2014. Bund-Länder Messprogramm, 11 pp.
BMUB (2014a) Reporting requirement on monitoring programmes under MSFD Article 11 (Baltic Sea). Federal Ministry for the Environment, Building, Nature Conservation and Nuclear Safety. Web questionnaire with reporting date: 2014-10-15 (with amendments to D10 from 2014-11-5) (http://cdr.eionet.europa.eu/de/eu/msfd_mp/balde), 73 pp. (partially in German).
BMUB (2014b) Reporting requirement on monitoring programmes under MSFD Article 11 (The Greater North Sea, including the Kattegat, and the English Channel). Federal Ministry for the Environment, Building, Nature Conservation and Nuclear Safety. Web questionnaire with reporting date:
2014-10-30
15 (with amendments to D10 from 2014-11-5) (http://cdr.eionet.europa.eu/de/eu/msfd_mp/ansde), 73 pp. (partially in German).
BMUB (2014c) Umsetzung der Meeresstrategie-Rahmenrichtlinie RICHTLINIE 2008/56/EG zur Schaffung eines Ordnungsrahmens für Maßnahmen der Gemeinschaft im Bereich der Meeresumwelt (Meeresstrategie-Rahmenrichtlinie). Überwachungsprogramme gemäß § 45f Abs. 1 WHG zur Umsetzung von Art. 11 MSRL – Teil A – Rahmenkonzept. Bundesministerium für Umwelt, Naturschutz, Bau und Reaktorsicherheit. Referat WA I 5 Meeresumweltschutz, Internationales Recht des Schutzes der marinen Gewässer, 104 pp.
Borja Á., Galparsoro I., Irigoien X., Iriondo A., Menchaca I., Muxika I., Pascual M., Quincoces I., Revilla M., Rodríguez J.G., Santurtún M., Solaun O., Uriarte A., Valencia V.and Zorita I. (2011) Implementation of the European Marine Strategy Framework Directive: A methodological approach for the assessment of environmental status, from the Basque Country (Bay of Biscay). Marine Pollution Bulletin, 62, 889–904.
Burrows M.T., Mieszkowska N. and Hawkins S.J. (2014a). Marine Strategy Framework Directive Indicators for UK Rocky Shores. Part 1: Defining and Validating the Indicators. JNCC Report, 522, SAMS/MBA/NOCS for JNCC, JNCC Peterborough, 98 pp.
Burrows M.T., Smale D., O’Connor N. and Van Rein H. (2014b) Marine Strategy Framework Directive Indicators for UK Kelp Habitats. Part 1: Developing Proposals for Potential Indicators. JNCC Report, 525, SAMS/MBA/QUB/UAber for JNCC, JNCC Peterborough, 80 pp.
Certain G., Skarpaas O., Bjerke J.W., Framstad E. and Lindholm M. (2011) The Nature Index: A General Framework for Synthesizing Knowledge on the State of Biodiversity. PLoS ONE, 6(4), e18930. Cima F. and Ballarin L. (2013) A proposed integrated bioindex for the macrofouling biocoenosis of hard
substrata in the lagoon of Venice. Estuarine, Coastal and Shelf Science, 130, 190-201.
Cochrane S.K.J., Connor D.W., Nilsson P., Mitchell I., Reker J., Franco J., Valavanis V., Moncheva S., Ekebom J., Nygaard K., Serrão Santos R., Narberhaus I., Packeiser T., van de Bund W. and Cardoso A.C. (2010) Marine Strategy Framework Directive – Task Group 1 Report Biological diversity. JRC Scientific and Technical Reports, Joint Research Centre, EUR 24337, 111 pp.
Cook A.S.C.P., Ross-Smith V.H. and Robinson R.A. (2012) Development of MSFD Indicators, Baselines and Target for Seabird Breeding Failure Occurrence in the UK. BTO Research Report, 615, British Trust for Ornithology for JNCC, JNCC Peterborough, 94 pp.