Effects of Climate Change on the Irrigation Scheduling Parameters in
Calabria (South Italy) during 1925-2013
Capra A* and Mannino R
Department of AGRARIA, Mediterranean University of Reggio Calabria, Italy
*Corresponding author: Capra A, Department of Agaria, Mediterranean University of Reggio Calabria, Italy, Tel: +320 3323711; E-mail: [email protected]
Received November 26, 2015; Accepted December 14, 2015; Published December 17, 2015
Citation: Capra A, Mannino R (2015) Effects of Climate Change on the Irrigation Scheduling Parameters in Calabria (South Italy) during 1925-2013. Irrigat Drainage Sys Eng S1:003. doi:10.4172/2168-9768.S1-003
Copyright: © 2015 Capra A, et al. This is an open-access article distributed under the terms of the Creative Commons Attribution License, which permits unrestricted use, distribution, and reproduction in any medium, provided the original author and source are credited.
Keywords:
Climate change; CROPWAT; Evapotranspiration; Irrigation scheduling; Precipitation; TemperatureIntroduction
In regions under water stress, irrigation is the most relevant factor for allowing stable and high crop production. In these areas, irrigated agriculture is the biggest user of water requiring almost 70% of total water use [1]. Climate variables such as temperature and precipitation play an essential role in the evapotranspiration and water requirement of crops and therefore affect irrigation.
According to Intergovernmental Panel on Climate Change (IPCC) [2], warming of the climate system is unequivocal, as is now evident from observations of increases in global average air and ocean temperatures, widespread melting of snow and ice and rising global average sea level.
Climate change is greatest in the Mediterranean area, a region where the impacts of such change may be amongst the most severe worldwide [3-6]. In this region, the risk of drought and desertification is already present in large areas [7,8].
In Italy, various authors [8-12] evidenced a decreasing trend in precipitation and an increasing trend in temperatures, with quite large differences mainly depending on the site. Extreme event analyses [8,10,13-15] showed increases in drought conditions in both north and south areas of Italy. Linear regression slope and often their sign (positive or negative), showed the high variability of the Italian climatic scenario [9,10,16].
Crop water requirement depend largely on evapotranspiration. According to a traditional approach, two evapotranspiration concepts, reference evapotranspiration (ET0) and crop evapotranspiration under standard conditions (ETc), are distinguished [17]. They are defined as follows [17]: ET0 expresses the evapotranspiration from a reference
surface (generally a grass crop having specific characteristics); ETc refers to evapotranspiration of a specific crop under standard conditions (large fields under excellent agronomic and soil water conditions).
The only factors affecting ET0 are meteorological variables, given a reference crop. Therefore, ET0 is a climatic parameter that can be computed from weather data and used to a reliable parameter for assessing long-term trends of the atmospheric evaporative demand [6,18,19]. Instead of, irrigation scheduling parameters depend also on precipitation, vegetation properties and soil characteristics, water availability, and to other non-climatic forces, which could mitigate the impact of changes in climatic regime. Therefore, trends in irrigation scheduling parameters cannot be predicted indirectly because the different variables involved in the calculation could show different or even opposite trends. As an example, when the evapotranspiration increases and precipitation (and water resources) decreases, climate affects irrigation agriculture doubly, especially if the growing cycle of the crops coincides with the period most affected by climate change.
In literature, various studies have analyzed ET0 trends and have shown a variety of results in different regions of the world ([6] for a review). Instead of, there are relatively few studies [20] evidencing
Abstract
Climate characteristics play an essential role in the crop evapotranspiration and therefore affect irrigation. Reference evapotranspiration (ET0) is a climatic parameter that can be computed from weather data and used to a
reliable variable for assessing long-term trends of the atmospheric evaporative demand. The study aims to evaluate the effects of the climate change on ET0 and citrus and tomato irrigation scheduling parameters (irrigation depth,
length of the irrigation season and number of irrigation) in Calabria, a Region of South Italy. The study covered 89 years (1925-2013) and 9 of the most relevant irrigated areas in the Region. The software CROPWAT was used to estimate the irrigation scheduling parameters. The time series were analyzed at yearly and seasonal scale using standard trend analysis tests (Mann-Kendall and linear trend test). The results showed a slight decreasing trend for maximum temperature and both increasing and decreasing trends for minimum temperature. Due to the asymmetric behavior of temperatures, impact on ET0 resulted in a decreasing tendency (-5.51 mm.decade-1). There was a slight
decrease in the seasonal irrigation depth for both citrus and tomato. The average annual magnitude of decreases throughout Calabria were 2.40 and 5.51 mm.decade-1 for citrus and tomato, respectively, corresponding to -7% and
-11% of the mean irrigation depth of the period considered. This trend depended on both the decreased ET0 and
precipitation trend: precipitation decreased at yearly scale, but increased in summer, the season when irrigation requirements are higher in the environment considered. The positive trend in summer precipitation also caused an advance of the last watering, resulting in a slight decrease of the length of the irrigation season. The results, on the whole, showed the importance of studies at regional scale considering the detection of trends even opposite with respect to those founded in studies on other areas in the same Mediterranean region. The elaboration of more local studies is useful in order to deepen knowledge on the problematic of each zone and to plan concrete actions.
the effects of climatic trends on irrigation scheduling based on long historical data-set. Some studies investigate crop water requirement trends on the basis of future scenarios ([21,22] between the more recent).
This study aims to evaluate the effects of climate change on ET0 and irrigation scheduling parameters during last century and the first decade of the present century in Calabria, a Italian Region located in the Mediterranean area. Measured meteorological variables (minimum and maximum air temperature and precipitation) and the derived agro meteorological index ET0 were analyzed in order to evaluate if any time trend does exist and how it affects the irrigation scheduling parameters (irrigation amount and frequency) for citrus and tomato groves. The area studied is a region characterized by highly complex precipitation and temperatures patterns [7,8,11,16,23-25]. The studies cited have analyzed spatial and temporal distribution of precipitation, temperature and drought within this region; however the effects of climate change on irrigation scheduling parameters discussed in the present paper have not been the subject of previous investigation.
Study Area and Meteorological Data Set
The Calabria region is a long narrow peninsula with a surface of almost 15,000 km2 and a coastline of almost 750 km on the Ionian and
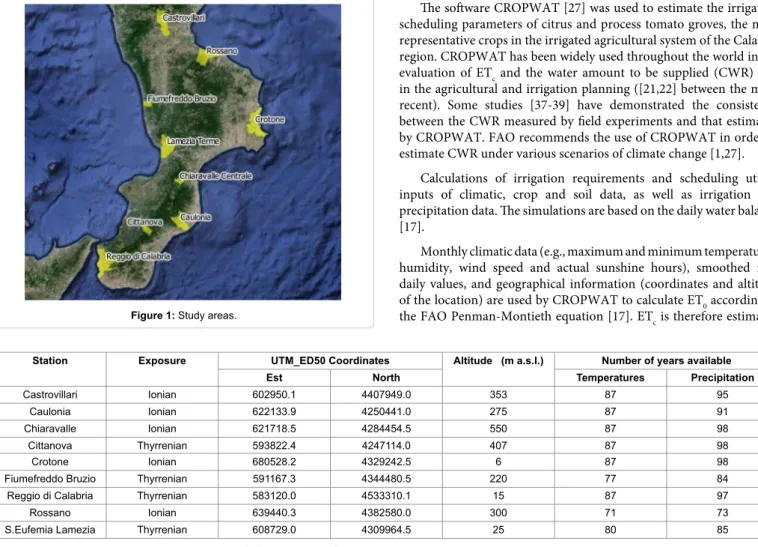
Tyrrhenian coasts of the Mediterranean Basin. The peninsula, located in the Southern Italy, extends for a length of about 250 km North to South and for a width ranging between 31 and 111 km East to West (Figure
1). A mountain range (the Apennines) running perpendicularly to the dominant moisture-bearing wind direction, the geographical position in the Mediterranean basin and the orographic variability characterizing the area cause strong rainfall and temperature variability [8,11,24]. The Region is mainly hilly: 42% of the land is mountainous, 49% hilly and 9% flat. Agriculture is mainly carried out in the flat and hilly areas and is characterized by the presence of orchards and herbaceous crops.
The Italian Hydrographic Service until 2002 and the Arpa Calabria to date manage in the Region a dense network of meteorological stations where precipitation and temperatures were recorded since 1916 for some station [16]. In this study, the analysis is carried out on meteorological stations selected on the basis of data set length and continuity and geographic and altitude representativeness of the irrigated areas of major economic importance for the Region. The irrigated areas were selected on the basis of the results of the 6th Italian
General Census of Agriculture [26].
Crossing the aforementioned criteria, the period 1925-2013 (89 years) and the nine meteorological stations in Figure 1 (with a % of missing data < 20%) were selected for the study. The period before 1925 has been dropped due to the large number of missing data. Table 1 shows the main characteristics of the stations and the related data set length (Table 1).
Methods
Estimation of the irrigation scheduling parameters
The software CROPWAT [27] was used to estimate the irrigation scheduling parameters of citrus and process tomato groves, the most representative crops in the irrigated agricultural system of the Calabria region. CROPWAT has been widely used throughout the world in the evaluation of ETc and the water amount to be supplied (CWR) and in the agricultural and irrigation planning ([21,22] between the more recent). Some studies [37-39] have demonstrated the consistency between the CWR measured by field experiments and that estimated by CROPWAT. FAO recommends the use of CROPWAT in order to estimate CWR under various scenarios of climate change [1,27].
Calculations of irrigation requirements and scheduling utilize inputs of climatic, crop and soil data, as well as irrigation and precipitation data. The simulations are based on the daily water balance [17].
Monthly climatic data (e.g., maximum and minimum temperatures, humidity, wind speed and actual sunshine hours), smoothed into daily values, and geographical information (coordinates and altitude of the location) are used by CROPWAT to calculate ET0 according to the FAO Penman-Montieth equation [17]. ETc is therefore estimated
Figure 1: Study areas.
Station Exposure UTM_ED50 Coordinates Altitude (m a.s.l.) Number of years available
Est North Temperatures Precipitation
Castrovillari Ionian 602950.1 4407949.0 353 87 95
Caulonia Ionian 622133.9 4250441.0 275 87 91
Chiaravalle Ionian 621718.5 4284454.5 550 87 98
Cittanova Thyrrenian 593822.4 4247114.0 407 87 98
Crotone Ionian 680528.2 4329242.5 6 87 98
Fiumefreddo Bruzio Thyrrenian 591167.3 4344480.5 220 77 84
Reggio di Calabria Thyrrenian 583120.0 4533310.1 15 87 97
Rossano Ionian 639440.3 4382580.0 300 71 73
S.Eufemia Lamezia Thyrrenian 608729.0 4309964.5 25 80 85
by crop information as crop type, planting dates, crop coefficient (Kc) and length (days) of the initial, mid-season and late-season crop development stage. Precipitation data, root depth at the beginning and at the end of the crop growing season, soil data (e.g. field capacity, wilting point and infiltration rate), the critical level of soil moisture that causes stress, the irrigation scheduling criteria and the irrigation system efficiency are finally used to schedule irrigation (amounts and intervals).
CROPWAT shows the results of calculations in tables and figures. In particular, the Irrigation schedule table describes [17]: the date of each irrigation, the total available moisture, the readily available moisture, the total and effective precipitation, the actual crop evapotranspiration (ETa), the ratio ETa/ETc, the soil moisture deficit, the interval since the last irrigation took place, the irrigation depth to apply (Ir), the irrigation water that is not stored in the soil and the adjustments the user can makes.
In the case examined, monthly temperatures and precipitation measured by the nine meteorological stations during 1925-2013 period were imputed to CROPWAT. The database used was the one presented in Capra et al. [16] updated until 2013. Humidity, wind speed and real sunshine hours data with the same spatiotemporal density of the temperatures and precipitation are not available in the Region, as it is very common in Mediterranean region [20]. In these conditions, CROPWAT estimates humidity, wind speed and sunshine data based on their CLIMWAT-databases and the FAO indirect procedures described in Allen et al. [17].
The simulation was applied to citrus Clementine and processing tomatoes, since they represent typical irrigated crops which use high water amounts and which have great economic importance in the Region [26].
The agro-techniques (planting dates, length of the different growing stages, etc.) assumed in the simulation were those usually adopted in the agricultural areas investigated. The Kc, the root depth and the critical depletion level were obtained from FAO database for each crop. Table 2 shows crop input (Table 2).
The input data on soil characteristics are: the field capacity (ӨFC),
the wilting point (ӨWP) and the infiltration rate (I). The hydrological
parameters of the soil are among the least available in routine surveys
and among the most expensive to measure. Throughout the years were consequently developed several pedotransfer functions for their derivation using soil data routinely measured [40,41]. The two following steps were used to estimate these data:
a) The Calabria soil map [42] was overlapped to the land use map [43] by a GIS to identify the soil types, and their physical-chemical characteristics, in the areas cultivated with the crops of interest in the agricultural areas observed;
b) Pedotransfer functions based on sand, silt, clay and organic carbon soil contents and on bulk density were used to estimate ӨFC,
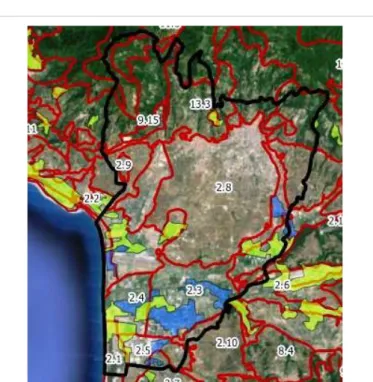
ӨWP and I. The software SOILPAR 2.00 [44] was used for calculation. Figure 2 shows an example of overlay of the two maps cited for the area S. Eufemia Lamezia. Table 3 describes the soil characteristics of the study areas (Figure 2).
The criteria to irrigate and to return the soil back to field capacity when all the easily available moisture (RAW) has been used was chosen between the different scheduling options offered by CROPWAT. According to FAO standard methods [17], RAW for no stress was fixed at 0.5 of total available water (TAW) for citrus and 0.4 for tomatoes. The irrigation system efficiency was fixed at 85%.
Almost 2000 simulations (obtained by the product between the number of agricultural areas examined, the observation years, the crop types and the soil types) were performed and analyzed.
Trend analysis
The temporal variability of the irrigation parameters was analyzed using standard trend analysis tests. The tests applied were the non-parametric Mann-Kendall (MK) test, which reliably identifies monotonic linear and non-linear trends [45] and the linear trend (Lin) test [46]. The significance of the coefficients Z (for the MK test) and r
Figure 2: Example of overlay between the Calabria soil map and the CORINE-LAND COVER map for the S. EufemiaLamezia agricultural area (2.2, 9.15 ... = soil classes; yellow areas = CORINE grid code 13- Permanently irrigated land; light blue areas= CORINE grid code 16- Fruit trees and berry plantations).
Initial Development Mid
season seasonLate Total Citrus
Crop coefficient (Kc)(1) 0.65 0.6 0.65
Length of the growing season
(days) 60 90 120 95 365
Maximum root depth (m) 1.1 1.5
Critical depletion level
(CWR(2)) 0.5 0.5 0.5
Yield response factor (Ky) 0.8-1.1
Tomato
Crop coefficient (Kc) 1.15 0.8 0.6
Length of the growing season
(days) 30 40 45 35 150
Maximum root depth (m) 0.7 1.5
Critical depletion level
(CWR(2)) 0.4 0.4 0.4
Yield response factor (Ky) 0.4 1.1 0.8 0.4 1.05
(1) no ground cover, 50% canopy; (2) easily available moisture. Table 2: Crop input.
(correlation coefficient, for the Lin test) was checked for three different levels of probability (P ≤ 0.01, 0.05 and 0.10).
The search for trend was applied to the datasets of P (mm), Tmax and Tmin (°C), for the derived bioclimatic parameter ET0 (mm) and for the irrigation scheduling parameters.
Monthly data were cumulated (for P and ET0) or averaged (for Tmax and Tmin) at annual and seasonal scale. Seasonal analysis included: 1st quarter (from January to March), 2nd quarter (from April to June),
3rd quarter (from July to September), 4th quarter (from October to
December) and dry period (from April to September) when irrigation is generally required. In the Mediterranean climate of southern Italy, the four quarters correspond to the season’s winter, spring, summer and autumn, respectively; the April-September period (2nd quarter plus
3rd quarter) and the October-March period (4th quarter plus 1st quarter)
represent the dry and wet period, respectively.
For each year, the irrigation parameters submitted to the research for trends were:
- The total irrigation depth (Ir,s in mm), obtained cumulating the depth of each irrigation (Ir);
- The duration of the irrigation season (D in days), e.g. the days between the first and the last irrigation;
- The number of irrigation in the irrigation season (N); - The date of the first irrigation (day and month); - The date of the last irrigation (day and month).
The trend analysis was carried out using the software TREND [47].
Results and Discussion
Main statistics of climatic and bioclimatic characteristics
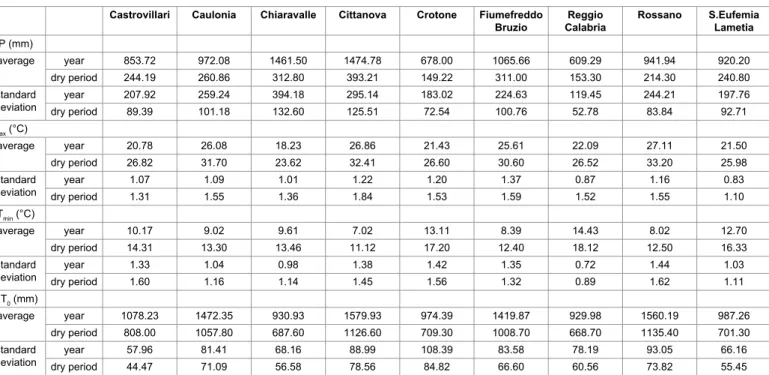
Table 4 allows comparing the long period (1925-2013) mean climatic and bioclimatic characteristics of the areas analyzed at early and dry (irrigation) period scales.
The mean yearly temperatures varied between 18.23 and 27.11°C
Crop Texture Clay (%) Sand
(%) Silt (%) density Bulk (g.cm-3)
Organic
Carbon (%) capacity Field (mm.m-1)
Welting point
(mm.m-1) infiltration rate Maximum (mm.day-1)
Castrovillari Tomato Sandy-loam 15.0 60.0 25.0 1.4 0.7 220 110 ≥300
Citrus Loam 26.6 48.9 24.6 1.1 1.7 340 190 201
Caulonia Citrus Sandy-loam 19.7 51.4 28.9 1.2 0.9 280 140 ≥300
Chiaravalle Citrus Sandy-clay-loam 21.2 51.5 27.3 1.1 2.4 340 180 ≥300
Cittanova Citrus Sandy-loam 8.3 68.7 23.0 1.3 1.2 200 90 ≥300
Crotone Tomato Clay-loam 31.2 34.8 34.1 1.2 0.8 350 200 81
Fiumefreddo B. Tomato Sandy-loam 14.7 63.2 22.1 1.2 1.8 270 140 ≥300
Reggio Calabria Citrus Sandy-loam 10.9 65.5 23.7 1.3 0.7 200 100 ≥300
Tomato Loam 14.6 50.1 35.4 1.0 3.3 360 170 ≥300
Rossano Citrus Sand 81.5 3.0 15.5 1,5 0.5 120 50 ≥300
S.Eufemia L. Citrus Sandy-loam 15.9 66.3 17.8 1.2 0.8 230 120 ≥300
Tomato Sandy-loam 14.1 55.9 30.0 1.2 1.0 250 120 ≥300
Table 3: Describes the soil characteristics of the study areas.
Castrovillari Caulonia Chiaravalle Cittanova Crotone Fiumefreddo
Bruzio CalabriaReggio Rossano S.Eufemia Lametia P (mm)
average year 853.72 972.08 1461.50 1474.78 678.00 1065.66 609.29 941.94 920.20
dry period 244.19 260.86 312.80 393.21 149.22 311.00 153.30 214.30 240.80
standard
deviation dry periodyear 207.9289.39 259.24101.18 394.18132.60 295.14125.51 183.0272.54 224.63100.76 119.4552.78 244.2183.84 197.7692.71 Tmax (°C)
average year 20.78 26.08 18.23 26.86 21.43 25.61 22.09 27.11 21.50
dry period 26.82 31.70 23.62 32.41 26.60 30.60 26.52 33.20 25.98
standard
deviation dry periodyear 1.071.31 1.091.55 1.011.36 1.841.22 1.201.53 1.371.59 1.520.87 1.551.16 0.831.10
Tmin (°C)
average year 10.17 9.02 9.61 7.02 13.11 8.39 14.43 8.02 12.70
dry period 14.31 13.30 13.46 11.12 17.20 12.40 18.12 12.50 16.33
standard
deviation dry periodyear 1.331.60 1.041.16 0.981.14 1.451.38 1.421.56 1.351.32 0.890.72 1.621.44 1.031.11
ET0 (mm)
average year 1078.23 1472.35 930.93 1579.93 974.39 1419.87 929.98 1560.19 987.26
dry period 808.00 1057.80 687.60 1126.60 709.30 1008.70 668.70 1135.40 701.30
standard
deviation dry periodyear 57.9644.47 81.4171.09 68.1656.58 78.5688.99 108.3984.82 83.5866.60 60.5678.19 73.8293.05 66.1655.45 Table 4: Climatic and bioclimatic characteristics of the areas studied during 1925-2013 period.
for Tmax and 7.02-14.43°C for Tmin (Table 4). The average Tmax and Tmin in dry period were 4-6°C and almost 4°C higher respect to the yearly averages, respectively.
Yearly ET0 varied in the range from 929.98 mm (Reggio Calabria) to 1579.93 mm (Cittanova). ET0 in dry period represented a percentage ranging from 71 to 75% of the yearly ET0.
The lower precipitation, the higher temperatures and ET0 in the dry period highlights the need for artificial water supplies (irrigation) in the spring-summer seasons.
Trend of climatic and bioclimatic characteristics
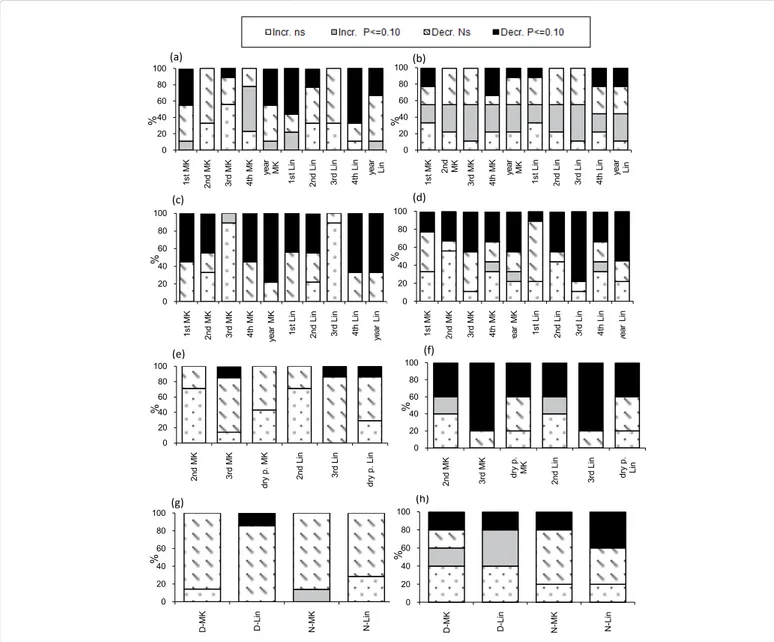
Precipitation: Figure 3a depicts, for the seasonal and yearly scale,
the percentage of stations that showed increasing or decreasing trends, derived using both the Mann-Kendall (MK) and the linear (Lin) tests. The figure also shows the percentage of significant trends for P ≤ 0.10.
The level of significance for P ≤ 0.10 has been considered because the percentage of significant trends was very low for P ≤ 0.05 and P ≤ 0.01 (Figure 3).
Results of the MK test evidence that almost all the series analyzed exhibited negative precipitation trend at yearly scale and for 1st and
4th quarter (Figure 3a). Particularly, almost 80% and 60% of the series
showed significant negative trend for annual and 1st and 4th quarter,
respectively. Whereas, one third of the stations showed increasing, but not significant, trends in 2nd quarter, and 90% of the series evidenced
increasing trend in 3rd quarter.
Similar results were obtained with the Lin test (Figure 3a), with light differences in the percentage of stations showing increasing/ decreasing or significant/not significant trends.
Despite the different number of stations considered, these results are coherent with those founded by [16] at the scale of the whole
0 20 40 60 80 100 1s t M K 2nd M K 3r d M K 4t h M K yea r M K 1s t L in 2nd L in 3r d Li n 4t h Li n yea r Li n % (a) 0 20 40 60 80 100 1s t M K 2nd M K 3r d M K 4t h M K yea r M K 1s t L in 2nd L in 3r d Li n 4t h Li n yea r Li n % (c) 0 20 40 60 80 100 1s t M K 2n d M K 3r d M K 4t h M K yea r M K 1s t L in 2nd L in 3r d Li n 4t h Li n yea r Li n % (b) 0 20 40 60 80 100 1s t M K 2nd M K 3r d M K 4t h M K yea r M K 1s t L in 2nd L in 3r d Li n 4t h Li n yea r Li n % (d) 0 20 40 60 80 100 2nd M K 3r d M K dr y p. M K 2nd L in 3r d Li n dr y p. L in % (e) 0 20 40 60 80 100 D -M K D -L in N -M K N -L in % (g) 0 20 40 60 80 100 D -M K D -L in N -M K N -L in % (h) 0 20 40 60 80 100 2nd M K 3r d M K dr y p. M K 2nd L in 3r d Li n dr y p. Li n % (f)
Figure 3: Percentage of stations with increasing (Incr.) or decreasing (Decr.) and significant (P≤0.10) trends estimated by the Mann-Kendall (MK) and linear (Lin) tests. (a) Maximum temperature; (b) Minimum temperature; (c) Precipitation;(d) Reference evapotranspiration; (e) Citrus irrigation depth; (f) Tomato irrigation depth; (g) Irrigation season duration (D) and number (N) for Citrus; (h) Irrigation season duration (D) and number (N) for Tomato.
region. This analysis, based on 110 precipitation series evidenced yearly precipitation decreased in mean of about 31.8 mm.decade-1
(representing almost 30% of the yearly mean precipitation in the region) during the period 1921-2007.
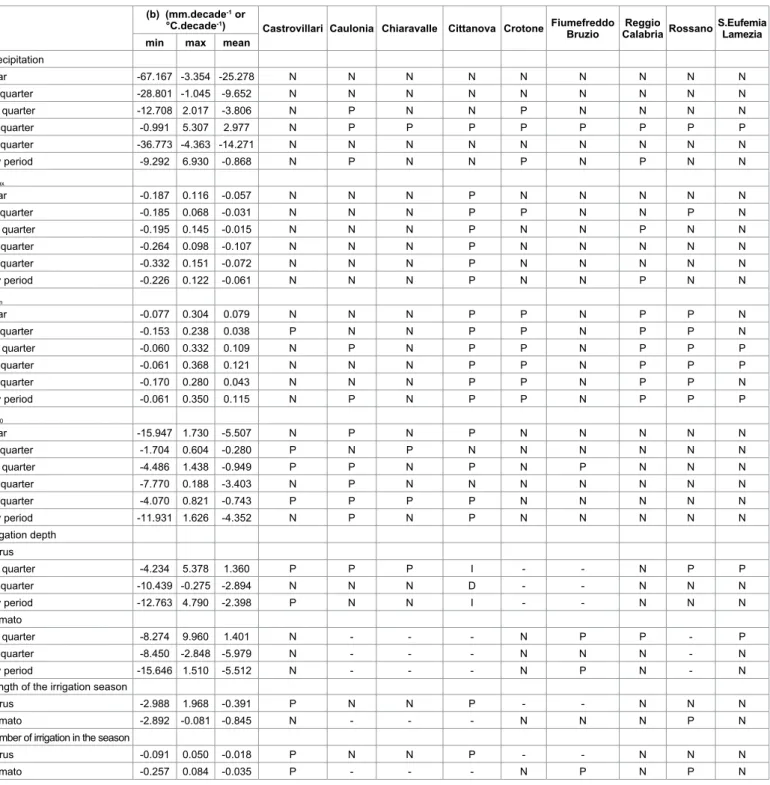
The slopes (b) of the yearly trends (Table 5) ranged from -3.35 mm.decade-1 (Reggio Calabria) to -67.17 mm.decade-1 (Chiaravalle),
corresponding to a decrease of 5% and 41% of the mean precipitation in the period observed, respectively. At seasonal scale, the slopes were generally negative, with the exception of the 3rd quarter, when the
slopes were positive, but the negative slopes were generally higher than the positive slopes.
Particularly crucial for the water resource are the negative trends appeared during the wet period equal to a mean of almost 25 mm.decade-1, corresponding to almost 23% of the mean precipitation.
This trend has a negative impact because it reduces the supply of the surface and underground water reserves. Instead of, the positive trends in the spring and, mainly, in summer precipitation can contribute to a decrease in the irrigation amount, as will be discussed in the paragraph 6.3.
Temperatures: Thermometric parameters indicated, at yearly
scale, a general decreasing trend for Tmax, whereas both increasing and decreasing trends were observed for Tmin.
(b) (mm.decade-1 or
°C.decade-1) Castrovillari Caulonia Chiaravalle Cittanova Crotone Fiumefreddo
Bruzio Calabria RossanoReggio S.Eufemia Lamezia
min max mean
Precipitation year -67.167 -3.354 -25.278 N N N N N N N N N 1st quarter -28.801 -1.045 -9.652 N N N N N N N N N 2nd quarter -12.708 2.017 -3.806 N P N N P N N N N 3rd quarter -0.991 5.307 2.977 N P P P P P P P P 4th quarter -36.773 -4.363 -14.271 N N N N N N N N N dry period -9.292 6.930 -0.868 N P N N P N P N N Tmax year -0.187 0.116 -0.057 N N N P N N N N N 1st quarter -0.185 0.068 -0.031 N N N P P N N P N 2nd quarter -0.195 0.145 -0.015 N N N P N N P N N 3rd quarter -0.264 0.098 -0.107 N N N P N N N N N 4th quarter -0.332 0.151 -0.072 N N N P N N N N N dry period -0.226 0.122 -0.061 N N N P N N P N N Tmin year -0.077 0.304 0.079 N N N P P N P P N 1st quarter -0.153 0.238 0.038 P N N P P N P P N 2nd quarter -0.060 0.332 0.109 N P N P P N P P P 3rd quarter -0.061 0.368 0.121 N N N P P N P P P 4th quarter -0.170 0.280 0.043 N N N P P N P P N dry period -0.061 0.350 0.115 N P N P P N P P P ET0 year -15.947 1.730 -5.507 N P N P N N N N N 1st quarter -1.704 0.604 -0.280 P N P N N N N N N 2nd quarter -4.486 1.438 -0.949 P P N P N P N N N 3rd quarter -7.770 0.188 -3.403 N P N N N N N N N 4th quarter -4.070 0.821 -0.743 P P P P N N N N N dry period -11.931 1.626 -4.352 N P N P N N N N N Irrigation depth Citrus 2nd quarter -4.234 5.378 1.360 P P P I - - N P P 3rd quarter -10.439 -0.275 -2.894 N N N D - - N N N dry period -12.763 4.790 -2.398 P N N I - - N N N Tomato 2nd quarter -8.274 9.960 1.401 N - - - N P P - P 3rd quarter -8.450 -2.848 -5.979 N - - - N N N - N dry period -15.646 1.510 -5.512 N - - - N P N - N
Length of the irrigation season
Citrus -2.988 1.968 -0.391 P N N P - - N N N
Tomato -2.892 -0.081 -0.845 N - - - N N N P N
Number of irrigation in the season
Citrus -0.091 0.050 -0.018 P N N P - - N N N
Tomato -0.257 0.084 -0.035 P - - - N P N P N
Annual Tmin increased in almost 60% of the areas examined, with a percentage of significant trends equal to 33% (Figure 3b). The results were similar for the four quarters, with a percentage of significant trends variable from 11% to 33% in relation to both the quarter considered and the method (MK or Lin test) used for trend detection. At yearly scale, the trend slopes (b) (Table 5) were generally higher for the increasing trend (from 0.1-0.3°C.decade-1) respect to the decreasing
trends (from -0.02 to -0.08°C.decade-1).
Both MK and Lin trends showed the annual Tmax decreased in 80-90% of the studied stations (Figure 3c), with a proportion of significant trends (P ≤ 0.10) equal to almost one half. The results at seasonal scale were similar to that at the yearly scale for the 1st and 4th quarter,
whereas they showed a lower percentage of decreasing trends for the others quarters, and mainly for the 3th, analyzed by MK test (Figure 3b).
Yearly trend slopes ranged from -0.19°C.decade-1 to 0.116°C.decade-1
(Table 5).
Despite the different number of stations considered, these results are coherent with those founded by [16] at the scale of the whole region. During the period 1921-2007, the analysis, based on 25 stations, showed yearly mean Tmin increased of 0.09°C.decade-1, maximum and
mean temperatures decreased of 0.1°C.decade-1 and 0.08°C.decade-1,
respectively.
Reference evapotranspiration: At yearly scale, ET0 decreased
in almost 70% of the stations for both the MK and Lin tests (Figure 3d). The negative trends were significant (P ≤ 0.10) in almost 50% of the stations. The negative trend slopes ranged from -1.73 to -15.95 mm.decade-1 (Table 5). ET
0 decreased 5.37-141.93 mm during the 89
years observed, corresponding to 0.3-9% of the ET0 mean of the same period. Increasing trends were significant in almost 10% of the stations only for yearly MK trend and for the 4th quarter MK and Lin trends.
The yearly changes were mainly supported by the 3rd and 4th quarters: in
fact, ET0 decreased in almost 70% of the areas in winter, 90% in summer and 60% in autumn; whereas both positive and negative trends were observed in spring.
The results are consistent with that found by [16] in a study on 25 stations distributed in the Region. In this study a mean annual ET0 decreasing of 112 mm/100 years was observed.
Cases of decreasing trend of ET0 are not rare in literature. The trends in ET0 were negative in India [48,49] in different Region of China [50-53] in Tiberian Plateau [54]. Other studies have shown positive trends in ET0, including those in Florida [17], central India [55], Iran [56-58], Spain [6,19,59,60]. Furthermore, in some areas, e.g., Australia [60] and different Regions of Italy [11,16,20,61,62] large spatial variability in the evolution of ET0 during recent decades were observed (Table 5).
Trend of the irrigation scheduling parameters
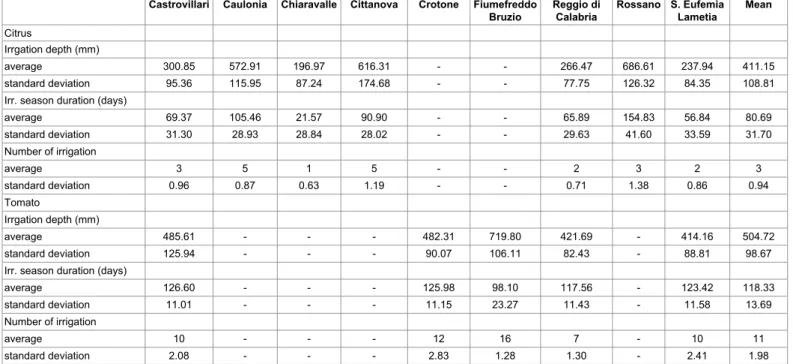
Irrigation depth: The mean total irrigation depth (Ir,s) ranged
from 197 to 687 mm for citrus and was 414-720 mm for tomato (Table 6). Almost the total amount of Ir,s was required in the period April-September (dry period). It is obvious for tomato, which crop cycle roughly correspond to this period. For citrus, the irrigation season extended until October only exceptionally, in very dry and hot years (Table 6).
Ir,s decreased in almost 60-70% of the stations for citrus (Figure 3e). The decreasing trends were significant (P ≤ 0.10) in a percentage of stations lesser than 20% for Lin test only. Any of the increasing trend was significant. The seasonal changes were mainly due to the summer season (3rd quarter), when I
r decreased in a percentage of stations equal
to almost 90% and 100% for MK and Lin test, respectively. Instead of, the trends were mainly positive (in almost 70% of the stations) in the 2nd quarter. The I
r,s negative trend slopes ranged from -4.79 to -12.79
mm.decade-1 (Table 5). Mean I
r,s decreased 6-22% in the areas affected
by negative trends and increased 1% and 7% in the two areas showing positive trends.
The trends showed a similar behavior for tomato (Figure 3f), with little differences in the percentage of positive/negative and significant/ not significant trends. Ir,s decreased in 80% of the stations for both MK and Lin tests. The negative trends were significant (P ≤ 0.10) in one
Castrovillari Caulonia Chiaravalle Cittanova Crotone Fiumefreddo
Bruzio Reggio di Calabria Rossano S. Eufemia Lametia Mean Citrus
Irrgation depth (mm)
average 300.85 572.91 196.97 616.31 - - 266.47 686.61 237.94 411.15
standard deviation 95.36 115.95 87.24 174.68 - - 77.75 126.32 84.35 108.81
Irr. season duration (days)
average 69.37 105.46 21.57 90.90 - - 65.89 154.83 56.84 80.69 standard deviation 31.30 28.93 28.84 28.02 - - 29.63 41.60 33.59 31.70 Number of irrigation average 3 5 1 5 - - 2 3 2 3 standard deviation 0.96 0.87 0.63 1.19 - - 0.71 1.38 0.86 0.94 Tomato Irrgation depth (mm) average 485.61 - - - 482.31 719.80 421.69 - 414.16 504.72 standard deviation 125.94 - - - 90.07 106.11 82.43 - 88.81 98.67
Irr. season duration (days)
average 126.60 - - - 125.98 98.10 117.56 - 123.42 118.33
standard deviation 11.01 - - - 11.15 23.27 11.43 - 11.58 13.69
Number of irrigation
average 10 - - - 12 16 7 - 10 11
standard deviation 2.08 - - - 2.83 1.28 1.30 - 2.41 1.98
half of the cases. The negative trend slopes ranged from -2.64 to -15.65 mm.decade-1 (Table 5), corresponding to -6% and -29% of the I
r,s mean
of the period 1925-2013. Similarly to the citrus, the Ir,s trends were mainly due to the summer (3rd quarter), when I
r decreased in 100% of
the stations, whereas this percentage was 60% in spring.
Duration of the irrigation season and number of irrigations: The
mean duration of the irrigation season (D) was 81 and 118 days for citrus and tomato, respectively, with a wide range for the different areas considered, mainly for citrus (Table 6). For this crop, the minimum value was registered for Chiaravalle due to the lower values of Tmax coupled to the higher values of precipitation.
The length of the irrigation season showed decreasing trends, but generally not significant, for both citrus and tomato, with the only exception of Castrovillari and Cittanova, which trends were positive for citrus (Figure 3g). The shortening of the irrigation season was due to an anticipated closing, whereas there was no change in the date of the first irrigation.
The mean number of irrigation in the season ranged from 1 to 5 for citrus, and from 7 to 16 for tomato (Table 6). It should be noted that CROPWAT estimates irrigation scheduling in the hypothesis to irrigate 100% of the crop surface area (10,000 m2 ha-1), and, therefore,
when surface or sprinkle irrigation systems are used. The depth of each irrigation has to be reduced proportionally to the percentage wetted area and, therefore, the number of irrigations in the season to be increased in the same proportion, when localized irrigation is used [29,61]. As an example, the depth of each irrigation is reduced by half, and the number of irrigations is doubled, when the percentage wetted area is 50%.
The number of irrigations was decreasing in almost 80% of the stations for both citrus and tomato. The percentage of significant trends is very low (Figures 3g and 3h). The positive trends of Cittanova and Castrovillari can be considered null, due to the b values near to zero. That is due to the effect of the opposite trends in springtime and summer.
Effects of meteorological variables on the trends of ET
0and
irrigation scheduling parameters
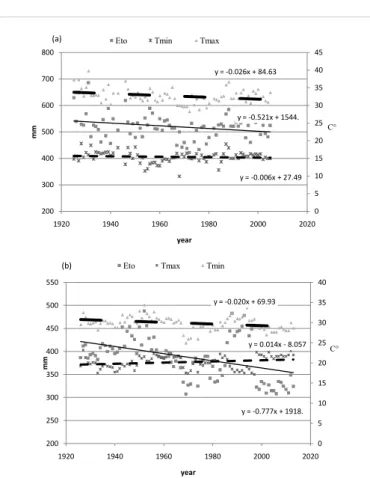
As it is well known, multiple factors may be associated with changes in ET0 [19]. In the Region examined, the temperature trends affected the ET0 trends, as expected. The decreasing of ET0 was mainly due to the decrease of Tmax. This is in accordance with the results of a study on the sensitivity of ET0 to changes in meteorological parameters in Spain [19] which showed ET0 was more sensitive to changes in Tmax than Tmin. In fact, evapotranspiration daily cycles are determined by the solar radiation, which is commonly recorded at the time of the day in which Tmax is measured; whereas during the night, when Tmin is measured, evapotranspiration is much lower. In some stations, the ET0 trend sign (positive or negative) depended on the difference in the slope and, mainly, in the sign (positive or negative) for the Tmax and Tmin trends, e.g. the asymmetrical behavior of the two variables influenced the ET0 trend as observed in other studies [16,50,57,62]. This consideration is based on the fact that differences between Tmax and Tmin are closely related to the daily solar radiation [17,63]. Figure 4 depicts, as examples, the ET0 summer decreasing trends for Fiumefreddo Bruzio, where both Tmax and Tmin decreased, and for Crotone, where Tmax decreased and Tmin increased (Figure 4).
Different results were obtained, in different regions, on the meteorological factors influencing ET0 trend. Chattopadhyay and
Hulme [49] stated that ET0 decreased over the Indian region, in spite of the general increase in temperature, due to increases in relative humidity and decreases in radiation. Xu et al. [53] indicated ET0 significant decreasing trend was mainly caused by a significant decrease in net total radiation in the Changjiang basin in China during 1960–2000. Zhang et al. [54] concluded that ET0 significantly decreased of 47% in the Tibetan Plateau during 1966-2003 despite the air temperature at most of the sites significantly increased. Trends of the same sign (positive) for both temperatures and ET0 were found in the western half of Iran [57] and in Apulia, a southern Italy Region near Calabria [20]. According to Vicente-Serrano et al. [19], the observed increases of ET0 in Spain were mainly driven by warming processes and reduced water supply to the atmosphere, which decreased relative humidity.
The trends of irrigation depth showed high variability, as discussed in the previous paragraph, due to their dependence on both the trend of ET0 (and, therefore, of Tmax and Tmin) and precipitation. The local meteorological parameters influenced the nature and magnitude of the Ir,s trends in different ways. The Ir,s trend could be decreasing even if ET0 increased, as long as precipitation increased, or vice-versa. A further cause of variability was the variability of the trends in the different sub-periods (2nd and 3rd quarters) of the irrigation season.
Some examples can show this complexity in the Region studied. The following analysis refers to the dry period (April-September), that constitutes the irrigation season in the environment considered, and to the 2nd and 3rd quarters, separately.
The Ir,s decrease was clearly due to both ET0 decrease and
y = -0.521x + 1544. y = -0.006x + 27.49 y = -0.026x + 84.63 0 5 10 15 20 25 30 35 40 45 200 300 400 500 600 700 800 1920 1940 1960 1980 2000 2020 m m year
Eto Tmin Tmax
C° (a) y = -0.777x + 1918. y = 0.014x - 8.057 y = -0.020x + 69.93 0 5 10 15 20 25 30 35 40 200 250 300 350 400 450 500 550 1920 1940 1960 1980 2000 2020 m m year Eto Tmax Tmin (b)
C°
Figure 4: Trends of Tmax, Tmin and ET0 in the 3rd quarter for Fiume freddo
precipitation increase in two stations (Crotone and Reggio Calabria) over nine (Table 5). Both Ir,s, ET0 and precipitation trends were negative in dry period in three stations (Chiaravalle, Rossano and S. Eufemia Lamezia). The major role on Ir,s trends was played, for these stations, by the summer trends respect to springtime trends. In fact, at seasonal scale, Ir trends were positive, despite ET0 decreased, due to precipitation negative trends, in 2nd quarter, whereas both I
r and ET0 trends where
negative, and precipitation trends positive, in summer. The positive Ir,s trends were mainly due to the precipitation negative trends in two of the examined stations (Castrovillari and Fiumefreddo), being ET0 decreasing. Ir,s decreased in Caulonia despite the positive trend of ET0, due to precipitation increase in 3rd quarter. Lastly, the I
r,s increase was
mostly explained by the ET0 increasing trend for Cittanova.
The date of the first irrigation remained unchanged, whereas there was an anticipated closing due to the positive trend in the summer rainfall.
Palumbo et al. [20], using the data measured in one agrometeorological station located nearby Foggia (Puglia Region, South Italy) and covering the 1957–2008 period, demonstrated growth trend of tomato water deficit (32 mm.decade-1) took place [64-66].
Summary and Conclusions
In this study, we have analyzed the effects of climate change on citrus and tomato irrigation scheduling parameters in the most important irrigated areas of Calabria (South Italy), between 1925 and 2013, by comparing the changes of the irrigation depth, of the irrigation season length and the number of irrigations in the season, to the trends of climatic (temperatures and precipitation) variables involved in the calculation. The change in irrigation parameters is due exclusively to the climatic factors, since any agronomic aspect was considered constant.
The main results of this study are:
• There was a slight general decreasein the seasonal irrigation depth for both citrus and tomato. The average annual magnitude of decreases throughout Calabria were 2.40 and 5.51 mm.decade-1 for
citrus and tomato, respectively, corresponding to -7% and -11% of the mean irrigation depth of the 89 years considered
• The length of the irrigation season decreased in mean by 0.7 and 1 day.decade-1, for citrus and tomato, respectively; the number of
irrigation decreased by 10% and 5% for citrus and tomato, respectively • ET0 generally decreased, with an average magnitude of -5.51 mm.decade-1, corresponding to -4%, and with a large spatial variability;
ET0 trends depended mainly to maximum temperature (decreasing) than minimum temperature (increasing)
• The trends of the irrigation scheduling parameters depended on both ET0 and precipitation. Precipitation decreased at yearly scale, but increased in summer, the season when irrigation requirements are higher in the environment considered. The positive trend in summer precipitation also caused an advance of the last watering, resulting in a slight decrease of the length of the irrigation season
• Spatial pattern of the change is complex and mostly random due to the influence of the microclimate (minimum and maximum temperatures, precipitation) which, in turn, depends on exposure and local topography, as demonstrated in previous studies
The results, on the whole, show the importance of studies at regional scale considering the detection of trends even opposite
with respect to those found in studies on other areas in the same Mediterranean region. The elaboration of more local studies is useful in order to deepen knowledge on the problematic of each zone and to plan concrete actions.
At regional level, the results have practical interest, since they highlight how the change in the irrigation parameters for two crops economically relevant for Calabria are of little magnitude compared with the change in meteorological variables, such as the significant decrease in the autumn and winter wet period precipitation (-25 mm.decade-1 in mean) that can reduces the availability of the
underground and surface water for irrigation. References
1. FAO (2003) Unlocking the water potential of agriculture. Food and Agriculture Organization of the United Nations.
2. IPCC (2014) Climate Change 2014: Synthesis Report. Contribution of Working Groups I, II and III to the Fifth Assessment Report of the Intergovernmental Panel on Climate Change. Switzerland.
3. Gao X, Giorgi F (2008) Increased aridity in the Mediterranean region under greenhouse gas forcing estimated from high resolution simulations with a regional climate model. Global and Planetary Change 62: 195-209.
4. Lionello P, Abrantes F, Gacic M, Planton S, Trigo R, et al. (2014) The climate of the Mediterranean region: research progress and climate change impacts. Reg Environ Change 14: 1670-1684.
5. Norrant C, Douguedroit A (2006) Monthly and daily precipitation trends in the Mediterranean (1950-2000). Theor Appl Climatology 83: 89-106.
6. Vicente-Serrano SM, Azorin-Molina C, Sanchez-Lorenzo A, Revuelto J, Lopez-Moreno JI, et al. (2014) Reference evapotranspiration variability and trends in Spain, 1961-2011. Global and Planetary Change 121: 26-40.
7. Capra A, Pavanelli D (2010) Interactions between climate change, bioclimate and soil erosion in different climatic areas in Italy. Mexico.
8. Capra A, Scicolone B (2012) Spatiotemporal variability of drought on a short-medium time scale in the Calabria region (Southern Italy). Theor and Appl Climatology 110: 471-488.
9. Brunetti M, Buffoni L, Maugeri M, Nanni T (2000) Precipitation intensity trends in northern Italy. Int J of Climatology 20: 1017-1031.
10. Brunetti M, Buffoni L, Mangianti F (2004) Temperature, precipitation and extreme events during the last century in Italy. Global and Planetary Change 40: 141-149.
11. Capra A, Porto P, Scicolone B (2006) Regional analysis of climate and bioclimate change in South Italy. Geo-environment and landscape evolution II. 12. Vergni L, Todisco F (2011) Spatio-temporal variability of precipitation,
temperature and agricultural drought indices in Central Italy. Agric For Meteorol 151: 301-313.
13. Bonaccorso B, Bordi I, Cancelliere A, Rossi G, Sutera A (2003) Spatial variability of drought: an analysis of the SPI in Sicily. Water Res Manage 17: 273-296.
14. Capra A, Indelicato S, Li Destri Nicosia O, Scicolone B (1992) Evaluation de la sécheresse d’après les données de précipitation.
15. Capra A, Li Destri Nicosia O, Scicolone B (1994) Application of fuzzy sets to drought classification.
16. Capra A, Consoli S, Scicolone B (2013) Long-term climatic variability in Calabria and effects on drought and agro meteorological parameters. Water Res Manage 27: 601-617.
17. Allen RG, Pereira LS, Raes D, Smith M (1998) Crop evapotranspiration. Guidelines for computing crop water requirements.
18. Katerji N, Rana G (2011) Crop reference evapotranspiration: a discussion of the concept, analysis of the process and validation. Wat Resour Manage 25: 1581-1600.
19. Vicente-Serrano SM, Azorin-Molina C, Sanchez-Lorenzo A, Revuelto J, Moran-Tejeda E, et al. (2014) Sensitivity of reference evapotranspiration to changes
in meteorological parameters in Spain (1961-2011). AGU Water Resources Research.
20. Palumbo AD, Vitale D, Campi P, Mastrorilli M (2011) Time trend in reference evapotranspiration: analysis of a long series of agrometeorological measurements in Southern Italy. Irrig Drainage Syst 25: 395-411.
21. Chowdhury S, Al-Zahrani M, Abbas A (2013) Implications of climate change on crop water requirements in arid region: An example of Al-Jouf, Saudi Arabia. Journal of King Saud University, Engineering Sciences.
22. Parekh F, Prajapati KP (2013) Climate change impacts on crop water requirement for Sukhi reservoir project. Int J Innovative Research in Science, Engineering and Technology 2: 4685-4692.
23. Brunetti M, Caloiero T, Coscarelli R, Gullà G, Nanni T, et al. (2010) Precipitation variability and change in the Calabria region (Italy) from a high resolution daily dataset. Int J Climatol published online.
24. Buttafuoco G, Caloiero T, Coscarelli R (2011) Spatial and temporal patterns of the mean annual precipitation at decadal time scale in southern Italy (Calabria region). Theor and Appl Climatol 105: 431-444.
25. Coscarelli R, Caloiero, T (2012) Analysis of daily and monthly rainfall concentration in Southern Italy (Calabria region). J Hydrol 416-417: 145-156. 26. ISTAT (2010) 6° Censimento generale dell’agricoltura.
27. FAO (2013) Software CROPWAT.
28. Anadranistakis M, Liakatas A, Kerkides P, Rizos S (2000) Cropwater requirements model tested for crop grown in Greece. Agric Water Manage 45: 297-316.
29. Capra A, Scicolone B (2003) Simulation-based evaluation of the efficiency of different irrigation scheduling strategies.
30. Diop M (2006) Analysis of crop water use in Senegal with the CROPWAT model.
31. Karanja FK (2006) Cropwat model analysis of crop water use in six districts in Kenya.
32. Molua EL, Lambi CM (2006) Assessing the impact of climate on crop water use and crop water productivity: The Cropwat analysis of three districts in Cameroon.
33. Sheng-Feng K, Shin-Shen H, Chen-Wuing L (2006) Estimation irrigation water requirements with derived crop coefficients for upland and paddy crops in Chia Nan Irrigation Association, Taiwan. Agric Water Manage 82: 433-451. 34. Smith M (1991) CROPWAT Manual and Guidelines, FAO, Italy.
35. Smith M, Kivumbi D, Heng LK (2000) Use of the FAO CROPWAT model in deficit irrigation studies. FAO.
36. Smith M, Kivumbi D (2006) Calculation procedure use of the FAO CROPWAT model in deficit irrigation studies. FAO (Food and Agriculture Organization) Italy.
37. Chatterjee SK, Banerjee S, Bose M (2012) Climate Change Impact on Crop Water Requirement in Ganga River Basin, West Bengal, India. IPCBEE 46: 17-20.
38. George B, Shende S, Raghuwanshi N (2000) Development and testing of an irrigation scheduling model. Agric Water Manage 46: 121-136.
39. Giorgis K, Tadegel A, Tibebe D (2006) Estimating crop water use and simulating yield reduction for maize and sorghum in Adama and Miesso districts using the Cropwat model.
40. Pachepsky Y, Rawls WJ (2005) Development of pedotransfer functions in soil hydrology. Elsevier.
41. Ungaro F, Calzolari C (2005) Development of pedotransfer functions using a group method of data handling for the soil of the Pianura Padano-Veneta region of North Italy: water retention properties. Geoderma 124: 293-317.
42. ARSSA, Agenzia Regionale per lo Sviluppo della Calabria (2003) I suoli della Calabria.
43. CORINE land cover (2006).
44. Acutis M, Donatell M (2003) SOILPAR 2.00: software to estimate soil hydrological parameters and functions. Europ J Agronomy 18: 373-377. 45. Salas JD (1992) Analysis and modelling of hydrologic time series.
46. Hirsch RM, Helsel DR, Cohn TA, Gilroy EJ (1992) Statistical analysis of hydrologic data.
47. TREND Software.
48. Bandyopadhyay B, Bhadra A, Raghuwnshi NS, Singh R (2009) Temporal trends in estimates of reference evapotranspiration over India. J Hydrologic Eng 14: 508-515.
49. Chattopadhyay N, Hulme M (1997) Evaporation and potential evapotranspiration in India under conditions of recent and future climatic change. Agric For Meteorol 87: 55-74.
50. Song ZW, Zhang HL, Snyder RL, Anderson FE, Chen F (2010) Distribution and trends in reference evapotranspiration in the north China plain. J Irrig Drain Eng 136: 240-247.
51. Thomas A (2000) Spatial and temporal characteristics of potential evapotranspiration trends over China. Int J Climatol 20: 381-396.
52. Wang Y, Jiang T, Bothe O, Fraedrich K (2007) Changes of pan evaporation and reference evapotranspiration in the Yangtze River basin. Theor Appl Climatol 90: 13-23.
53. Xu C, Gong L, Jiang T, Chen D, Singh VP (2006) Analysis of spatial distribution and temporal trend of reference evapotranspiration and pan evaporation in Changjiang (Yangtze River) catchment. J Hydrol 327: 81-93.
54. Zhang Y, Liu C, Tang Y, Yang Y (2007) Trends in pan evaporation and reference and actual evapotranspiration across the Tibetan Plateau. J Geophys Res. 55. Darshana A, Pandey R, Pandey,P (2012) Analysing trends in reference
evapotranspiration and weather variables in the Tons River Basin in Central India.
56. Kousari MR, Ahani H (2012) An investigation on reference crop evapotranspiration trend from 1975 to 2005 in Iran. Int J Climatol 32: 2387-2402.
57. Tabari H, Marofi S, Aeini A, Talaee PH, Mohammadi K (2011) Trend analysis of reference evapotranspiration in the western half of Iran. Agric For Meteorol 151: 128-136.
58. Tabari H, Nikbakht J, Talaee PH (2012) Identification of trend in reference evapotranspiration series with serial dependence in Iran. Wat Resour Manage 26: 2219-2232.
59. García-Garizábal I, Causapé J, Abrahao R, Merchan D (2014) Impact of Climate Change on Mediterranean Irrigation Demand: Historical Dynamics of Climate and Future Projections. Water Resour Manage 28:1449-1462. 60. Donohue RJ, McVicar TR, Roderick ML (2010) Assessing the ability of potential
evaporation formulations to capture the dynamics in evaporative demand within a changing climate. J Hydrol 386: 186-197.
61. Pavanelli, D, Capra A (2014) Climate change and human impacts on hydroclimatic variability in the Reno River Catchment, Northern Italy. Clean Soil Air Water 42: 535-545.
62. Keller J, Bliesner RD (1990) Sprinkle and trickle irrigation. AVI Book, USA. 63. Moonen AC, Ercoli L, Mariotti M, Asoni A (2002) Climate change in Italy
indicated by agrometeorological indices over 122 years. Agric For Meteorol 111: 13-27.
64. Hargreaves GH, Samani ZA (1985) Reference crop evapotranspiration from temperature. Trans Amer Soc Civil Engin 1 : 96-99.
65. Abtew W, Obeysekera J, Iricanin N (2011) Pan evaporation and potential evapotranspiration trends in South Florida. Hydrol Process 25: 958-969. 66. Daccachea A, Weatherheada EK, Stalhamb MA, Knoxa JW (2011). Impacts
of climate change on irrigated potato production in a humid climate. Agric For Meteorol 151: 1641-1653.
Citation: Capra A, Mannino R (2015) Effects of Climate Change on the Irrigation Scheduling Parameters in Calabria (South Italy) during 1925-2013. Irrigat Drainage Sys Eng S1:003. doi:10.4172/2168-9768.S1-003