www.impactjournals.com/oncotarget/
Oncotarget, Vol. 7, No. 14
Metformin combined with sodium dichloroacetate promotes B
leukemic cell death by suppressing anti-apoptotic protein Mcl-1
Rebecca Voltan
1,*, Erika Rimondi
2,*, Elisabetta Melloni
1, Paola Gilli
3, Valerio
Bertolasi
3, Fabio Casciano
1, Gian Matteo Rigolin
4, Giorgio Zauli
1, Paola Secchiero
1 1Department of Morphology, Surgery, Experimental Medicine and LTTA Centre, University of Ferrara, Ferrara, Italy2Department of Life Sciences, University of Trieste, Trieste, Italy
3Department of Chemical and Pharmaceutical Sciences, University of Ferrara, Ferrara, Italy 4Department of Medical Sciences, University of Ferrara-Arcispedale S. Anna, Ferrara, Italy *These authors have contributed equally to this work
Correspondence to: Paola Secchiero, e-mail: [email protected]
Giorgio Zauli, e-mail: [email protected]
Keywords: metformin, sodium dichloroacetate, B chronic leukemic cells, Mcl-1, apoptosis
Received: December 04, 2015 Accepted: February 06, 2016 Published: March 03, 2016
ABSTRACT
Metformin and the mitochondrial targeting dichloroacetate (DCA) have recently received attention due to their ability to inhibit anaerobic glycolysis, which renders most cancer cells resistant to apoptosis induction. We observed that Metformin alone exhibited a dose-dependent anti-leukemic activity in both B leukemic cell lines and primary B-chronic lymphocytic leukemia (B-CLL) patients’ cells and its anti-leukemic activity was enhanced when used in combination with DCA. In order to overcome the problems of poor bioavailability and cellular uptake, which limit DCA efficacy, we have designed and synthetized cocrystals consisting of Metformin and DCA (Met-DCA) at different stoichiometric ratios. Of note, the MetH2++•2DCA− cocrystal exhibited enhanced in vitro anti-leukemic activity, with respect to the treatment with the mix consisting of Metformin plus DCA. In particular, the treatment with the cocrystal MetH2++•2DCA− induced a synergistic apoptotic cell death coupled to a marked down-modulation of the anti-apoptotic Mcl-1 protein. Taken together, our data emphasize that innovative compounds based on Metformin-DCA combination merit to be further evaluated as chemotherapeutic agents for the treatment of B-CLL.
INTRODUCTION
Most cancers are characterized by enhanced
glycolytic flux for ATP production, enhanced glucose to
lactate conversion and reduced mitochondrial oxidative
phosphorylation, even under aerobic conditions [1-3].
Interestingly, this cancer-specific metabolic remodeling
can be reversed by dichloroacetate (DCA), a
mitochondria-targeting small molecule able to penetrate most tissues after
oral administration [4]. DCA is a generic drug with low
price, which has been used for human treatments for more
than 30 years and has received renovated attention because
of interesting preclinical antitumoral characteristics, assessed
in solid tumor cell lines [4-7], and relatively low toxicity
on normal cells. Some recent studies of our and other
groups have demonstrated that DCA is also effective against
hematological malignancies, such as multiple myeloma
[8] and in particular, for the purpose of this study, against
B-chronic lymphocytic leukemia (B-CLL) cells [9, 10].
Among the great variety of anti-cancer drugs, another
inexpensive and safe drug, which has recently revealed a
potential anti-leukemic activity, is Metformin [11-14].
This molecule represents the most commonly prescribed
drug for type 2 diabetes mellitus [11]. Anyhow, in recent
years, multiple lines of evidence have provided support
for the hypothesis that treatment with Metformin results in
decreased incidence, progression, and mortality of different
human cancers. Moreover, a number of in vitro studies
have documented the antiproliferative, anti-invasive, and
antimetastatic effects of Metformin in multiple cancer cell
types [15-18]. Interestingly, DCA and Metformin share
several mechanisms, potentially involved in their anticancer
activity, by disrupting mitochondrial respiratory chain
complex and decreasing the ATP synthesis [19].
On these bases, the aim of the present study was
to evaluate the potential therapeutic perspectives of
Metformin plus DCA as innovative anti-leukemic drug
combination. Herein, we have evaluated the in vitro effects
of Metformin used alone and in combination with DCA
on B-leukemic cells, including primary B-CLL patient
cells, by assessing cell viability, cell cycle progression,
apoptosis, as well as the expression of apoptotic signaling
modulators. Of note, to improve the efficacy of the
drug combination, we have designed, synthetized and
functionally validated Metformin-DCA cocrystals.
RESULTS
Metformin promotes cytotoxicity in B leukemic
cell lines and in primary B-CLL cells
In the first set of experiments, we have evaluated
the in vitro effect of Metformin on B leukemic cell lines
(EHEB and JVM-2), as well as on primary B-CLL patient
cell samples. All leukemic cells were characterized
by having a p53
wild-typestatus, a feature typical of the
majority of the B-CLL at diagnosis [20-25]. Treatment
with Metformin exhibited a dose- and time-dependent
cytotoxicity on both B-leukemic cell lines (Figure 1A) as
well as on B-CLL patient cell cultures (Figure 1B). Of
note, the IC
50mean values (±SD) calculated after 48 hours
of treatment in B leukemic cell lines (11.58±0.77 mM)
and B-CLL patient derived cell cultures (10.17±1.04 mM)
were comparable.
Anti-leukemic activity of Metformin plus DCA
and of Met-DCA cocrystals
Starting from our recent studies documenting
anti leukemic activity of DCA towards B-CLL [9, 10],
in the next group of experiments we have explored the
potentiality of using Metformin in combination with
DCA. B-CLL cells were treated with Metformin and DCA
(used in the range of 0.1-20 mM) as single agents and in
combination. In particular, leukemic cells were treated
with serial concentrations of Metformin and DCA at a
constant Metformin:DCA ratio (either 1:1 or 1:2) for data
analysis by the method of Chou and Talalay [26]. Combined
treatment with Metformin plus DCA, at 1:2 ratio, resulted
in significantly (p<0.05) enhanced cytotoxicity with respect
to the single agents in both B leukemic cell lines as well
as in primary B-CLL patient samples (Figure 2A), with a
synergistic effect (Figure 2B) documented by an average
Combination Index (CI) value <1. On the other hand, no
significant cytotoxicity was observed in normal peripheral
blood cells exposed to the single drugs, confirming
literature data [9, 27], as well as to the Metformin plus DCA
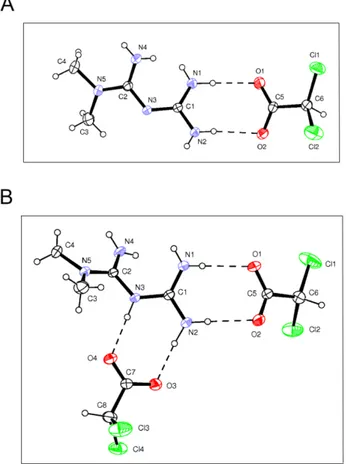
combination (Figure 2A). Starting from these results and
considering that DCA molecule exhibits poor bioavailability
and cellular uptake, we have synthetized new molecules
consisting of cocrystals of Metformin and DCA in different
stoichiometric ratios: MetH
+•DCA
−(1:1; Figure 3A) and
MetH
2++•2DCA
−(1:2; Figure 3B). When tested on leukemic
cell lines and B-CLL patient derived primary cells, these
compounds exhibited in vitro anti-leukemic activity. In
particular, maximal cytotoxic effects were observed when
cell cultures were treated with the cocrystal MetH
2++•2DCA
−(from now on, named Met-DCA cocrystal), which
exhibited an enhanced (p<0.05) activity with respect to the
treatment with a mix of the two reference drugs, used at
the appropriate concentrations (Figure 4). Analysis of the
cell cycle profile (Figure 5A) revealed that the cytotoxicity
induced by the treatment with the Met-DCA cocrystal was
effective in increasing the cytostatic effect induced by DCA
(id, accumulation in G1 phase and reduction in S phase
of the cell cycle). Moreover, the Met-DCA cocrystal was
particularly effective as pro-apoptotic molecule resulting in
a significant (p<0.05) increase of the degree of apoptosis
with respect to the treatment with Metformin and DCA used
as single agents (Figure 5B-5C). Of note, the pro-apoptotic
effects of the Met-DCA cocrystal were significantly
(p<0.05) higher also with respect to the treatment with the
mix of Metformin plus DCA (Figure 5B-5C).
The Met-DCA cocrystal-induced cell death is
accompanied by Mcl-1 down-regulation
In order to evaluate the molecular basis explaining
the antitumoral effects of the Met-DCA cocrystal, after in
vitro treatments, we have analyzed the expression profile
of intracellular effectors known to stimulate/suppress
leukemic cell survival. In particular, considering previous
studies on the molecular effects of Metformin, alone or in
combination with other therapeutic compounds, in solid
tumor cell models and in multiple myeloma cells [28-30],
we have first investigated the expression levels of Mcl-1.
Of note, Mcl-1 is one of the most important anti-apoptotic
Bcl-2 family member, which induces CLL cell survival
and therefore is associated with CLL response to the
treatments and disease progression [31, 32]. As shown in
Figure 6, in our experimental models, Mcl-1 protein levels
were significantly decreased upon 24 hours of treatment
with the combination of Metformin plus DCA. Of interest,
maximal down-regulation was observed by treatment with
the Met-DCA cocrystal (Figure 6). It has to be underlined
that the down-modulation of Mcl-1, coupled to the
induction of apoptosis, in response to Met-DCA cocrystal
was documented not only in B leukemic cells with a
p53
wild-typestatus, but also in the B lymphoblastoid cell line
MEC-2 harboring mutated p53 (Figure 7). Conversely, the
levels of the pro-apoptotic Bcl-2 protein did not change
upon drug treatments neither in p53
wild-type(Figure 6) nor
in p53
mutatedcells (Figure 7).
In the next experiments, we have analyzed Mcl-1
protein levels at early time points upon drug exposure. As
shown in Figure 8A, Mcl-1 down-modulation was evident
already after 3-5 hours of treatment with the Met-DCA
cocrystal, well before the onset of apoptosis. In parallel,
since in different cancer cells Mcl-1 is induced by Akt
and STAT-3 intracellular pathways [33-35], which are
implicated in B-CLL pathogenesis [12, 36-39], we have
investigated the potential involvement of Akt and
STAT-3 in the anti-leukemic activity of Met-DCA cocrystal.
As shown in Figure 8B, down-modulation of Mcl-1 in
response to the Met-DCA cocrystal was coupled to a
significant down-regulation of phospho-Akt, total Akt,
and phospho-STAT3 protein levels. On the other hand,
in line with previous studies on Metformin [13, 14, 18],
our present study documented the ability of Met-DCA
cocrystal of stimulating the AMP-activated protein kinase
(AMPK) pathway (id, AMPK phosphorylation; Figure
8C), an energy-sensing system associated with Mcl-1
down-modulation in different cell models [40-42].
DISCUSSION
Based on FDA definition, cocrystals are solids
composed of two or more molecules in the same crystal
lattice held together in stoichiometric amounts by
freely reversible, noncovalent forces of interaction [43].
When one of the molecules is an Active Pharmaceutical
Ingredient (API) they are called pharmaceutical
cocrystals and have received recent attention because
of better pharmaceutical profiles over the native drugs
[44]. Moreover, the concept of modifying the properties
of a single API by cocrystallization with a coformer,
Figure 1: Cytotoxicity induced by Metformin in B leukemic cells.
The B leukemic cell lines EHEB and JVM-2 A. as well as B-CLL patients’ leukemic cells (n=6) B. were exposed to serial doses of Metformin (range 0.1-10 mM) before analysis of cell toxicity. In A and B, cell viability in response to Metformin was calculated at both 24 and 48 hours of treatment as percentage with respect to the control vehicle cultures (set to 100% for each cell line). Data are reported as mean values ±SD of results of at least six independent experiments. The asterisk indicates p<0.05 with respect to the untreated cultures.Figure 2: Evaluation of cell cytotoxicity in response to Metformin in combination with DCA in B-CLL leukemic cells.
The B leukemic cell lines EHEB and JVM-2, B-CLL patients’ leukemic cells (n=5) and normal PBMC from healthy donors (n=3) were exposed to DCA (range of 0.2 to 20 mM) or Metformin (range of 0.1 to 10 mM) used either alone or in combination for 24 and 48 hours. In A. cell viability in response to Metformin (10 mM) and DCA (20 mM), used alone or in combination, was calculated as percentage with respect to the control vehicle cultures (set to 100% for each cell line). Data are reported as the mean±SD of results of at least three independent experiments; the asterisk indicates a significant difference (p<0.05) with respect to the treatment with the single agents. In B. dose-effect plots of drug efficacy, documenting a synergistic effect of the combination Metformin plus DCA, are shown for representative experiments performed on EHEB cells and on one B-CLL patient sample. The decrease of cell viability, labeled “effect” on the Y-axis, was determined in assays done at least twice and in duplicate.
Figure 3: Structure of Metformin and DCA cocrystals.
Drawings of Met-DCA 1:1 (MetH+•DCA−) A. and Met-DCA 1:2(MetH2++•2DCA–) B. cocrystals are shown (ORTEP view with the thermal ellipsoids at 30% probability).
Figure 4: Comparative evaluation of the anti-leukemic activity of Metformin plus DCA (mix) and of the Met-DCA
cocrystal MetH
2++•2DCA
–.
The B leukemic cell lines EHEB and JVM-2 as well as B-CLL patients’ cells (n=5) were exposed to a mix of Metformin (10 mM) plus DCA (20 mM) or to the Met-DCA cocrystal MetH2++•2DCA− (10 mM) before analysis of cell viability at 24and 48 hours. Cell viability was calculated as percentage with respect to the control vehicle cultures (set to 100%). Data are reported as the mean±SD of results from at least four independent experiments. The asterisk indicates a significant difference (p<0.05) with respect to the treatment with the mix. Considering that results were comparable in both cell lines, only EHEB results are shown as representative.
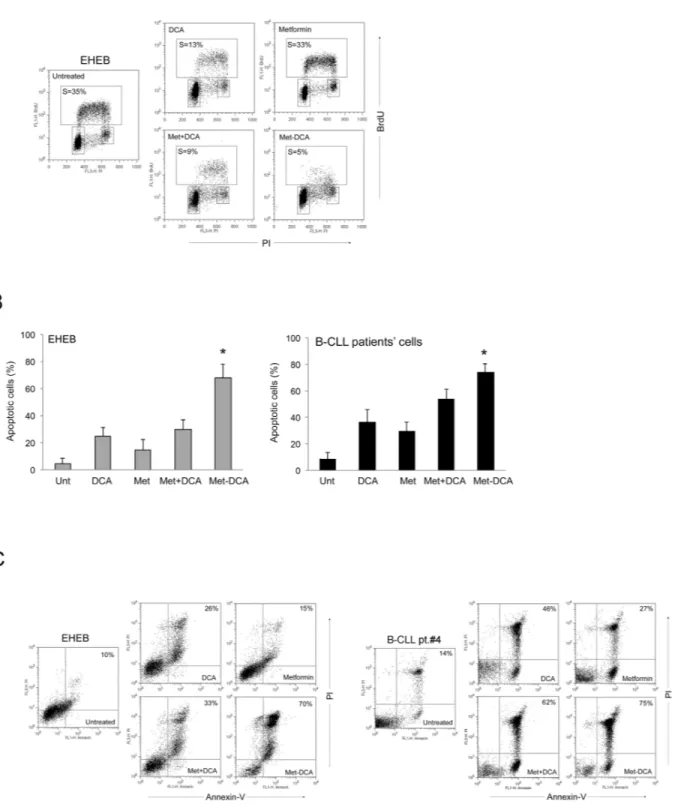
Figure 5: Mechanism of the anti-leukemic activity of the Met-DCA cocrystal MetH
2++•2DCA
–on B leukemic cells.
The B leukemic cell lines EHEB and JVM-2 as well as B-CLL patients’ cells were exposed to Metformin (10 mM) and DCA (20 mM), used either alone or in combination, and to the Met-DCA cocrystal MetH2++•2DCA− (10 mM) before cytofluorimetric analysis of cell cycleprogression A. and apoptosis induction B-C. In A, representative cell-cycle profiles analyzed by BrdU incorporation after 24 hours of the indicated treatments. The rectangles represent the cells in the different (G0/G1, S, G2/M) phases of the cell cycle and the percentage of cells in S-phase is indicated for each treatment. Plots representative of three independent experiments yielding equivalent results are shown. In B, the percentages of apoptosis after 48 hours of treatment are reported as the mean±SD of results from three independent experiments. The asterisk indicates a significant difference (p<0.05) with respect to the treatment with the mix Metformin plus DCA. In C, representative plots of apoptotic cells analyzed by flow-cytometry after annexin-V/PI staining. The percentage of apoptotic cells is indicated for each treatment. Considering that results were comparable in both cell lines, only EHEB results are shown as representative.
Figure 6: Mcl-1 down-regulation in p53 wild-type leukemic cells upon treatment with Metformin plus DCA combination
and with the Met-DCA cocrystal MetH
2++•2DCA
–.
Equal amounts of cell lysates, obtained from JVM-2 cell lines treated for 24 hours as indicated, were analyzed for Mcl-1 and Bcl-2 protein levels by Western blotting. Tubulin staining is shown as a loading control. Blottings representative of at least three independent experiments yielding equivalent results in both JVM-2 and EHEB cells, are shown. Mcl-1 bands’ density was quantified using Image Quant TL software and normalized to the untreated band (set at 100%) on the same membrane. Data are reported as mean±SD, The asterisk indicates a significant difference (p<0.05) with respect to the treatment with the single treatments.Figure 7: Cell cytotoxicity and Mcl-1 down-modulation on p53 mutated B leukemic cells in response to treatment
with Metformin plus DCA combination and with the Met-DCA cocrystal MetH
2++•2DCA
–.
MEC-2 p53mutated leukemic cellswere exposed to Metformin (10 mM), DCA (20 mM), alone or in combination, or to the Met-DCA cocrystal MetH2++•2DCA−(10 mM)
before analysis. In A. representative plots of apoptotic cells analyzed by flow-cytometry after Annexin-V/PI staining after 48 hours of treatment are shown. The percentage of apoptotic cells is indicated for each treatment. Results representative of at least three independent experiments yielding equivalent results are shown. In B. equal amounts of cell lysates, obtained from MEC-2 cell lines treated for 24 hours as indicated, were analyzed for Mcl-1 and Bcl-2 protein levels by Western blotting. Tubulin staining is shown as a loading control. Blottings representative of at least three independent experiments yielding equivalent results are shown. Bands’ density was quantified using Image Quant TL software and normalized to the untreated band (set at 100%) on the same membrane. Data are reported as mean±SD, The asterisk indicates a significant difference (p<0.05) with respect to the treatment with the single treatments.
that may be another API that improves the delivery and
complements the efficacy of the reference drug, has
receiving increasing interest for drug development [45].
In virtue of our previous observations documenting
the cytotoxic properties of DCA towards B-CLL [9, 10], in
the present in vitro study, we have analyzed the potential
antileukemic activity of Metformin used in combination
with DCA, either as a mix of the two compounds or as
a cocrystal composed of Metformin and DCA (1:2). We
have documented the ability of the Metformin and DCA
combination and, even more, of the Met-DCA cocrystal,
in promoting cytotoxicity in both B leukemic cell lines
and B-CLL patient derived cell cultures as result of both a
cytostatic and pro-apoptotic effect.
Beyond the plausible effects on several
physicochemical properties (such as solubility), we
observed that the use of the Met-DCA cocrystal enhanced
the biological effect of the mix composed by the two
drugs, probably as a result of an improved cellular uptake
of the cocrystal compared to the reference drugs. We
could argue that the molecule Metformin may act as a
carrier for DCA, which indeed requires high dosage in
therapies because of the low bioavailability [46]. The
concept of an enhanced bioavailability of the cocrystal,
associated to the advantage of administration of a single
pharmaceutic compound instead of the separated reference
drugs, certainly offers better opportunities for future
in vivo preclinical assessments (i.e., investigations in
animal models) and for the translation of the Met-DCA,
compound based on two inexpensive and safe drugs, to
clinical applications.
In the effort to elucidate the molecular mechanism
of action of Met-DCA cocrystal, we investigated whether
the anti-apoptotic Bcl-2 family members might represent
targets for Met-DCA cocrystal. Our data documented a
correlation between Mcl-1 down-regulation and cytotoxicity
induced by the Metformin plus DCA combination and
Met-DCA cocrystal in B leukemic cells, with an early
down-regulation of Mcl-1 (but not of Bcl-2), associated to a
concomitant down-regulation of phospho-Akt, total Akt,
and phospho-STAT3 protein levels, which anticipated the
onset of apoptosis. These data are particularly interesting
since alteration of the intrinsic pathway of apoptosis is a
major target of cancer cells to evade apoptosis, and often
this goal is achieved through the increase in the expression
level of 2 and/or Mcl-1 [47]. In this respect, several
Bcl-2 inhibitors (such as navitoclax and venetoclax) have shown
efficacy as chemotherapy agents in clinical trials, by binding
with high affinity Bcl-2 and Bcl-Xl [48, 49]. However, none
of these compounds can bind and antagonize the prosurvival
activity of the Mcl-1 Bcl-2 family member, which promote
the development of many cancers and/or in their resistance to
chemotherapy [50]. It is also a key factor in the resistance of
malignant cells to navitoclax and venetoclax. Interestingly,
Figure 8: Effects of the Met-DCA cocrystal MetH
2++•2DCA
–on different molecular signaling pathways.
JVM-2 cells were treated with the Met-DCA cocrystal MetH2++•2DCA−(10 mM) for different time-points as indicated. Cell lysates were harvested andanalyzed in immunoblotting using specific antibodies to detect: Mcl-1, Bcl-2 A. Akt, phospho-Akt (Ser473), STAT3, phospho-STAT3 (Ser727) B. AMPKα, phospo-AMPKα (Thr172) C. Tubulin staining is shown as a loading control. Representative examples of Western blotting results of three independent experiments are shown.
it has been recently shown that the Notch-dependent
up-regulation of Mcl-1 promotes survival of B-CLL [51] and
thus it represents an axis for therapeutic interventions in the
perspective to eradicate the leukemic clone.
Since Mcl-1 silencing has been found to elicit tumor
regression and cell death in various cancer models [52],
including B-CLL [53], our data provide the rationale for
further evaluating the use of Met-DCA cocrystal (also
in combination with the Bcl-2 specific targeting drug
venetoclax) for the treatment of B-CLL, also in virtue of the
potential anti-leukemic activity of Met-DCA independently
of the p53 status.
MATERIALS AND METHODS
Cell cultures and treatments
The B leukemic cell lines EHEB, JVM-2 and
MEC-2 were purchased from DSMZ (Deutsche Sammlung von
Mikroorganismen und Zellkulturen GmbH, Braunschweig,
Germany). EHEB and JVM-2 cell lines were routinely
cultured in RPMI-1640, whereas MEC-2 cells were
maintained in IMDM, all supplemented with 10% FBS,
L-glutamine and Penicillin/streptomycin (all from Gibco,
Grand Island, NY). For experiments with primary cells,
peripheral blood samples were collected in heparin-coated
tubes from either normal blood donors or from B-CLL
patients following informed consent, in accordance with the
Declaration of Helsinki and in agreement with institutional
guidelines (University-Hospital of Ferrara). The diagnosis
of B-CLL was made by peripheral blood morphology and
immunophenotyping and all patients had been without
prior therapy at least for three months before blood
collection. Peripheral blood mononuclear cells (PBMC)
were isolated by gradient centrifugation with lymphocyte
cell separation medium (Cedarlane Laboratories, Hornby,
ON). T lymphocytes, NK lymphocytes, granulocytes
and monocytes were negatively depleted from peripheral
blood leucocytes (PBL) with immunomagnetic microbeads
(MACS microbeads, Miltenyi Biotech, Auburn, CA), with
a purity >95% of resulting CD19
+B-CLL population,
assessed by flow cytometry, as previously described [54,
55]. For in vitro assays, both freshly isolated or thawed
B-CLL cells, previously resuspended in freezing solution
(10% DMSO and 90% FBS) and cryopreserved in liquid
nitrogen, were seeded in RPMI containing 10% FBS,
L-glutamine and Penicillin/Streptomicin (Gibco). Freezing/
thawing of B-CLL primary cells did not influence sensitivity
to the treatments, since we assessed in parallel fresh and
frozen/thawed cells of three patients without observing any
significant cytotoxic differences.
Culture treatments, assessment of cell viability,
apoptosis and cell cycle profile
Leukemic cells were treated with serial doses
of Metformin hydrochloride (1,1-Dimethylbiguanide
hydrochloride, Sigma-Aldrich, St Louis, MO; range
0.1-10 mM), DCA (Sigma-Aldrich; range 0.2-20 mM), used
alone or in combination, or with a Met-DCA cocrystal that
was synthesized to combine Metformin plus DCA.
At different time points after treatment, cell viability
was examined by Trypan blue dye exclusion and MTT
(3-(4,5-dimethilthiazol-2yl)-2,5-diphenyl
tetrazolium
bromide) colorimetric assay (Roche Diagnostics
Corporation, Indianapolis, IN) for data confirmation, as
previously described [56, 57]. IC
50values were calculated
from dose-response curves constructed by plotting cell
survival (%) versus drug concentration.
Levels of apoptosis were quantified by Annexin
V-FITC/propidium iodide (PI) staining (Immunotech,
Marseille, France) followed by analysis using a
FACSCalibur flow cytometer (Becton-Dickinson, San
Jose, CA). To avoid non-specific fluorescence from dead
cells, live cells were gated tightly using forward and side
scatter, as described [58, 59]. The cell cycle profile was
analyzed by flow cytometry after 5-bromodeoxyuridine
(BrdU) incorporation, as described [60].
Synthesis of the multicomponent Met-DCA
cocrystals
All adducts of Metformin with DCA (Met-DCA
1:1, MetH
+•DCA
−; Met-DCA 1:2, MetH
2++
•2DCA
−) were
prepared using reagents and solvents purchased from
a commercial source (Sigma Aldrich) and used without
further purification. In particular, synthesis was carried out
as follows:
- Met-DCA 1:1 (MetH
+•DCA
−). A methanol
solution (30 mL) of metformin hydrochloride
(588.7 mg, 3.55 mmol) and sodium dichloroacetate
(536,4 mg, 3.55 mmol) was stirred for 12 hours
at room temperature. The solvent was removed
under reduced pressure and 2-propanol (100 mL)
was added to the reaction solid residue. Suitable
crystals for X-ray diffraction were obtained by
slow evaporation at room temperature of clear
solutions of neutral metformin and dichloroacetic
acid dissolved in 1:1 molecular ratio in a 50:50 (v:v)
methanol/n-pentanol mixture.
- Met-DCA 1:2 (MetH
2++•2DCA
−). Equimolar
amounts of sodium dichloroacetate (512.8 mg,
3.4 mmol) and dichloroacetic acid (438,1 mg,
3.4 mmol) were added to a methanol solution (30
mL) of metformin hydrochloride (562.7 mg, 3.4
mmol) and stirred at room temperature. After 12
hours the solvent was evaporated under reduced
pressure and 2-propanol (100 mL) was added to
the solid sediment. Suitable crystals for X-ray
diffraction were obtained by slow evaporation
at room temperature of clear solutions of neutral
metformin and dichloroacetic acid dissolved in 1:1
and 1:2 molecular ratio, respectively, in a 50:50
(v:v) methanol/n-pentanol mixture.
The identity of chemical composition and crystal
phase of the compounds obtained as powder in larger
amount was assessed by comparing the experimental
X-ray powder diffraction (XRPD) patterns with those
calculated using the program Mercury [x2] from the
structures determined by single-crystal X-ray diffraction.
The crystal data of compounds DCA 1:1 and
Met-DCA 1:2 were collected at room temperature using
a Nonius Kappa CCD diffractometer with graphite
monochromated Mo-Kα radiation (Bruker-Nonius, Milan,
Italy). [61, 62].
Western blotting analyses
For Western blotting analysis, cells were lysed as
previously described [63, 64]. Protein determination was
performed by BCA Protein Assay (Thermo Scientific,
Rockford, IL). Equal amounts of protein for each sample
were migrated in SDS-polyacrylamide gels and blotted
onto nitrocellulose filters. The following Abs were used:
anti-Mcl-1 (S-19) and anti-Bcl-2 (100) from Santa Cruz
Biotechnology (Santa Cruz, CA); anti-phospho-AMPKα
(Thr172, D79.5E), anti-AMPKα, anti-phospho-STAT3
(Ser727) and anti- STAT3 from Cell Signalling (Danvers,
MA); anti-phospho-Akt1/PKBα (Ser473) from Merck
Millipore (Darmstadt, Germany); anti AKT/PKBα from BD;
tubulin from Sigma-Aldrich. After incubation with
anti-mouse or anti-rabbit IgG horseradish peroxidase-conjugated
secondary Abs (Sigma-Aldrich), specific reactions were
revealed with the ECL Lightning detection kit (Perkin
Elmer, Waltham, MA). The estimation of the densitometry
values of bands was obtained by the ImageQuant TL
software (GE Healthcare, Buckinghamshire, UK).
Statistical analysis and assessment of the effect
of combination treatment
The results were evaluated by using analysis of
variance with subsequent comparisons by Student’s t-test and
with the Mann-Whitney rank-sum test. Statistical significance
was defined as p<0.05. In order to investigate the effect of
Metformin plus DCA combination, leukemic cells were
treated with serial doses of Metformin or DCA, individually
or in combination using a constant ratio (Metformin:DCA).
Results were analyzed with the method of Chou and Talalay
[26] to determine whether combined treatment yields greater
effects than expected from summation alone: a combination
index (CI) of 1 indicates an additive effect, while a CI
below 1 indicates synergism. For this purpose cell viability
data were analyzed with the CalcuSyn software (Biosoft,
Cambridge, UK) and reported either as CI values or as
dose-effect curves directly drawn by the CalcuSyn software.
CONFLICTS OF INTEREST
All authors declare no conflict of interest.
REFERENCES
1. Michelakis ED, Webster L, Mackey JR. Dichloroacetate (DCA) as a potential metabolic-targeting therapy for cancer. Br J Cancer. 2008; 99: 989-994.
2. Kim JW, Dang CV. Cancer’s molecular sweet tooth and the Warburg effect. Cancer Res. 2006; 66: 8927-8930. 3. Chen Y, Cairns R, Papandreou I, Koong A, Denko NC.
Oxygen consumption can regulate the growth of tumors, a new perspective on the Warburg effect. PLoS One. 2009; 4: e7033. 4. Bonnet S, Archer SL, Allalunis-Turner J, Haromy A,
Beaulieu C, Thompson R, Lee CT, Lopaschuk GD, Puttagunta L, Bonnet S, Harry G, Hashimoto K, Porter CJ, Andrade MA, Thebaud B, Michelakis ED. A mitochondria-K+ channel axis is suppressed in cancer and its normalization promotes apoptosis and inhibits cancer growth. Cancer Cell. 2007; 11: 37-51.
5. Michelakis ED, Sutendra G, Dromparis P, Webster L, Haromy A, Niven E, Maguire C, Gammer TL, Mackey JR, Fulton D, Abdulkarim B, McMurtry MS, Petruk KC. Metabolic modulation of glioblastoma with dichloroacetate. Sci Transl Med. 2010; 2: 31ra34.
6. Sun RC, Fadia M, Dahlstrom JE, Parish CR, Board PG, Blackburn AC. Reversal of the glycolytic phenotype by dichloroacetate inhibits metastatic breast cancer cell growth in vitro and in vivo. Breast Cancer Res Treat. 2010; 120: 253-260. 7. Ayyanathan K, Kesaraju S, Dawson-Scully K, Weissbach
H. Combination of sulindac and dichloroacetate kills cancer cells via oxidative damage. PLoS One. 2012; 7: e39949. 8. Sanchez WY, McGee SL, Connor T, Mottram B, Wilkinson A,
Whitehead JP, Vuckovic S, Catley L. Dichloroacetate inhibits aerobic glycolysis in multiple myeloma cells and increases sensitivity to bortezomib. Br J Cancer. 2013; 108: 1624-1633. 9. Agnoletto C, Melloni E, Casciano F, Rigolin GM, Rimondi
E, Celeghini C, Brunelli L, Cuneo A, Secchiero P, Zauli G. Sodium dichloroacetate exhibits anti-leukemic activity in B-chronic lymphocytic leukemia (B-CLL) and synergizes with the p53 activator Nutlin-3. Oncotarget. 2014; 5: 4347-4360. doi: 10.18632/oncotarget.2018
10. Agnoletto C, Brunelli L, Melloni E, Pastorelli R, Casciano F, Rimondi E, Rigolin GM, Cuneo A, Secchiero P, Zauli G. The anti-leukemic activity of sodium dichloroacetate in p53mutated/null cells is mediated by a p53-independent ILF3/p21 pathway. Oncotarget. 2015; 6: 2385-2396. doi: 10.18632/oncotarget.2960
11. Owen MR, Doran E, Halestrap AP. Evidence that metformin exerts its anti-diabetic effects through inhibition of complex 1 of the mitochondrial respiratory chain. Biochem J. 2000; 348: 607-614.
12. Scotland S, Saland E, Skuli N, de Toni F, Boutzen H, Micklow E, Sénégas I, Peyraud R, Peyriga L, Théodoro F, Dumon E, Martineau Y, Danet-Desnoyers G, Bono F, Rocher C, Levade T, Manenti S, Junot C, Portais JC, Alet N, Récher C, Selak MA, Carroll M, Sarry JE. Mitochondrial
energetic and AKT status mediate metabolic effects and apoptosis of metformin in human leukemic cells. Leukemia. 2013; 27: 2129-2138.
13. Leclerc GM, Leclerc GJ, Kuznetsov JN, DeSalvo J, Barredo JC. Metformin induces apoptosis through AMPK-dependent inhibition of UPR signaling in ALL lymphoblasts. PLoS One. 2013; 8: e74420.
14. Martinez Marignac VL, Smith S, Toban N, Bazile M, Aloyz R. Resistance to Dasatinib in primary chronic lymphocytic leukemia lymphocytes involves AMPK-mediated energetic re-programming. Oncotarget. 2013; 4: 2550-2566. doi: 10.18632/oncotarget.1508
15. Cohen R, Neuzillet C, Tijeras-Raballand A, Faivre S, de Gramont A, Raymond E. Targeting cancer cell metabolism in pancreatic adenocarcinoma. Oncotarget. 2015; 6: 16832-16847. doi: 10.18632/oncotarget.4160
16. Morales DR, Morris AD. Metformin in cancer treatment and prevention. Annu Rev Med. 2015; 66: 17-29.
17. He H, Ke R, Lin H, Ying Y, Liu D, Luo Z. Metformin, an old drug, brings a new era to cancer therapy. Cancer J. 2015; 21: 70-74.
18. Li W, Saud SM, Young MR, Chen G, Hua B. Targeting AMPK for cancer prevention and treatment. Oncotarget. 2015; 6: 7365-7378. doi: 10.18632/oncotarget.3629 19. Choi YW, Lim IK. Sensitization of metformin-cytotoxicity
by dichloroacetate via reprogramming glucose metabolism in cancer cells. Cancer Lett. 2014; 346: 300-308.
20. Zenz T, Kröber A, Scherer K, Häbe S, Bühler A, Benner A, Denzel T, Winkler D, Edelmann J, Schwänen C, Döhner H, Stilgenbauer S. Monoallelic TP53 inactivation is associated with poor prognosis in chronic lymphocytic leukemia: results from a detailed genetic characterization with long-term follow-up. Blood. 2008; 112: 3322-3329.
21. Dicker F, Herholz H, Schnittger S, Nakao A, Patten N, Wu L, Kern W, Haferlach T, Haferlach C. The detection of TP53 mutations in chronic lymphocytic leukemia independently predicts rapid disease progression and is highly correlated with a complex aberrant karyotype. Leukemia. 2009; 23: 117-124.
22. Rossi D, Cerri M, Deambrogi C, Sozzi E, Cresta S, Rasi S, De Paoli L, Spina V, Gattei V, Capello D, Forconi F, Lauria F, Gaidano G. The prognostic value of TP53 mutations in chronic lymphocytic leukemia is independent of Del17p13: implications for overall survival and chemorefractoriness. Clin Cancer Res. 2009; 15: 995-1004.
23. Malcikova J, Smardova J, Rocnova L, Tichy B, Kuglik P, Vranova V, Cejkova S, Svitakova M, Skuhrova Francova H, Brychtova Y, Doubek M, Brejcha M, Klabusay M et al. Monoallelic and biallelic inactivation of TP53 gene in chronic lymphocytic leukemia: selection, impact on survival, and response to DNA damage. Blood. 2009; 114: 5307-5314. 24. Zenz T, Eichhorst B, Busch R, Denzel T, Häbe S, Winkler
D, Bühler A, Edelmann J, Bergmann M, Hopfinger G, Hensel M, Hallek M, Döhner H et al. TP53 mutation and
survival in chronic lymphocytic leukemia. J Clin Oncol. 2010; 28: 4473-4479.
25. Dufour A, Palermo G, Zellmeier E, Mellert G, Duchateau-Nguyen G, Schneider S, Benthaus T, Kakadia PM, Spiekermann K, Hiddemann W, Braess J, Truong S, Patten N et al. Inactivation of TP53 correlates with disease progression and low miR-34a expression in previously treated chronic lymphocytic leukemia patients. Blood. 2013; 121: 3650-3657. 26. Chou TC, Talalay P. Quantitative analysis of dose-effect
relationships: the combined effects of multiple drugs or enzyme inhibitors. Adv Enzyme Regul. 1984; 22: 27-55. 27. Moon HS, Kim B, Gwak H, Suh DH, Song YS. Autophagy
and protein kinase RNA-like endoplasmic reticulum kinase (PERK)/eukaryotic initiation factor 2 alpha kinase (eIF2α) pathway protect ovarian cancer cells from metformin-induced apoptosis. Mol Carcinog. 2016; 55:346-56. doi: 10.1002/mc.22284.
28. Yue W, Zheng X, Lin Y, Yang CS, Xu Q, Carpizo D, Huang H, DiPaola RS, Tan XL. Metformin combined with aspirin significantly inhibit pancreatic cancer cell growth in vitro and in vivo by suppressing anti-apoptotic proteins Mcl-1 and Bcl-2. Oncotarget. 2015; 6: 21208-21224. doi: 10.18632/oncotarget.4126
29. Zi FM, He JS, Li Y, Wu C, Yang L, Yang Y, Wang LJ, He DH, Zhao Y, Wu WJ, Zheng GF, Han XY, Huang H, Yi Q, Cai Z. Metformin displays anti-myeloma activity and synergistic effect with dexamethasone in in vitro and in vivo xenograft models. Cancer Lett. 2015; 356: 443-453. 30. Dalva-Aydemir S, Bajpai R, Martinez M, Adekola KU,
Kandela I, Wei C, Singhal S, Koblinski JE, Raje NS, Rosen ST, Shanmugam M. Targeting the metabolic plasticity of multiple myeloma with FDA-approved ritonavir and metformin. Clin Cancer Res. 2015; 21: 1161-1171. 31. Pepper C, Lin TT, Pratt G, Hewamana S, Brennan P, Hiller
L, Hills R, Ward R, Starczynski J, Austen B, Hooper L, Stankovic T, Fegan C. Mcl-1 expression has in vitro and in vivo significance in chronic lymphocytic leukemia and is associated with other poor prognostic markers. Blood. 2008; 112: 3807-3817.
32. Veronese L, Tournilhac O, Verrelle P, Davi F, Dighiero G, Chautard E, Veyrat-Masson R, Kwiatkowski F, Goumy C, Vago P, Travade P, Tchirkov A. Low MCL-1 mRNA expression correlates with prolonged survival in B-cell chronic lymphocytic leukemia. Leukemia. 2008; 22: 1291-1293.
33. Coloff JL, Macintyre AN, Nichols AG, Liu T, Gallo CA, Plas DR, Rathmell JC. Akt dependent glucose metabolism promotes Mcl-1synthesis to maintain cell survival and resistance to Bcl-2 inhibition. Cancer Res. 2011; 71: 5204-5213.
34. Feng Y, Ke C, Tang Q, Dong H, Zheng X, Lin W, Ke J, Huang J, Yeung SC, Zhang H. Metformin promotes autophagy and apoptosis in esophageal squamous cell carcinoma by downregulating Stat3 signaling. Cell death & disease. 2014; 5: e1088.
35. Bhattacharya S, Ray RM, Johnson LR. STAT3-mediated transcription of Bcl-2, Mcl-1 and c-IAP2 prevents apoptosis in polyamine-depleted cells. The Biochemical journal. 2005; 392: 335-344.
36. Hazan-Halevy I, Harris D, Liu Z, Liu J, Li P, Chen X, Shanker S, Ferrajoli A, Keating MJ, Estrov Z. STAT3 is constitutively phosphorylated on serine 727 residues, binds DNA, and activates transcription in CLL cells. Blood. 2010; 115: 2852–2863. 37. Longo PG, Laurenti L, Gobessi S, Sica S, Leone G,
Efremov DG. The Akt/Mcl-1 pathway plays a prominent role in mediating antiapoptotic signals downstream of the B-cell receptor in chronic lymphocytic leukemia B cells. Blood. 2008; 111: 846-855.
38. Lee YK, Shanafelt TD, Bone ND, Strege AK, Jelinek DF, Kay NE. VEGF receptors on chronic lymphocytic leukemia (CLL) B cells interact with STAT 1 and 3: implication for apoptosis resistance. Leukemia. 2005; 19: 513-523. 39. Bruno S, Ledda B, Tenca C, Ravera S, Orengo AM,
Mazzarello N, Pesenti E, Casciaro S, Racchi O, Ghiotto F, Marini C, Sambuceti G, DeCensi A, Fais F. Metformin inhibits cell cycle progression of B-cell chronic lymphocytic leukemia cells. Oncotarget. 2015; 6: 22624-22640. doi: 10.18632/oncotarget.4168
40. Zhou G, Myers R, Li Y, Chen Y, Shen X, Fenyk-Melody J, Wu M, Ventre J, Doebber T, Fujii N, Musi N, Hirshman MF, Goodyear LJ, Moller DE. Role of AMP-activated protein kinase in mechanism of metformin action. J Clin Invest. 2001; 108: 1167-1174.
41. Kim SM, Yun MR, Hong YK, Solca F, Kim JH, Kim HJ, Cho BC. Glycolysis inhibition sensitizes non-small cell lung cancer with T790M mutation to irreversible EGFR inhibitors via translational suppression of Mcl-1 by AMPK activation. Mol Cancer Ther. 2013; 12: 2145-2156. 42. Pradelli LA, Bénéteau M, Chauvin C, Jacquin MA, Marchetti
S, Muñoz-Pinedo C, Auberger P, Pende M, Ricci JE. Glycolysis inhibition sensitizes tumor cells to death receptors-induced apoptosis by AMP kinase activation leading to Mcl-1 block in translation. Oncogene. 2010; 29: 1641-1652. 43. Center for Drug Evaluation and Research. Guidance
for industry: regulatory classification of pharmaceutical co-crystals. Rockville, Maryland: United States Food and Drug Administration. 2011.
44. Schultheiss N, Newman A. Pharmaceutical Cocrystals and Their Physicochemical Properties. Cryst Growth Des. 2009; 9: 2950-2967.
45. Almarsson O, Zaworotko MJ. Crystal engineering of the composition of pharmaceutical phases. Do pharmaceutical co-crystals represent a new path to improved medicines? Chem Commun (Camb). 2004; 17: 1889-1896.
46. Chu QS, Sangha R, Spratlin J, J Vos L, Mackey JR, McEwan AJ, Venner P, Michelakis ED. A phase I open-labeled, single-arm, dose-escalation, study of dichloroacetate (DCA) in patients with advanced solid tumors. Invest New Drugs. 2015; 33: 603-610.
47. Hanahan D, Weinberg RA. Hallmarks of cancer: the next generation. Cell. 2011; 144: 646-674.
48. Billard C. BH3 mimetics: status of the field and new developments. Molecular cancer therapeutics. 2013; 12: 1691-1700.
49. Anderson MA, Huang D, Roberts A. Targeting BCL2 for the treatment of lymphoid malignancies. Semin Hematol. 2014; 51: 219-227.
50. Perciavalle RM, Opferman JT. Delving deeper: MCL-1’s contributions to normal and cancer biology. Trends Cell Biol. 2013; 23: 22-29.
51. De Falco F, Sabatini R, Del Papa B, Falzetti F, Di Ianni M, Sportoletti P, Baldoni S, Screpanti I, Marconi P, Rosati E. Notch signaling sustains the expression of Mcl-1 and the activity of eIF4E to promote cell survival in CLL. Oncotarget. 2015; 6: 16559-16572. doi: 10.18632/ oncotarget.4116
52. Besbes S, Billard C. First MCL-1-selective BH3 mimetics as potential therapeutics for targeted treatment of cancer. Cell Death Dis. 2015; 6: e1810.
53. Choudhary GS, Al-Harbi S, Mazumder S, Hill BT, Smith MR, Bodo J, Hsi ED, Almasan A. MCL-1 and BCL-xL-dependent resistance to the BCL-2 inhibitor ABT-199 can be overcome by preventing PI3K/AKT/mTOR activation in lymphoid malignancies. Cell Death Dis. 2015; 6: e1593. 54. Secchiero P, Melloni E, di Iasio MG, Tiribelli M, Rimondi
E, Corallini F, Gattei V, Zauli G. Nutlin-3 up-regulates the expression of Notch1 in both myeloid and lymphoid leukemic cells, as part of a negative feedback antiapoptotic mechanism. Blood. 2009; 113: 4300-4308.
55. Zauli G, Voltan R, di Iasio MG, Bosco R, Melloni E, Sana ME, Secchiero P. miR-34a induces the down-regulation of both E2F1 and B-Myb oncogenes in leukemic cells. Clin Cancer Res. 2011; 17: 2712-2724.
56. Zauli G, Re MC, Visani G, Furlini G, Mazza P, Vignoli M, La Placa M. Evidence for a human immunodeficiency virus type 1-mediated suppression of uninfected hematopoietic (CD34+) cells in AIDS patients. J Infect Dis. 1992; 166: 710-716.
57. Zauli G, Re MC, Furlini G, Giovannini M, La Placa M. Human immunodeficiency virus type 1 envelope glycoprotein gp120-mediated killing of human haematopoietic progenitors (CD34+ cells). J Gen Virol. 1992; 73: 417-421.
58. Campioni D, Corallini A, Zauli G, Possati L, Altavilla G, Barbanti-Brodano G. HIV type 1 extracellular tat protein stimulates growth and protects cells of BK virus/ tat transgenic mice from apoptosis. AIDS Res Hum Retroviruses. 1995; 11: 1039-1048.
59. Zauli G, Voltan R, Bosco R, Melloni E, Marmiroli S, Rigolin GM, Cuneo A, Secchiero P. Dasatinib plus Nutlin-3 shows synergistic antileukemic activity in both p53 wild-type and p53 mutated B chronic lymphocytic leukemias by inhibiting the Akt pathway. Clin Cancer Res. 2011; 17: 762-770.
60. Borgatti P, Mazzoni M, Carini C, Neri LM, Marchisio M, Bertolaso L, Previati M, Zauli G, Capitani S. Changes of nuclear protein kinase C activity and isotype composition in PC12 cell proliferation and differentiation. Exp Cell Res. 1996; 224: 72-78.
61. Macrae CF, Bruno IJ, Chisholm JA, Edgington PR, McCabe P, Pidcock E, Rodriguez-Monge L, Taylor R, van de Streek J, Wood PA. Mercury CSD2.0 – new features for the visualization and investigation of crystal structures. J Appl Crystallogr. 2008; 41: 466-470.
62. Pérez-Fernández R, Fresno N, Goya P, Elguero J, Menéndez-Taboada L, García-Granda S, Marco C. Structure and thermodynamical properties of metformin salicylate. Cryst Growth Des. 2013; 13: 1780-1785.
63. Zauli G, Vitale M, Re MC, Furlini G, Zamai L, Falcieri E, Gibellini D, Visani G, Davis BR, Capitani S, La Placa M. In vitro exposure to human immunodeficiency virus type-1 induces apoptotic cell death of the factor-dependent TF-1 hematopoietic cell line. Blood. 1994; 83: 167-175.
64. Secchiero P, Sun D, De Vico AL, Crowley RW, Reitz MS, Zauli G, Lusso P, Gallo RC. Role of the extracellular domain of human herpesvirus 7 glycoprotein B in virus binding to cell surface heparan sulfate proteoglycans. J Virol. 1997; 71: 4571-4580.