R E S E A R C H
Open Access
Liquid biopsy in mice bearing colorectal
carcinoma xenografts: gateways regulating
the levels of circulating tumor DNA (ctDNA)
and miRNA (ctmiRNA)
Jessica Gasparello
1†, Matteo Allegretti
2†, Elisa Tremante
2, Enrica Fabbri
1, Carla Azzurra Amoreo
3, Paolo Romania
2,
Elisa Melucci
3, Katia Messana
2, Monica Borgatti
1, Patrizio Giacomini
2*, Roberto Gambari
1*and Alessia Finotti
1Abstract
Background: Circulating tumor DNA (ctDNA) and miRNA (ctmiRNA) are promising biomarkers for early tumor diagnosis, prognosis and monitoring, and to predict therapeutic response. However, a clear understanding of the fine control on their circulating levels is still lacking.
Methods: Three human colorectal carcinoma cell lines were grown in culture and as tumor xenograft models in nude mice. Chip-based and droplet digital PCR platforms were used to systematically and quantitatively assess the levels of DNAs and miRNAs released into the culture supernatants and mouse blood plasma.
Results: Strikingly, mutated DNAs from the same (KRAS) and different (PIK3CA and FBWX7) genomic loci were differentially detected in culture supernatants and blood, with LS174T releasing 25 to 60 times less DNA in culture, but giving rise to 7 to 8 times more DNA in blood than LoVo cells. Greater LS174T ctDNA accumulation occurred in spite of similar CD31 immunostaining (micro-vascularization) and lesser proliferation and tissue necrosis as compared to LoVo. As to the three selected miRNAs (miR-221, miR-222 and miR-141), all of them were constitutively present in the plasma of tumor-free mice. Micro-RNA miR-141 was released into HT-29 cell supernatants 10 and 6.5 times less abundantly with respect to LoVo and LS174T, respectively; on the contrary, release of miR-141 in blood of HT-29 xenografted mice was found similar to that observed in LoVo and LS174T mice.
Conclusions: Taken together, our results support the existence of multiple, finely tuned (non-housekeeping) control gateways that selectively regulate the release/accumulation of distinct ctDNA and miRNA species in culture and tumor xenograft models. Different xenografts (proxies of different patients) considerably differ in gateway usage, adding several layers of complexity to the well-known idea of molecular heterogeneity. We predict that even high tissue representation of mutated DNA and miRNA may result in insufficient diagnostic analyte representation in blood. In this respect, our data show that careful modeling in mice may considerably help to alleviate complexity, for instance by pre-screening for the most abundant circulating analytes in enlarged sets of tumor xenografts.
Keywords: Colorectal carcinoma, Liquid biopsy, ctDNA, ctmiRNA, Tumor xenotransplants
* Correspondence:[email protected];[email protected]
†Jessica Gasparello and Matteo Allegretti contributed equally to this work. 2Oncogenomics and Epigenetics, IRCSS Regina Elena National Cancer
Institute, Via E. Chianesi 53, 00144 Rome, Italy
1Department of Life Sciences and Biotechnology, Biochemistry and Molecular
Biology Section, Ferrara University, Via Fossato di Mortara 74, 44121 Ferrara, Italy
Full list of author information is available at the end of the article
© The Author(s). 2018 Open Access This article is distributed under the terms of the Creative Commons Attribution 4.0 International License (http://creativecommons.org/licenses/by/4.0/), which permits unrestricted use, distribution, and reproduction in any medium, provided you give appropriate credit to the original author(s) and the source, provide a link to the Creative Commons license, and indicate if changes were made. The Creative Commons Public Domain Dedication waiver (http://creativecommons.org/publicdomain/zero/1.0/) applies to the data made available in this article, unless otherwise stated.
Background
Soluble biomarkers in body fluids, particularly those cir-culating in the bloodstream, provide key diagnostic in-formation in several human diseases, including cancer. The carcinoembryonic antigen (CEA), for instance, has been used for decades to diagnose and monitor cancer progression, since elevated levels are associated with cancer spreading. However, as for many other ‘first gen-eration’ biomarkers, circulating levels of this analyte are variable in healthy individuals and often overlap in un-affected and diseased populations, detracting from their general applicability [1–3].
In the last few years, the introduction of precision diag-nostics has revolutionized the entire biomarker field. Un-like conventional markers,‘precision’ biomarkers such as circulating tumor DNA (ctDNA) and miRNA (ctmiRNA) reveal genetic and epigenetic aberrations that directly drive cancer [4]. In addition, unique mutations of ctDNAs are virtually cancer-specific, and ctmiRNA signatures pin-point specific biological features. Indeed, every cancer pa-tient is believed to host a unique set of tumor aberrations (e.g. DNA mutations and/or overexpressed miRNAs), each of which can be detected in the blood and used as a surrogate or‘index’ biomarker for cancer diagnosis, prog-nosis, therapeutic assignment, and follow-up [4].
Detection of ctDNA/ctmiRNAs in body fluids, usually referred to as liquid biopsy, has demonstrated great po-tential. However, this approach also suffers from some limitations, both theoretical and technical [5, 6]. Ex-treme personalization may be challenging. The biological processes underpinning release of index aberrations are complex, highly dependent on the analyte being consid-ered, and may differ in different patients. RAS muta-tions, for instance, are often subclonal, preventing their consistent appreciation in a liquid biopsy format [7]. Therefore, capturing the mutational complexity of can-cer by liquid biopsy will require the combination of mul-tiple index aberration, ideally from different classes of analytes, into a single multi-marker assay.
In light of this, it is mandatory to address the variables determining the availability of circulating analytes and design optimized multi-marker panels, but this may prove extremely challenging and ethically questionable if one exclusively relies on human specimens. Additionally, in vitro spiking experiments with known amounts of DNAs/miRNAs may fail to resolve the mechanisms of analyte formation, release in the extracellular spaces, ex-port into the bloodstream, and eventually persistence in a soluble, detectable form. Therefore, controlled animal models are required to optimize liquid biopsy ap-proaches, and spare ethically sensitive clinical material from cancer patients.
In this study, we take advantage of chip-based and droplet digital PCR platforms and enumerate ctDNAs
and miRNAs released from three human colorectal car-cinoma (CRC) cell lines with different KRAS genotypes. We systematically compare levels of mutations from the same (KRAS) and different (PIK3CA and FBWX7) gen-omic loci and miRNAs (namely miR-221, miR-222, and miR-141) in cell extracts and culture supernatants on the one hand, and the corresponding mouse tumor xe-nografts and matched blood samples from these mice on the other. This simple and informative experimental model reveals the existence of crucial gateways that are likely to determine biological fates and clinical useful-ness of single ctDNA and ctmiRNA species in individual patients.
Methods
Cell lines and supernatants
Human CRC cells (HT-29, LoVo and LS174T) were pur-chased from the American Type Culture Collection (ATCC). HT-29 cells were derived from a KRAS-WT, differentiated colorectal adenocarcinoma. LoVo cells (originally described as Dukes’ type C, grade IV) and LS174T cells (Dukes’ type B) harbor a heterozygous KRAS c.38G > A mutation (G13D) and a heterozygous KRAS c.35G > A mutation (G12D), respectively. Somatic mutations and their Variant Allelic Frequencies (VAFs) were confirmed by interrogating the Cancer Cell Line Encyclopedia(https://portals.broadinstitute.org/ccle).Cell identity was confirmed by HLA genotyping, as described [8]. Cells were grown in RPMI 1640, 10% fetal bovine serum, 1% l-glutamine and 1% penicillin/streptomycin (all from Euroclone, Milan, Italy) in a humidified atmos-phere containing 5% CO2. To permit the accumulation
of DNA and miRNAs in culture supernatants, cells were grown for 72 h to 70% confluency and manually counted by the Trypan Blue exclusion method. Cells were har-vested and either pelleted and snap-frozen (for miRNA extraction, see below), or Formalin Fixed and Paraffin Embedded (FFPE), as routinely done for histological specimens (for DNA extraction, see below). Spent medium was then collected, spun twice at 4 °C (2000×g for 20 min and 16,000×g for 10 min), and immediately stored at− 80 °C in aliquots.
Tumor xenografts and plasma preparation
Animal studies were performed according to Directive 2010/63/EU and Italian Decree Law 26/2014. They were approved by the EU Research Executive Agency (REA), the Intramural Regina Elena Board for Animal Welfare, and the Italian Ministry of Health (prot n. 700–2015-PR, dated July 17th, 2015). Tumor xenotransplants were established by inoculating 3 × 10⁶ cells from the HT-29, LS174T and LoVo cell lines in the flank of 4-month old Nu/CD1 mice (Charles River Laboratories, Italy). Xeno-transplants were allowed to grow to two different sizes
(300 and 1000 mm3, 6 mice per group for each of the three cell lines). Additional independent experiments were carried out on smaller cohorts of mice and individ-ual animals. Tumors were taken at sacrifice along with blood, and were divided into two fragments: one half was snap-frozen in liquid nitrogen, the other half was FFPE-processed exactly as routinely done for human diagnostic histopathology. Frozen tissues were used as the source of miRNAs, FFPE samples were used as the source of genomic DNA, for morphological evaluation (hematoxylin/eosin stain), and for immunohistochemis-try (see Additional file 1). Blood was collected in 6 mL BD Vacutainer K2E tubes (BD, #368857) and centrifuged
within 1 h at 2,000×g for 20 min at 4 °C. Plasma was re-covered and further centrifuged at 16,000×g for 10 min at 4 °C to remove cell debris, and stored at− 80 °C until extraction.
DNA extraction
DNA was obtained according to the manufacturer’s (Qiagen, Hilden, Germany) instructions from four differ-ent sources. Genomic DNA was extracted by the QIAamp® DNA FFPE Tissue Kit from FFPE inclusion slices of either (a) cell pellets of cultured cells or (b) tumor xenotransplants. ctDNA was extracted with the QIAamp® CNA kit from either (c) 2 mL of culture super-natants or from (d) 2 mL of mouse plasma. DNAs from (c) and (d) were eluted in a final volume of 30 μL, and stored at − 20 °C. All DNAs were quantified with the Qubit dsDNA assay kit (LifeTechnologies, Carlsbad, CA, USA) prior to dPCR analysis.
miRNA extraction
RNA was extracted from frozen cell (5 × 10⁵) pellets by the TRI-Reagent (Sigma-Aldrich, St.Louis, MO, USA) and from cell culture supernatants according to Turchi-novich et al. [9] with minor modifications. Briefly, 400 μL of culture supernatants were lysed in 1.2 ml of TRIzol LS (Thermo Fisher Scientific, Waltham, MA, USA) in the presence of 12 μg of carrier glycogen (Thermo Fisher Scientific) and 400 attomoles of C. ele-gans miR-39-3p (cel-miR-39-3p) (Thermo Fisher Scien-tific) to control miRNA recovery efficiency. Following phase-partitioning by nuclease-free chloroform (Sig-ma-Aldrich), miRNAs were purified using miRNeasy Serum/Plasma columns (Qiagen). RNA was eluted in 18 μL of nuclease-free water (Sigma-Aldrich). The snap-frozen tumor fragment was homogenized using an IKA T10 Basic Ultraturrax (IKA Werke, Staufen, DE) in TRI-Reagent at maximum speed for 1 min and then processed as above. For the analysis of ctmiRNA, blood plasma (150 μL) was treated to disrupt exosomes and denaturate miRNA-binding proteins in 5 volumes of QIAzol Lysis Reagent (Qiagen). After the addition of
400 amoles of cel-miR-39-3p, total RNA was purified with the miRNeasy Serum/Plasma Kit (Qiagen) in a final volume of 18 μL. All RNAs were stored at − 80 °C until use.
Digital PCR on genomic DNA, supernatants, mouse tissues and ctDNA
DNA samples were dispensed in the chip-based Quant-Studio™ 3D Digital PCR System (Thermo Fisher Scien-tific), and amplified using selected TaqMan™ SNP Genotyping Assays for human KRAS mutations (Table1). dPCR reactions were set up in a final volume of 15 μL, containing 7.5 μL of 2× QuantStudio™ 3D Digital PCR Master Mix, 0.75μL of TaqMan® SNP Genotyping assays (Life Technologies), and different DNA templates, each adjusted in 6.75 μL water, as follows. Genomic DNAs from cells and tumor tissues were 50 ng; DNAs from culture supernatants were 6.75 μL equivalent to 450 μl of supernatant; ctDNAs were 6.75μL equivalent to 45 μl plasma. Thermal cycling was as follows: 10 min at 96.0 ° C, 39 cycles at 56.0 °C for 2 min, 30 s at 98.0 °C, and a final elongation step of 2 min at 60 °C. Copy numbers were calculated assuming that a human haploid genome DNA corresponds to 3.3 pg DNA.
Reverse transcription droplet digital PCR (RT-ddPCR) assays for microRNA expression analysis
Levels of miR-141, miR-221 and miR-222 were assessed by Reverse Transcription droplet digital PCR (RT-ddPCR). 300 ng of total RNA (from cells and tissues) or 3 μL of purified miRNAs (corresponding to 65μL of supernatants and 25 μL of plasma) were reverse transcribed using the TaqMan™ miRNA Reverse Transcription Kit (Thermo Fisher Scientific) according to the manufacturer’s manual, in a final reaction volume of 20μl. 1.3 μL of cDNA, un-diluted (for supernatants and plasma) or un-diluted 1:100 (for cells and tissues), was amplified in a final volume of 20μL, in the presence of ddPCR Supermix for Probes (no dUTP) 2X (Bio-Rad) and TaqMan™ miRNA 20X assays (Thermo Fisher Scientific) (Table 1). 40 μL of droplets emulsion was automatically generated using Automated Droplet Generator (AutoDG) (Bio-Rad) and amplified in a thermal cycler. The following thermal cycler conditions were used: 95 °C for 10 min, 40 cycles of 95 °C for 15 s and 60 °C for 1 min and a final step of 98 °C for 10 min. Droplets were analyzed using the QX200 Droplet Reader, and data analysis was performed with QuantaSoft version 1.7.4 (Bio-Rad).
Results
Study workflow: cells and tumor xenografts as models for liquid biopsy
To assess ctDNAs and miRNAs, a model study was de-signed that includes cells, culture supernatants, tumor
xenografts, and blood samples, as outlined in Fig. 1. Three different CRC cell lines (HT-29, LoVo and LS174T) were selected as proxies of clinically evident cancers and sources of soluble analytes. Because RAS mutations are assessed in the routine diagnosis of colo-rectal carcinoma to assign epidermal growth factor re-ceptor (EGFR) blockade therapy [10], we selected cells that are either wild-type for KRAS (HT-29), or carry the G12D and G13D mutations (LS174T and LoVo, respectively). DNAs and miRNAs were extracted from both cells and culture supernatants, as outlined in Fig. 1 (left). The same cells were also modeled as xenotransplants in nude mice (Fig. 1, right). Matched tumor tissue and blood samples were taken at sacri-fice. All biological specimens were then subjected to dPCR, ddPCR and RT-qPCR analysis as outlined in Materials and Methods.
Genomic and ctDNAs in cells, supernatants, xenotransplants and mouse blood
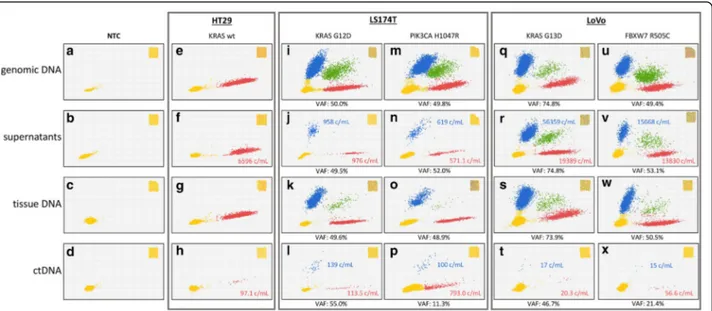
DNAs were obtained from: (1) cell pellets of HT-29, LS174T and LoVo cells grown in culture flasks to ap-proximately (±5%) the same numbers; (2) equal amounts of supernatants from the above flasks; (3) genomic DNAs from tumor xenotransplants grown to 300 mm3 (±15%) in size (all tumors); and (4) equal amounts of pooled blood plasma obtained from the above animals (n = 6). DNAs and ctDNAs were subjected to dPCR for KRAS G12D and G13D, and for control PIK3CA H1047R and FBXW7 R505C mutations, to test DNA fragments originating from the same (KRAS) as well as distinct (PIK3CA and FBXW7) genomic loci in two dif-ferent (LS174T and LoVo) CRC cell lines. Mutated RAS sequences were detected in LoVo and LS174T (Fig. 2, panels I-X), but not in KRAS-WT HT-29 cells (E-H), as expected. VAFs in cells and tissues were approxi-mately 50% in all cases (I, M, K, O, U, V), as ex-pected, with the exception of KRAS in LoVo (Q and S, approximately 75%), confirming copy number vari-ation of the KRAS MUT allele in the absence of
chromosome 12 duplication (see whole genome se-quencing data in the Cancer Cell Line Encyclopedia at
https://portals.broadinstitute.org/ccle). However, and interestingly, when free soluble DNAs were consid-ered, a strikingly higher variability was readily observed in both VAFs and absolute copy numbers per mL. Specifically, KRAS G12D DNA from LS174T was almost 60 times less abundant than G13D DNA from LoVo (958 vs 56,359 copies/mL; compare J and R) in culture supernatants and, viceversa, it was ap-proximately 8 times more abundant (compare L and T; 139 vs 17 c/mL) in blood, demonstrating a 500-fold difference in the ability of the two cell lines to generate accumulation of RAS ctDNA in cell su-pernatants vs blood of tumor-xenotransplanted mice. Likewise, comparison of PI3KCA and FBXW7 (com-pare N to V, and P to X) demonstrated greater (25 times) and lesser (7 times) relative abundances of the two mutations in culture supernatants and blood, resulting in a 175-fold difference that is in full agree-ment with KRAS ctDNA blood accumulation prefer-ences (LS174T > LoVo). Altogether, ctDNA levels appear to reflect a cell line-dependent property only marginally affected by the genomic regions of origin of the soluble analytes. Preferential ctDNA accumula-tion in the blood of LS174T xenografts was repro-duced in: (a) two separate cohorts of 6 mice carrying larger (1000 mm3) tumors, (b) two additional, distinct plasma samples obtained by pooling blood from two cohorts of three animals each, and (c) two plasma samples from two individual animals (data not shown). Altogether, our results suggest the existence of a minimum of two gateways. The first gateway pre-dominantly operates in LS174T cells by controlling DNA scavenging towards the microenvironment, since this cell line releases in vitro much less DNA than LoVo. Conversely, the latter gateway becomes evident in LoVo cells when they are grown as tumor xeno-grafts, and prevents the accumulation of mutated ctDNA in blood.
Table 1 TaqMan assays (primer and probe sets) employed in dPCR, RT-ddPCR and RT-experiments
Assay (primers and probe) Assay codea Employed technology
KRAS p. G12D KRAS_521, ID AH6R5PIb dPCR
KRAS p. G13D KRAS_ 532, ID AHD2BW0b dPCR
PIK3CA p. H1047R PIK3CA_775, ID AHPAVCDb dPCR
FBXW7 p. R505C custom assay, ID ANZTGJUb dPCR
hsa-miR-141-3p 000463c RT-ddPCR, RT-qPCR
hsa-miR-221-3p 000524c RT-ddPCR, RT-qPCR
hsa-miR-222-3p 002276c RT-ddPCR, RT-qPCR
cel-miR-39-3p 000200c RT-ddPCR, RT-qPCR
a
All assays are provided from Thermo Fisher Scientific.b
This assay was used for dPCR on genomic DNA and ctDNA.c
This assay was used for reverse transcription and amplification of microRNAs in ddPCR and quantitative PCR
Cellular and histopathological features potentially associated with ctDNA accumulation
At least 3 major cellular/histopathological features are known to account for DNA accumulation in the extracellu-lar milieu and/or in blood: cell proliferation, tissue necrosis and tumor micro-vasculature [4]. A simple explanation of ctDNA accumulation based on cell proliferation is unlikely, since LS174T proliferate much faster than LoVo cells both
in culture and as xenografts (doubling times of 24 h vs 96 h in culture, and 4 days vs 17 days in the mouse, respectively), but the preferential accumulation of LS174T DNA is evi-dent only in blood. It may then be hypothesized that this preferential ctDNA release might depend on the tissue architecture, e.g. necrosis or micro-vasculature. However, morphological evaluation revealed higher percentages of necrotic areas in low-ctDNA-releasing LoVo as compared
Fig. 1 Study workflow. Three human colorectal cancer cell lines (HT-29, LoVo and LS174T) were selected as proxies of clinical cancers and cultured in vitro (left) or used to establish tumor xenografts (right). DNA and RNA were isolated from cells, supernatants and tumor xenografts. ctDNAs and miRNAs were isolated from blood plasma. dPCR, RT-ddPCR and RT-qPCR were performed to detect KRAS G12D and G13D, PIK3CA H1047R, FBXW7 R505C mutations and miR-141, miR-221 and miR-222 expression levels
to LS174T xenografts (30% vs 45%). Moreover, staining with antibodies to the endothelial marker CD31 demon-strated very similar numbers (about 14/microscopic field) of blood micro-vessels in LS174T and LoVo xenografts (Additional file1: Figures S1 and S2). These results suggest that ctDNA gateways operate independently of tissue archi-tecture, e.g. they are likely dependent on constraints on ctDNA release that operate both at single-cell and whole-body levels, but independent from housekeeping functions associated with cell proliferation, tumor necrosis and tumor vascularization.
miRNAs in cell lines and culture supernatants
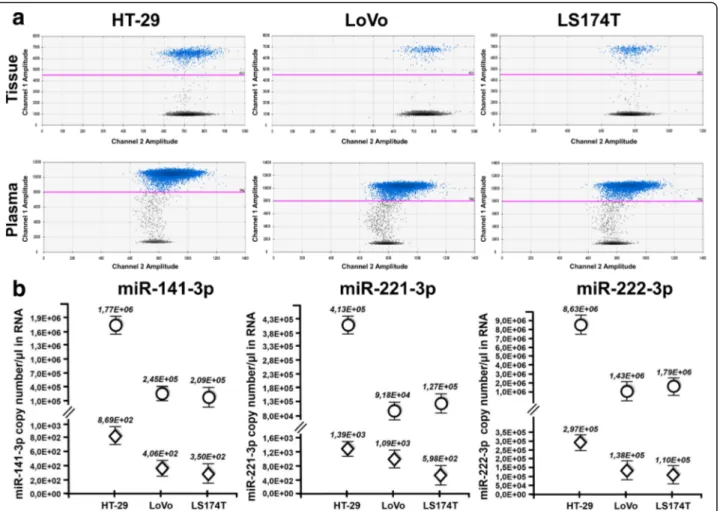
Next, we wondered whether similar gateways regulate circulating miRNAs. Three miRNAs (miR-221, miR-222 and miR-141) were selected since they were previously described to affect colorectal cancer biology and clinical behavior [11, 12]. RNAs from dry frozen pellets and the corresponding culture supernatants were reverse tran-scribed, and amplified by ddPCR. 2D plots of representa-tive miR-222-3p experiments and the complete dataset for the three miRNAs (cell lines and supernatants) are shown in Fig.3a(top and bottom panels respectively). In parallel, in Fig. 3b, are reported the copy number/μl of
RNA of all the three miRs analized in cells and superna-tants (dots and diamonds respectively). From Fig. 3 it may be seen that miR-222 is more abundant in the su-pernatants from the cells in which it is expressed most (for instance 5.454 and 7.383 miR-222 molecules/μl of RNA are present in the supernatant of LoVo and HT-29
cells, respectively; similarly, the intracellular accumula-tion of miR-222 was 9.016 and 3.326 molecules/μl of RNA). Data reported in Fig. 3b indicate that miR-221 and miR-222, that belong to the same miRNA cluster, are proportionately expressed in cells and supernatants, whereas miR-141 levels do not correlate between cells and supernatants, since HT-29 cells express high levels of miR-141 (1.066 molecules/μl of RNA, compared the lower 6.045amounts of LoVo cells) but do not efficiently release it into the medium (8.122 molecules/μl of RNA, compared the higher 4.963 amounts of LoVo superna-tants). Additional ddPCR results are displayed in Additional file 1: Figure S3 and were confirmed by RT-qPCR (Additional file1: Figure S4), although this lat-ter technique systematically overestimated miRNA con-centrations. To exclude that bovine miRNAs (that are contained in FBS and are highly homologous to human miRNAs) might contribute significant noise to PCR as-says aimed at tumor miRNAs, we reverse transcribed from complete culture medium and from medium con-ditioned by cells grown in culture to 70% confluency. As shown in Additional file1: Figure S5, the contribution of bovine miRNA was negligible. Altogether, these results rule out trivial technical artifacts and demonstrate a specific gateway preventing miR-141 release into HT-29 supernatants. When the results shown in Fig.3are taken together with those shown in Fig.2, it can be concluded that, similar to ctDNAs, miR-141 was released into HT-29 cell supernatants 10 and 6.5 times less abundantly with respect to LoVo and LS147T cells,
Fig. 2 dPCR analysis of KRAS status in cell lines, culture supernatants, tumor tissue xenotransplants and mouse plasma. Input DNAs (from FFPE specimens, culture supernatants and ctDNAs) were subjected to chip-based dPCR using a duplex TaqMan assay that discriminates between WT (red) and mutated KRAS (blue) amplimers at codons 12 and 13, as indicated. Double-positives (microwells containing both WT and mutated KRAS) are shown in green. Microwells in which no PCR amplification takes place are represented by yellow dots (lower left). Variant Allele frequency was calculated by dividing the number of mutated DNA by the total number (mutant +WT) of amplified alleles. Copies per mL are noted and color-coded in supernatants and plasma samples. A whole chip view is depicted in the insets as a quality control
respectively; on the contrary, release of miR-141 in blood of HT-29 xenografted mice was found similar to that observed in the blood of LoVo and LS147T xeno-grafted mice.
miRNAs in tumor tissues and plasma from xenografted mice
Next, we analyzed tumor xenotransplants and their corre-sponding plasma specimens using the same approach (Fig. 4). A representative example of miR-222 content is shown in Fig.4aand all the quantitative data for miR-141, miR-221 and miR-222 are given in Fig.4b. This resulted in a graphical outline very similar to that of Fig.3. Com-parison of the two figures (representative 2D ddPCR plots and the complete dataset from all xenotransplants in the top and bottom panels, respectively) demonstrates at glance that miR-141, poorly released in the culture supernatant (Fig. 3), is instead clearly detectable in plasma (Fig. 4) as the other microRNA analyzed, i.e. miR-221 and miR-222. Also in this case, miRNA
levels were independently assessed by RT-qPCR, that confirmed ddPCR results (Additional file 1: Figures S6 and S7). Finally, we investigated whether cross-species miRNA homology might influence our in vivo results. To this end, we quantitated baseline, endogenous miR-221, miR-222 and miR-141 levels in tumor-free, healthy nude mice. Both RT-ddPCR and RT-qPCR demonstrated that circulating miRNAs were detectable even in the absence of tumor growth (Fig. 5). Thus, whereas bovine miRNAs do not con-tribute significant background in vitro (see above), mouse miRNAs do, and this affects the interpret-ation of the in vivo results. The differences between tumor-bearing and tumor-free mice were clearly ap-preciable for all the three miRNAs analyzed on HT-29 xenografts. In particular, it should be under-lined that, miR-141 was significantly more abundant in the plasma of mice bearing HT-29 tumor xeno-grafts as compared to their tumor-free littermates. This result is compatible with the hypothesis
Fig. 3 miRNA expression in cultured cells and supernatants. (a) 2D ddPCR plots of miR-222-3p in the three indicated cell lines (upper) and their culture supernatants (lower). All cDNAs from cells were diluted 1:100 for accurate Poisson distribution analysis. (b) miR-141-3p, miR-221-3p and miR-222-3p were quantitated in cells (dots) and supernatants (diamonds). All data are normalized for total mRNA content, and expressed as copy/ μl of miRNA in the original samples. Standard deviation was calculated from three independent experiments
suggesting that tumor masses induce systemic miR-141 accumulation in spite of the intrinsic poor ability of HT-29 cells grown in vitro to release this miRNA in the culture supernatant.
Discussion
Both circulating tumor DNAs and miRNAs are being in-creasingly applied as early diagnostic, prognostic and companion biomarkers of target therapy, particularly in a liquid biopsy setting [4]. Liquid biopsy is a powerful tool applicable to all or most human cancers, including colorectal, lung, melanoma, and breast neoplasms, to cite a few, but a detailed knowledge of the molecular mechanisms underlying the release of circulating ana-lytes is still lacking.
Experimental modeling by tumor xenografts has been proposed to characterize the rules of ctDNA [13–16] and miRNA [17–20] release into the bloodstream. In all these studies, ctDNAs and miRNAs were shown to be
released into the bloodstream following upstream, ‘de-fault’ or ‘housekeeping’ cellular events. ctDNAs accumu-lated as a result of apoptotic and non-apoptotic pathways involving DNA fragmentation and DNA pack-aging with shuttle proteins. miRNAs accumulated as a result of their conventional biogenesis in subcellular ves-icles. The above studies demonstrated that analytes re-lease can be successfully modeled in the mouse.
In this report, we wondered whether a substantial analyte fraction might be lost before ctDNAs and miR-NAs hit the bloodstream, or in the bloodstream itself, e.g. whether analyte release is finely tuned downstream of default biogenesis. Interestingly, we found that non-housekeeping, cell line-specific ‘gateways’ operate on specific analytes, and may have opposite influences on a given analyte in vitro and in vivo. For instance, we found that DNAs, regardless as to whether they are from the same (KRAS mutations at codons 12/13) or different (PIK3CA and FBXW7 mutations) genomic regions, are
Fig. 4 RT-ddPCR analysis of miRNA expression in tumor xenografts and plasma. Tumor tissue and blood plasma were obtained from three mice, and miRNAs were quantitated by RT-ddPCR. (a) 2D ddPCR plot of miR-222-3p in tumor tissues (upper) and plasma (lower). 2D ddPCR plots were from 1:100 diluted samples for optimal Poisson distribution. (b) ddPCR analysis of miR-141-3p, miR-221-3p and miR-222-3p from tumor tissue (dots) and plasma (diamonds). All data are expressed as copy/μL of miRNA from the original sample. Standard deviation was calculated from three independent experiments
all more efficiently released from LoVo than LS174T cells, whereas the reverse occurs when these tumor cells are grown as xenotransplants, e.g. LS174T ctDNAs are much more abundant in blood. Cell line-specific prefer-ences are estimated, depending on the specific DNA, to range from 175 to 500-fold, and do not appear to de-pend on‘housekeeping’ factors such as cell proliferation, growth of tumor xenografts, necrosis, or microvascula-ture density. This implies a minimum of two separate, finely tuned, gateways/checkpoint: (a) the first gateway blocks ctDNA release from cells and is particularly effi-cient in LS174T; (b) the second gateway is distinct, pre-vents steady-state accumulation in blood, presumably operates in both xenotransplants, but it is more evident in LoVo. These gateways act at the cell and whole-body levels, respectively, but their precise nature will require further investigation.
Essentially the same concept applies to miRNAs. As to the least abundant (in our set) miR-141, it was released by all tested cell lines much less efficiently than miR-221 or miR-222, and this was particularly evident in HT-29 cells (see the quantitative values of Fig.3 and Fig.4). By contrast, miR-141 was clearly detectable in the blood-stream of HT-29 xenotransplanted mice. At first sight, one might interpret these results as a gateway removal in vivo. However, murine miR-141 (identical to its hu-man orthologue) is abundant in tumor-free mice. Thus, from the present data it is impossible to determine whether the cellular release gateway opens up in vivo (e.g. HT-29 cells start releasing miR-141 when grown as tumor xenografts) or miR-141 accumulates as a result of a xenograft-mediated systemic effect (e.g. ctmiR-141 is contributed by normal mouse cells as a result of tumor implantation). Thus, whereas RAS mutations can be
Fig. 5 Comparative analysis of miRNA expression in plasma samples of xenotransplanted mice and tumor-free littermates. Plasma samples were analyzed by RT-ddPCR (a and b) and RT-qPCR (c). Panel a displays representative 2D ddPCR plots from tumor-free (top) and tumor xenotransplanted (bottom) mice. Panels b and c show miRNA ratios between xenotransplanted and tumor-free mice for the three miRNAs, as estimated by ddPCR and RT-qPCR, respectively
specifically detected in tumor-bearing mice with no interference of endogenous WT RAS murine sequences (Fig. 2), circulating endogenous murine miRNAs indis-tinguishable from their human counterparts are present in tumor-free mice and may be a confounding factor when interpreting results.
Regardless, our data demonstrate that gateways on the one hand, and/or host systemic effects induced by the tumor on the other, influence the presence of ctDNAs and miRNAs and can be identified. Thus, careful modeling in mice may considerably help (with caveats) in selecting optimal biomarkers for clinical use as well as validate anti-miRNA therapeutic approaches [21–23].
From a more general viewpoint, tumor-xenotrans-planted mice and other in vivo models may have an important role because they resolve biological vari-ables from technical varivari-ables (such as handling and storage of biological fluids, pre-analytical processing, as well as DNA and RNA isolation protocols) that might affect efficient marker detection by liquid bi-opsy [24–28]. Finally, tumor-bearing mice may be useful to compare different analytical strategies in-cluding, among others, different PCR/RT-PCR and NGS platforms, instruments and protocols, as well as PCR-free methods [29].
Conclusions
Although the number of ctDNAs and miRNAs taken into account in the present study is limited, our data clearly show in a strictly controlled setting that differ-ent cell lines give rise to very differdiffer-ent liquid biopsy ctDNA and miRNA profiles. Assimilating each of the three tested cell lines/xenografts to a distinct tumor growing in a different patient, it is tempting to specu-late that multiple, finely tuned (non-housekeeping) control gateways exist that selectively regulate the re-lease/accumulation of distinct ctDNA and miRNA species. Tumors from different patients may then considerably differ in gateway usage, adding several layers of complexity to the well-known idea of mo-lecular heterogeneity. For instance, a mutated DNA or miRNA highly represented in the tumor may not be proportionately represented in the blood of a given patient. Analyte under-representation will make it more difficult than expected to interrogate the clinical variety of colorectal tumors. On this basis, it is pre-dicted that very large panels of index aberration are necessary, and that future, careful modeling in mice may considerably help to identify the analytes most affected by individual gateways. Enlarged sets of cell line xenografts and, preferably, patient-derived xeno-grafts are necessary to this end.
Additional file
Additional file 1:Supplementary analysis. (DOCX 4152 kb)
Abbreviations
CEA:Carcinoembryonic antigen; CRC: Colorectal carcinoma; ctDNA: Circulating tumor DNA; ctmiRNA: Circulating tumor microRNA; dPCR: Digital PCR; EGFR: Epidermal growth factor receptor; FFPE: Formalin fixed and paraffin embedded; PCR: Polymerase chain reaction; RT-ddPCR: Reverse transcription- droplet digital PCR; RT-qPCR: Reverse transcription quantitative PCR; VAF: Variant Allelic Frequency Acknowledgments
The authors are grateful to Drs. Rocco Fraioli and Adele Petricca for excellent technical and secretarial help, respectively.
Funding
This work was supported by the European Union (EU) Horizon 2020 Research and Innovation Programme (GA #633937, project ULTRAsensitive PLAsmonic devices for early CAncer Diagnosis (ULTRAPLACAD), and by Associazione Italiana per la Ricerca sul Cancro (AIRC) (IG #13575 to RG, IG# 14204 and IG #19052 to PG). MA is the recipient of a three-year AIRC fellowship (id. 19503). Availability of data and materials
All data generated or analysed during this study are included in this published article (and its supplementary information files).
Authors’ contributions
JG and MA performed all the experiments and wrote the paper. ET and KM were in charge of animal studies. EM validated cell lines and FFPE-processed specimens. EF, PR and MB contributed to RT-ddPCR experiments. CAA performed immunohistochemistry. PG and RG designed the study, supervised the experiments and edited the paper. AF coordinated the study and the experiments and wrote the paper. All authors read and approved the final manuscript.
Ethics approval and consent to participate
Animal studies were performed according to Directive 2010/63/EU and Italian Decree Law 26/2014, and approved by the EU Research Executive Agency (REA), the Intramural Regina Elena Board for Animal Welfare, and the Italian Ministry of Health (prot n. 700–2015-PR, dated July 17th, 2015). Consent for publication
Not applicable. Competing interests
The authors declare that they have no competing interests.
Publisher’s Note
Springer Nature remains neutral with regard to jurisdictional claims in published maps and institutional affiliations.
Author details
1Department of Life Sciences and Biotechnology, Biochemistry and Molecular
Biology Section, Ferrara University, Via Fossato di Mortara 74, 44121 Ferrara, Italy.2Oncogenomics and Epigenetics, IRCSS Regina Elena National Cancer Institute, Via E. Chianesi 53, 00144 Rome, Italy.3Pathology, IRCSS Regina
Elena National Cancer Institute, Rome, Italy.
Received: 8 November 2017 Accepted: 5 June 2018
References
1. Zhong W, Yu Z, Zhan J, Yu T, Lin Y, Xia ZS, et al. Association of serum levels of CEA, CA199, CA125, CYFRA21-1 and CA72-4 and disease characteristics in colorectal cancer. Pathol Oncol Res. 2015;21(1):83–95.
2. Grunnet M, Sorensen JB. Carcinoembryonic antigen (CEA) as tumor marker in lung cancer. Lung Cancer. 2012;76(2):138–43.https://doi.org/10.1007/ s12253-014-9791-9.
3. Shao Y, Sun X, He Y, Liu C, Liu H. Elevated levels of serum tumor markers CEA and CA15-3 are prognostic parameters for different molecular subtypes of breast Cancer. PLoS One. 2015;10(7):e0133830.https://doi.org/10.1371/ journal.pone.0133830.
4. Siravegna G, Marsoni S, Siena S, Bardelli A. Integrating liquid biopsies into the management of cancer. Nat Rev Clin Oncol. 2017;14(9):531–48.https:// doi.org/10.1038/nrclinonc.2017.14.
5. Page K, Guttery DS, Zahra N, Primrose L, Elshaw SR, Pringle JH, et al. Influence of plasma processing on recovery and analysis of circulating nucleic acids. PLoS One. 2013;8(10):e77963.https://doi.org/10.1371/journal. pone.0077963.
6. Spindler KL, Appelt AL, Pallisgaard N, Andersen RF, Brandslund I, Jakobsen A. Cell-free DNA in healthy individuals, noncancerous disease and strong prognostic value in colorectal cancer. Int J Cancer. 2014;135(12):2984–91.
https://doi.org/10.1002/ijc.28946.
7. Rachiglio AM, Esposito Abate R, Sacco A, Pasquale R, Fenizia F, Lambiase M, et al. Limits and potential of targeted sequencing analysis of liquid biopsy in patients with lung and colon carcinoma. Oncotarget. 2016;7(41):66595–605.https://doi. org/10.18632/oncotarget.10704.
8. Giacomini P, Giorda E, Pera C, Ferrara GB. An ID card for tumour cell lines: HLA typing can help. Lancet Oncol. 2001;2:658–8.https://doi.org/10.1016/ S1470-2045(01)00554-X.
9. Turchinovich A, Weiz L, Langheinz A, Burwinkel B. Characterization of extracellular circulating microRNA. Nucleic Acids Res. 2011;39(16):7223–33.
https://doi.org/10.1093/nar/gkr254.
10. Misale S, Yaeger R, Hobor S, Scala E, Janakiraman M, Liska D, et al. Emergence of KRAS mutations and acquired resistance to anti-EGFR therapy in colorectal cancer. Nature. 2012;486(7404):532–6.https://doi.org/10.1038/ nature11156.
11. Cai K, Shen F, Cui JH, Yu Y, Pan HQ. Expression of miR-221 in colon cancer correlates with prognosis. Int J Clin Exp Med. 2015;8(2):2794–8.
12. Qin J, Luo M. MicroRNA-221 promotes colorectal cancer cell invasion and metastasis by targeting RECK. FEBS Lett. 2014;588(1):99–104.https://doi.org/ 10.1016/j.febslet.2013.11.014.
13. Olmo DC, Gutierrez-Gonzalez L, Ruiz-Piqueras R, Picazo MG, Garcia-Olmo D. Detection of circulating tumor cells and of tumor DNA in plasma during tumor progression in rats. Cancer Lett. 2005;217(1):115–23.https:// doi.org/10.1016/j.canlet.2004.06.043.
14. Rago C, Huso DL, Diehl F, Karim B, Liu G, Papadopoulos N, et al. Serial assessment of human tumor burdens in mice by the analysis of circulating DNA. Cancer Res. 2007;67(19):9364–70.https://doi.org/10.1158/0008-5472. CAN-07-0605.
15. Thierry AR, Mouliere F, Gongora C, Ollier J, Robert B, Ychou M, et al. Origin and quantification of circulating DNA in mice with human colorectal cancer xenografts. Nucleic Acids Res. 2010;38(18):6159–75.https://doi.org/10.1093/ nar/gkq421.
16. Bronkhorst AJ, Wentzel JF, Aucamp J, van Dyk E, du Plessis L, Pretorius PJ. Characterization of the cell-free DNA released by cultured cancer cells. Biochim Biophys Acta. 2016;1863(1):157–65.https://doi.org/10.1016/j. bbamcr.2015.10.022.
17. Mitchell PS, Parkin RK, Kroh EM, Fritz BR, Wyman SK, Pogosova-Agadjanyan EL, et al. Circulating microRNAs as stable blood-based markers for cancer detection. Proc Natl Acad Sci U S A. 2008;105(30):10513–8.https://doi.org/ 10.1073/pnas.0804549105.
18. Selth LA, Townley S, Gillis JL, Ochnik AM, Murti K, Macfarlane RJ, et al. Discovery of circulating microRNAs associated with human prostate cancer using a mouse model of disease. Int J Cancer. 2012;131(3):652–61.https:// doi.org/10.1002/ijc.26405.
19. Waters PS, McDermott AM, Wall D, Heneghan HM, Miller N, Newell J, et al. Relationship between circulating and tissue microRNAs in a murine model of breast cancer. PLoS One. 2012;7(11):e50459.https://doi.org/10.1371/ journal.pone.0050459.
20. Greystoke A, Ayub M, Rothwell DG, Morris D, Burt D, Hodgkinson CL, et al. Development of a circulating miRNA assay to monitor tumor burden: from mouse to man. Mol Oncol. 2016;10(2):282–91.https://doi.org/10.1016/j. molonc.2015.10.004.
21. Broderick JA, Zamore PD. MicroRNA therapeutics. Gene Ther. 2011;18(12): 1104–10.https://doi.org/10.1038/gt.2011.50.
22. Brognara E, Fabbri E, Bazzoli E, Montagner G, Ghimenton C, Eccher A, et al. Uptake by human glioma cell lines and biological effects of a peptide-nucleic acids targeting miR-221. J Neuro-Oncol. 2014;118(1):19–28.https:// doi.org/10.1007/s11060-014-1405-6.
23. Christopher AF, Kaur RP, Kaur G, Kaur A, Gupta V, Bansal P. MicroRNA therapeutics: discovering novel targets and developing specific therapy. Perspect Clin Res. 2016;7(2):68–74.https://doi.org/10.4103/2229-3485.179431. 24. Bronkhorst AJ, Aucamp J, Pretorius PJ. Adjustments to the preanalytical
phase of quantitative cell-free DNA analysis. Data Brief. 2016;6:326–9.
https://doi.org/10.1016/j.dib.2015.12.009.
25. Sherwood JL, Corcoran C, Brown H, Sharpe AD, Musilova M, Kohlmann A. Optimised pre-analytical methods improve KRAS mutation detection in circulating tumour DNA (ctDNA) from patients with non-small cell lung Cancer (NSCLC). PLoS One. 2016;11(2):e0150197.https://doi.org/10.1371/ journal.pone.0150197.
26. Pallisgaard N, Spindler KL, Andersen RF, Brandslund I, Jakobsen A. Controls to validate plasma samples for cell free DNA quantification. Clin Chim Acta. 2015;446:141–6.https://doi.org/10.1016/j.cca.2015.04.015.
27. Brunet-Vega A, Pericay C, Quilez ME, Ramirez-Lazaro MJ, Calvet X, Lario S. Variability in microRNA recovery from plasma: comparison of five commercial kits. Anal Biochem. 2015;488:28–35.https://doi.org/10.1016/j.ab. 2015.07.018.
28. Ma M, Zhu H, Zhang C, Sun X, Gao X, Chen G. "Liquid biopsy"-ctDNA detection with great potential and challenges. Ann Transl Med. 2015;3(16):235.https:// doi.org/10.3978/j.issn.2305-5839.2015.09.29.
29. Giuffrida MC, Zanoli LM, D'Agata R, Finotti A, Gambari R, Spoto G. Isothermal circular-strand-displacement polymerization of DNA and microRNA in digital microfluidic devices. Anal Bioanal Chem. 2015;407(6): 1533–43.https://doi.org/10.1007/s00216-014-8405-4.