doi:10.1093/cje/bes068
Advance Access publication 29 January 2013
© The Author 2013. Published by Oxford University Press on behalf of the Cambridge Political Economy Society. All rights reserved.
Law, finance and innovation: the dark side
of shareholder protection
Filippo Belloc*
Proponents of minority shareholder protection state that national legal institu-tions protecting small investors boost stock markets and, in turn, the long-term performance of countries. In this paper we empirically challenge this argument. We perform three-stage least squares estimation on a sample of 48 countries dur-ing 1993–2006 and find that countries with stronger shareholder protection tend to have larger market capitalisation but also lower innovative activity. We cope with stock market endogeneity and industry heterogeneity, and circumvent omitted vari-ables bias, so that this finding is unlikely to be driven by misspecification problems. The estimation results are interpreted, arguing that stronger shareholder protec-tion may depress rather than encourage the most valuable corporate producprotec-tions, because it enables small and diversified shareholders to play opportunistic actions against undiversified stockholders, after specific investments are undertaken by the company; innovative activity, largely based on specific investing, is particularly exposed to this problem.
Key words: Shareholder protection, Innovation, Specific investments, Intershareholder opportunism
JEL classifications: D23, K22, O31, P12
1. Introduction
From the early work by Berle and Means (1932), throughout the twentieth century, corporate scholars have been concerned with agency problems. An agency relationship is a contract under which a person (the principal) engages another person (the agent) to perform some service on his behalf, delegating some decision-making authority to
Manuscript received 11 February 2011; final version received 6 July 2012.
Address for correspondence: Department of Economic Studies, University of Chieti-Pescara, Viale Pindaro 42, 65127 Pescara, Italy; email: [email protected]
* University of Chieti-Pescara. This paper was partially written during my visit to the School of Law of the University of California at Los Angeles, whose hospitality I acknowledge with gratefulness. In particular, I am indebted to Lynn Stout for her generous suggestions. I am grateful for helpful comments and criticisms at various stages of the development of this paper to Guy Barokas, Marianna Belloc, Simona Benedettini, Carlo Cambini, Lucia Dalla Pellegrina, Martin Gelter, Giuseppina Gianfreda, Amir Licht, Francesco Mezzanotte, Enrico Moretti, Antonio Nicita, Lea Petrella, Tiziano Razzolini, Simone Sepe and participants of the XXVII Conference of the European Association of Law and Economics, the 2009 Meeting of the Canadian Law and Economics Association, the 2010 Conference of the International Society for New-Institutional Economics and the Fifth Annual Conference of the Italian Society of Law and Economics. I also thank two anonymous referees for their valuable suggestions. All errors remain my own.
at School of Oriental and African Studies on July 8, 2013
http://cje.oxfordjournals.org/
the agent (Arrow, 1985). If both parties to the relationship are utility maximisers, the agent is unlikely to act in the interests of the principal. As a consequence, the princi-pal’s welfare ends up reduced by an agency cost. The traditional theories of corporate governance maintain that the relationship between the shareholders and the managers of a modern corporation is a pure agency relationship (see, e.g., Alchian and Demsetz, 1972; Jensen and Meckling, 1976). In particular, where large stockholders dominate shareholders’ meetings, small shareholders are exposed to the risk of expropriation, if managers are the expression of the will of the blockholders. From this point of view, national legal institutions constraining the discretion of majority shareholders and providing small or individual shareholders with effective legal means of control— commonly referred to as ‘investor protection’—should both increase corporations’ access to external capital and help corporations and countries enhance their long-term economic performance. This is the main argument of the so-called ‘law and finance’ literature (La Porta et al., 1998; Rajan and Zingales, 1998; Pagano and Volpin, 2005). Although valuable analyses cast serious doubt on the validity of the ‘law and finance’ thesis (see, e.g., Sarkar and Singh, 2010), such a view seems to be largely acknowl-edged by legal policy makers, as shareholder protection is top of the agenda in the USA and many European countries (see, e.g., European Union, 2007).
At the same time, the issue of how institutions of corporate governance affect inno-vation has become increasingly important (O’Sullivan, 2000; Belloc, 2012). On the one hand, the corporate governance system influences the investment decision makers and shapes what type of investments they make, which in turn affects the innovative process. On the other hand, innovation is a strategic instrument for the firms and a source of comparative advantage and of opportunities for future growth; thus, at the macro level, it is central to the dynamic through which market economies improve their performance relative to each other.
In this paper it is argued that while minority investor protection may positively affect stock markets, as a large part of the ‘law and finance’ literature states, national institu-tions of shareholder protection may also deter the most valuable corporate production strategies and depress the innovative performance of countries.
In knowledge-intensive economies a large part of corporate production is based on specific investments, which lose much of their value-creating potential when switched from a certain use or a certain setting to another. In a context of specific investing, when the production project fails, investors can only partially recoup the value of their investment. As a result, if one of the project participants can credibly threaten the oth-ers to dismiss the undertaking in order to extract an additional gain from the relation at their expenses, the remaining investors, anticipating the risk of ex post expropriation, may refrain from investing in the first place (Williamson, 1979). While the risk of oppor-tunistic behaviour between firm participants has been largely studied with respect to shareholder–manager and shareholder–worker relations in a traditional hold-up frame-work (see Gelter, 2009, for a comprehensive picture), proponents of shareholder pro-tection commonly claim that it does not involve intershareholder relationships for one main reason: it is assumed that minority shareholders are motivated by a common and benign interest in improving corporate performance, which reduces the risk of oppor-tunistic actions. Yet, the presumption that shareholders share a single economic goal is nowadays inaccurate: individual shareholders often have conflicts of interest with other shareholders arising from other relationships with the firm, from their investments in derivatives or securities of other corporations and from their investments in other parts
at School of Oriental and African Studies on July 8, 2013
http://cje.oxfordjournals.org/
of the corporation’s capital structure (Anabtawi and Stout, 2008). Thus, some share-holders may have protective outside options with respect to certain corporate projects, while others do not. Therefore, as one gives to individual shareholders (or shareholder groups) the power to easily oppose the other stockholders and so to influence the out-come of a particular corporate decision, one gives them also the capabilities to place strategic vetoes. The consequence may be intershareholder opportunism and ex post rent extraction at the expense of those who are the most sensitive to the corporate results. If the undiversified controlling shareholders anticipate this risk, they will refrain, in a defensive strategy, from allocating corporate capital to specific (and irreversible) invest-ments. In our opinion, knowledge-intensive productions, aimed at generating innova-tion, are especially exposed to this problem given the high specificity of the investments they require (Dosi et al., 1988), so that a stronger shareholder protection may depress rather than encourage the most valuable corporate productions. Such a phenomenon may be relevant also at the country level, given increased shareholder activism by highly diversified institutional investors, who currently control more than 50% of outstanding shares traded on all major exchanges (Edwards and Hubbard, 2000).
Does the empirical evidence support this concern? This paper is aimed at answering this question. In particular, we analyse data on innovation and shareholder protection during 1993–2006 from a sample of 48 countries, and find that countries with stronger investor protection (i.e. legal doctrines provide small stockholders with a stronger abil-ity to oppose majorabil-ity shareholders in the corporate decision-making process) show lower innovative activity, as our theoretical intuition predicts.
Sceptics may raise two arguments against attributing causality.
First, innovation and shareholder protection may be linked through other variables, such as the access of corporations in the economy to external capital. Since share-holder protection (in certain models of corporate finance) affects the size of countries’ stock markets and financial development influences innovative activity, it may not be surprising that shareholder protection and innovation are correlated.
Second, if a measure of market capitalisation is included as a covariate in a sin-gle-equation model (the dependent variable being innovation) in order to control for financial development, then it may be argued that the market capitalisation is cor-related with innovation because of reverse causality. Indeed, the stock market may be partially driven by corporations’ innovative activity, to the extent that shareholders do not wait until the innovation has commercial success and goes public to take advantage of the stock market evaluation of the innovation.
In this paper, we cope with these problems by estimating a two-equation system in which the market capitalisation is explicitly modelled as an endogenous variable. Moreover, we undertake cross-sectional regressions along with panel analysis of both total and sector-specific country innovation, and control for those factors (such as economic international openness and patent endowment) that are commonly advo-cated to strongly affect countries’ innovative activity. Besides, we include in the regres-sion analysis an index for worker participation rights and employment protection laws—which may act as a countervailing force to shareholder protection—and show that worker protection institutions positively affect aggregate innovative performance (this confirms previous findings; see, e.g., Acharya et al., 2010). We also check the robustness of the estimation results to different measures of innovation and share-holder protection and to the presence of unobservable time-invariant country factors. In doing so we are confident in interpreting the estimated relations in a causal sense.
at School of Oriental and African Studies on July 8, 2013
http://cje.oxfordjournals.org/
This paper relates closely to the literature on minority shareholder protection that has been developed in both economic and law debate. Proponents of the so-called ‘shareholder democracy’ establish the desirability of the empowerment of individual (or small) stockholders on the argument that if minority shareholder protection sus-tains larger stock markets (La Porta et al., 1998; Pagano and Volpin, 2005) and if more developed financial markets shape corporate performance and economic growth (Rajan and Zingales, 1998), also a positive relationship between minority shareholder protection and long-term economic performance must be true. Specifically, a common assumption in the literature is that controlling shareholders who hold a large fraction of firm’s shares prefer lower return projects in order to be exposed to a lower risk, while small investors have a genuine interest in long-term corporate results (see, e.g., Dhillon and Rossetto, 2009). A contrasting body of research strongly challenges this view, suggesting that minority shareholder protection may encourage opportunistic actions played by small activist shareholders. While Gordon (1991) defines sharehold-ers as ‘multi-principals’, more recently, Anabtawi (2006), Stout (2007) and Anabtawi and Stout (2008) have explored the potential consequences of strategic interaction between shareholders in a context of heterogeneous interests. They maintained that also minority investors are likely to play rent extraction at the expense of large share-holders when they have the ability to affect business decisions in a self-serving way, which in turn may be a restraining factor of specific investing and value-creating pro-ductions. This paper provides empirical evidence consistent with such an argument, showing that stronger national legal institutions of minority shareholder protection may favour intershareholder opportunism problems in knowledge-intensive produc-tions and depress the innovative abilities of countries. We depart from the existing empirical literature on shareholder protection in two ways. First, many empirical stud-ies have investigated the potential profitability-enhancing role of shareholder control (see Short, 1994, for a comprehensive survey), but they focus only on the degree of ownership concentration and disregard the legal control power of individual or small shareholders, which, instead, is central in the presented analysis. Second, data on minority shareholder rights have been extensively used to explain the corporate own-ership structure and equity market capitalisation from a national perspective (for a survey see Denis and McConnell, 2003), but the effect of such rights on long-term country outcomes and innovation has never been explored (a notable exception is the study by Sarkar and Singh, 2010, which explores the relationship between shareholder protection and long-term financial development).
The remainder of the paper is organised as follows. Section 2 discusses the theoreti-cal motivation for the empiritheoreti-cal study and Section 3 describes the variables used in the estimation. In Section 4 the econometric strategy is explained, while the estimation results are presented in Section 5. Section 6 concludes.
2. Theoretical motivation
Behind the alleged need for shareholder empowerment, corporate theories generally conflate two different elements: on the one hand, the need to reduce the capacity of non-shareholders to siphon off benefit for themselves, by increasing sharehold-ers’ influence on managerial decision making within managsharehold-ers’ legitimate business judgement, and, on the other, the need for shareholder protection against discretional activity by controlling shareholders, which calls for increasing minority shareholder
at School of Oriental and African Studies on July 8, 2013
http://cje.oxfordjournals.org/
protection and control rights. While the negative consequences of shareholder influ-ence (namely, the hold-up risk for non-shareholder constituencies, especially workers) have been largely explored by corporate governance research (see, e.g., Gelter, 2009), the dark side of shareholder protection has received little attention, as corporate theo-ries commonly describe minority shareholders as having a common interest in improv-ing corporate performance. Nevertheless, the long-standimprov-ing idea that shareholders have homogeneous interests is no longer accurate (Gordon, 1991; Anabtawi, 2006; Stout, 2007; Anabtawi and Stout, 2008). Specifically, a fault line separating sharehold-ers is the extent to which (and how) their portfolios are divsharehold-ersified. The heterogeneity of financial investors is due, for example, to different degrees of risk aversion and to different capabilities to handle complex portfolios. While undiversified stockholders are those who have their wealth disproportionately invested in a given company (e.g. inside shareholders and founding family shareholders), small diversified shareholders, such as mutual funds and hedge funds, are often characterised by their ownership across a wide spectrum of the stock market and so reduce firm-specific risk or even eliminate it under certain circumstances (Gilson and Black, 1993). As a consequence, on the one hand, undiversified shareholders are highly sensitive to corporate outcomes, while, on the other, (extensively) diversified shareholders can become indifferent to the firm’s individual shocks. For instance, after an investment project is chosen, a given shareholder may enter into a derivatives contract with an investment bank to hedge away his economic interest in the corporation, in a way such that if the project fails the investment bank, and not the hedged shareholder, will bear the loss. It follows that how shareholders make their decisions about production strategies depends on who the shareholder is.
In the presence of different private interests, an increase of small shareholder control rights may give shareholders the ability to affect the decision-making process in a self-serving way, despite the shareholder voting principle of majority rule. Indeed, when one shareholder can easily threaten a proxy contest and remove directors or bring law-suits against other stockholders (irrespective of whether they are justified or not), he can also use direct negotiations with the other shareholders to bargain for his private interests. Thus, non-cooperative bargaining between heterogeneous shareholders may occur as the property rights literature predicts in other contexts (see, e.g., Hart and Moore, 1990).
In knowledge-intensive productions, a non-cooperative intershareholder relation-ship can easily lead to intershareholder opportunism. Innovative processes require spe-cific investments in order to be performed (Dosi et al., 1988) and they lose most of their value when they fall apart before being completed. As a result, when each share-holder, or shareholder group, has a sort of veto power over corporate productions, a given diversified shareholder can also bargain for an undue rent, after the (specific) investment decision is taken, at the expense of those undiversified shareholders who have all their shares in the individual project or corporation. Consider the following example. An extensively diversified shareholder A can credibly threaten an undiversi-fied shareholder B to put the veto on an innovative production (after the investment has already been undertaken) and can propose to take a large share of the final out-come (e.g. by diverting the profits into an entity in which A’s share is higher), leaving, through a lower shares’ value, a final derisory payoff to B. If B anticipates A’s threat, B will choose a suboptimal (non-specific) investment strategy ex ante, which may consist of a short-term non-innovative production with a lower but certain profit. Phrased
at School of Oriental and African Studies on July 8, 2013
http://cje.oxfordjournals.org/
differently, when a given shareholder’s economic interests are not tied up to an indi-vidual corporate project (with a low salvage value) and the shareholder is likely to exer-cise an ex post strategic veto over it, the benefits that the other shareholders should give him as a ‘bribe’ to let the production end may be too high; thus, if the undiversified shareholders anticipate this risk, they will refuse to undertake the specific investment
ex ante, as a defensive strategy.
Many observers direct growing attention to the potential negative effects of inter-shareholder opportunism on value-creating productions as well as to the need for fiduciary duties for small activist shareholders (on this point see Anabtawi and Stout, 2008). For example, Solomon et al. (1998), among others, report several cases of con-flicts of interest between shareholders that gave rise to opportunistic behaviour and, in turn, distorted corporate investment strategies, while Graves (1988), Hill et al. (1988) and Sherman et al. (1998) find a negative effect of hedge and mutual funds stockhold-ing on corporations’ innovation. This concern is also consistent with the troublstockhold-ing scenario that might arise in consequence of the derivatives revolution and other capital markets developments, as some authors predict. In particular, Hu and Black (2006) remark that the so-called ‘empty voting’ strategies can drive business policies to inef-ficient investment decisions: if a shareholder has some control power while simultane-ously entering into a derivatives contract to hedge away his economic interest, he can also credibly threaten the other stockholders in order to obtain a private gain at their expense.
It follows that knowledge-intensive productions are especially exposed to such a problem, because they are largely based on sunk investments. Specifically, intershare-holder opportunism may cause a crash in what Carpenter et al. (2003) call ‘strategic control’, i.e. the set of relations that gives strategic decision makers both the incen-tives and the abilities to allocate firm’s resources to innovative investment strate-gies. Thus, in countries where corporate law ensures strong shareholder protection, innovative productions would be depressed, rather than fostered, if the benefits of a reduction of firm internal agency costs and blockholders’ discretion are outweighed by the costs of intershareholder opportunistic actions and of incentive distortions in corporate investment decisions. Consider, for example, the USA, the UK and Canada, which are high-income, common-law countries with comparable equity markets and financial systems. Consistent with our argument, the USA, in which corporate law is shareholder-unfriendly in the aspects relevant here (see Spamann, 2010), shows a high level of innovative activity (about 90 patents per million inhabitants every year). Differently, the UK and Canada, where minority investors are better protected (see, again, Spamann, 2010), show a lower patent activity of around, respectively, 60 and 30 patents per million inhabitants every year. Furthermore, at least from a descrip-tive point of view, differences in the innovadescrip-tive performance between the USA, the UK and Canada are unlikely to be driven by differences in labour market institutions and productive structures (the USA has a labour market slightly less rigid than that of the UK and Canada, and a slightly lower industry share of GDP). So, shareholder protection seems to affect the innovative performance of countries in the way pre-dicted. Looking at a larger sample of countries, the relationship between institutions of minority shareholder protection and innovation is more difficult to detect, given the (possibly) counterbalancing effects that shareholder protection institutions may play on innovative activity both directly and indirectly through financial markets. This rela-tionship is explored more systematically in the rest of the paper.
at School of Oriental and African Studies on July 8, 2013
http://cje.oxfordjournals.org/
3. Data
In order to perform the empirical analysis, a novel dataset is collected in which infor-mation on legal shareholder protection is linked to the aggregated innovative perfor-mance of corporations using data from various sources over the 1993–2006 period. Specifically, the aim is to study the effect of legal shareholder control on innovative activity at the country level, controlling for market capitalisation and other factors— market capitalisation being considered an endogenous variable. So, as a first step, we define appropriate indicators for both innovative performance and shareholder protec-tion at the country level (Secprotec-tions 3.1 and 3.2). Then, the control variables are chosen (Section 3.3).
3.1 Innovative activity
Dealing with innovation in econometric estimation can be problematic.
A first problem involves the measure of innovation. Generally, two indicators are used to measure innovative activity: an input measure, R&D spending (see, e.g., Lanjouw and Schankerman, 2004), and an output measure, the number of patents (see, e.g., Bound et al., 1984). Both of these indicators have some disadvantages. On the one hand, R&D spending is an imperfect proxy for innovative activity, because not all innovations are generated within formal R&D programmes; on the other, the number of patents does not capture those innovations that are protected by trade secrets. In our estimation, we consider both the aggregated number of patents awarded by the corporations of a given country and the R&D spending of the private sector (as a percentage of GDP) as indexes of innovative performance. In particular, for the number of patents we use data from the European Patent Office (2008) and for R&D spending we consider data from the World Development Indicators database (World Bank, 2008). Note that by using the number of patents granted by the European Patent Office we avoid heterogeneity problems due to possibly different patent legislations across countries.
A second problem concerns the time horizon within which to consider countries’ innovative activity. While R&D spending should be immediately affected by investment decisions, innovation programmes take time to get to a patent, so that to consider the number of patents awarded within one year after an investment decision is limiting. For example, Ho et al. (2006) report that the average duration of innovation projects is between five and 10 years. In the empirical analysis we use data for periods of five and 10 years between 1993 and 2006. Notice that unreported estimation results, obtained using shorter periods, lead to substantially similar conclusions.
Using the number of patents causes a third problem, related to intercountry compari-sons. To weight the number of patents by GDP seems an obvious strategy in order to make country data validly comparable. However, a two-way relation between the num-ber of patents and GDP may generate estimation bias. A country’s total amount of pat-ents is weighted both by its population and its GDP in different model specifications, in order to check the robustness of the estimation results (for GDP and population we use data from the World Development Indicators database (World Bank, 2008)).
3.2 Shareholder protection
La Porta et al. (1998) develop the so-called ‘anti-director rights index’ that is routinely used as a measure of (small or individual) shareholder protection in cross-country
at School of Oriental and African Studies on July 8, 2013
http://cje.oxfordjournals.org/
quantitative studies (see, among others, Pagano and Volpin, 2005, and the revised index by Djankov et al., 2008). This index measures ‘how strongly the legal system favors minority shareholders against managers or dominant shareholders in [the] corporate decision-making process’ (La Porta et al., 1998, p. 1127) and assesses the minority shareholder ability to elect and remove directors. The shareholder protection index, originally compiled by La Porta et al. (1998) for 1996, has been extended by Pagano and Volpin (2005) to the entire interval between 1993 and 2002. This is the variable that is used as an indicator of legal shareholder protection. The shareholder anti-director rights index that we consider is formed by adding 1 when the country allows shareholders to mail their proxy vote to the firm, shareholders are not required to deposit their shares prior to the general shareholders’ meeting, cumulative voting or proportional representation of minorities in the board of directors is allowed, an oppressed minorities mechanism is in place, the minimum percentage of share capital that entitles a shareholder to call for an extraordinary shareholders’ meeting is less than or equal to the sample median (10%) or shareholders have pre-emptive rights that can be waived only by a shareholders’ vote. The final index ranges from zero to six. More detailed data on shareholder protection are collected by Fagernas et al. (2008); unfortunately, they cover only five countries, which is a too small sample for the pur-poses of our analysis. We do perform, however, a robustness check in which we use the revised index of Spamann (2010), which employs the same variable definition of Pagano and Volpin (2005) but proposes a different coding, and the indicator by Siems et al. (2009), which covers some shareholder rights not included in the index of La Porta et al. (1998), as will be further discussed in the next section.
3.3 Control variables
As a first control we use the logarithm of countries’ market capitalisation. Market capi-talisation is the share price times the number of shares outstanding, as a percentage of GDP (the data source is World Bank, 2008). Several studies emphasise that when corporations face internal financing constraints, new equity has some advantages over debt for financing high-tech investments: equity finance does not require the corpora-tion to post collateral, investors’ upside returns are not bounded and addicorpora-tional equity financing does not increase the probability of financial distress. For example, Bradley et al. (1984) and Long and Malitz (1985) show empirically that there is a negative relationship between a firm’s leverage and its intangible assets, and Carpenter and Petersen (2002) find that countries with relatively well-developed markets for new equity have a comparative advantage in the production of high-tech goods.
As a second control we consider an index of worker participation to allow for firm internal commitments between employees and employer and for specific human capital development (worker participation is defined as employee participation in management decision making and use data collected from the International Labour Organization, 2007, and Kluge and Stollt, 2006; in accordance with its qualitative nature, the variable is coded as ‘high’ in the case of widespread participation rights, ‘medium’ in the case of limited participation rights and ‘low’ when participation rights are absent or very limited). Kraft et al. (2011), for example, show that the employee participation is positively correlated with a firm’s innovative activity. We also substitute the worker participation rights index with an indicator of the degree of employment protection in one model specification, in order to check the robustness of the results to
at School of Oriental and African Studies on July 8, 2013
http://cje.oxfordjournals.org/
measurement errors. In particular, where this substitution is made, we use an overall summary indicator of employment protection provided by OECD (2009), which is calculated as a weighted sum of 12 subindicators relating to regular contracts. As Blair and Roe (1999) point out, the relative competition of economic systems is strongly linked with the legal rules regulating the labour markets. Hall and Soskice (2001), fur-thermore, show that labour market institutions directly influence the innovative per-formance of countries (microeconometric evidence on the relationship between firms’ innovation and labour contracts is provided by Michie and Sheehan, 2003). Acharya et al. (2010), more recently, find that stringent labour laws provide firms a commit-ment device to not expropriate other stakeholders, such as managers and employees, who are prepared to pursue innovative activities. Thus, worker protection laws may act as a countervailing force to shareholder protection.
Third, the country’s industry share is included as a percentage of GDP from the World Development Indicators database (World Bank, 2008). In particular, the indus-try share is divided into three classes in order to minimise problems due to influential outliers (‘low’ if the industry share is lower than 25%, ‘medium’ if it is between 25% and 50%, and ‘high’ if it is greater than 50%).
Fourth, we consider the weighted number of patents awarded by the corporations of a given country in the year preceding the considered period. In this way, the autore-gressive component of patents data is also explicitly modelled in our analysis and estimated. As Pagano and Rossi (2004) and Belloc and Pagano (2012) argue, given technological interdependencies in knowledge-intensive productions, countries with higher endowments of patents tend to acquire further innovative abilities, while other countries may be trapped in equilibria where they do not acquire intellectual assets because they do not have innovative abilities and they do not acquire the abilities because they do not have intellectual assets.
Lastly, as is mentioned above, the market capitalisation must be modelled as an endogenous variable, since a set of shareholder protection rights may be one of the determinants of the breadth of equity markets. In the absence of minority shareholder protection, potential blockholders may expropriate small stockholders so that the lat-ter anticipate lower returns and are unwilling to buy shares in the first place (La Porta et al., 1998; Pagano and Volpin, 2005; Djankov et al., 2008). In particular, in our model, the market capitalisation is expressed as an endogenous variable with respect to the shareholder protection index, the workers’ rights to participate to the corporate decision making (as suggested by Roe, 2003; the definition of this variable is the same of that used as an explanatory variable for innovation),1 the GDP per capita expressed
in purchasing-power parity, the rule of law and the government independence. The rule of law and the government’s independence measure the quality of contract enforce-ment, property rights and courts, and the degree of government’s independence from political pressure, respectively (World Bank, 2009). Again, we employ a further model specification where the worker participation rights index is substituted by OECD’s employment protection index (OECD, 2009).
1 Roe (2003) argues that, in some countries, firms’ founders seek to preserve concentrated ownership
because of strong employee rights, so that the two institutions of worker participation and block ownership may be linked in a power-counterbalancing dynamics.
at School of Oriental and African Studies on July 8, 2013
http://cje.oxfordjournals.org/
4. Econometric strategy
The estimation’s objective is to estimate the effect of an increase of legal shareholder protection on innovative activity (measured either by number of patents or R&D spending), also controlling for a vector of covariates. We start by performing panel estimation. This allows us to tackle possible misspecification problems and omitted variable bias, since it enables us to take advantage of the intertemporal variability of the observed information set.
As mentioned in the previous section, countries’ innovative activity and legal share-holder protection may be linked in a similar pattern through their relation with a com-mon variable (namely market capitalisation), which may cause a spurious relationship. In order to address this problem, the market capitalisation is explicitly modelled. We consider the following cross-country two-equation model:
Inni t∆ = + ⋅α β ShPrit + ⋅γγ Φit(+ci)+εit (1)
MkCapit = + ⋅δ η ShPrit + ⋅θθ ΩΩ (it +ci) υ (2)+ it
where InniΔt measures the innovative activity of country i in a five-year interval Δt,
ShPrit is the shareholder protection index for country i at date t, MkCapit is the
loga-rithm of market capitalisation, Φit and Ωit are two vectors of controls, ci is a time con-stant variable that captures the effect of unobserved country heterogeneity, α, β, γ, δ,
η and θ define the parametric structure (in particular α and δ are the two model
con-stants, and γ and θ are the vectors of the controls’ parameters), while εit and υit are the error terms. The vector Φit contains MkCapit, WorkPartit (worker participation), EmPrit (employment protection), Indit (industry share) and Patit (number of patents previously awarded); the vector Ωit includes Gdpit (GDP per capita), Ruleit (rule of law), Govit (government’s independence), WorkPartit and EmPrit. The variables are described in the previous section, while descriptive statistics are shown in Table 1. Notice that when the number of patents is used as an index of innovative activity, InniΔt is calculated over intervals of five years, while when R&D spending is used as an index of innovation, the dependent variable is Innit, which denotes the R&D spending at date t. The base sam-ple used is the largest possible given the data availability (48 countries).2 Given that
we employ panel data on shareholder protection for the 1993–2002 period, we should be able to exploit 480 observations. However, some year data are missing for Iceland, Ireland, Israel and Uruguay, so that 476 observations are used in some panel model specifications. It follows that the panel of data is ‘unbalanced’, since a different num-ber of observations are used for different countries. Moreover, we can consider only OECD countries when the employment protection index (EmPrit) is used, and data for some years are missing for some OECD countries; as a consequence, the sample size is reduced to 139 observations in those panel model specifications where EmPrit is used.
Notice that in the operative model we meet identification requirements by using two excluded instruments in equation (2), namely an indicator of the rule of law and
2 Argentina, Australia, Austria, Belgium, Brazil, Canada, Chile, Colombia, Denmark, Ecuador, Egypt,
Finland, France, Germany, Greece, Hong Kong, India, Indonesia, Ireland, Israel, Italy, Japan, Jordan, Kenya, Malaysia, Mexico, the Netherlands, New Zealand, Nigeria, Norway, Pakistan, Peru, the Philippines, Portugal, Singapore, South Africa, South Korea, Spain, Sri Lanka, Sweden, Switzerland, Thailand, Turkey, the UK, the USA, Uruguay, Venezuela and Zimbabwe.
at School of Oriental and African Studies on July 8, 2013
http://cje.oxfordjournals.org/
the government’s independence index. As suggested by La Porta et al. (1997), the character of the legal rules and the quality of law enforcement have large effects on the breadth of capital markets across countries, while they do not show a statistically significant correlation with innovation. Thus, there is no more than one structure that can lead to the same reduced form and therefore we can estimate the structure.
As equations (1) and (2) show, we allow innovative activity to react to share-holder protection rights and market capitalisation and, simultaneously, market capitalisation to react to shareholder protection. Consequently, εit is likely to be
correlated with MkCapit. Thus, we jointly estimate the two equations using a
three-stage least squares (3SLS) procedure. The three steps in the 3SLS method are as follows. The first step is identical to the first step of a two-stage procedure (2SLS): Table 1. Descriptive statistics (cross-country data, all industries)
Cross-sectional sample Panel sample
Variable Mean SD Mean SD
Inn (patents, weight: population in millions)a 503.466 839.986 259.461 442.671 Inn (patents, weight: GDP in billions of US $) – – 11.131 16.643 Inn (R&D, % GDP) 1.289 0.995 1.346 1.065 ShPrb 2.979 0.923 3.310 1.224 WorkPart (low = 0, medium = 1, high = 2) 0.469 0.738 0.469 0.732 EmPr – – 2.154 0.871 MkCap 3.627 0.995 3.688 1.056 Pat (weight: population in millions) 35.872 61.335 45.043 79.458 Pat (weight: GDP in billions of US $) – – 1.880 2.907 Ind (low = 0, medium = 1, high = 2) 1.980 0.468 1.947 0.480 Gdp 12408 10934 12480 1100 Gov 0.914 1.094 1.056 1.064 Rule 0.697 0.995 0.702 0.998 SD, standard deviation. Notes:
aInn is calculated over five-year intervals in the panel sample, while over a 10-year interval in the
cross-sectional sample.
bShPr: default rules in panel data, mandatory rules in cross-sectional data.
at School of Oriental and African Studies on July 8, 2013
http://cje.oxfordjournals.org/
the predicted values of each endogenous variable on all the exogenous regres-sors are obtained. In the second step we substitute the predictions of the market capitalisation found in the first step in place of MkCapit on the right-hand side of equation (1) and apply OLS; the residuals are then used to obtain an estimate of the covariance matrix of the error terms of the two equations. In the third step the estimate of the cross-equation correlation matrix is used as a weighting matrix to calculate the generalised least squares estimator. The last two steps are iter-ated over the estimiter-ated disturbance covariance and parameter estimates until the parameter estimates converge.
5. Estimation results
5.1 Basic regressions
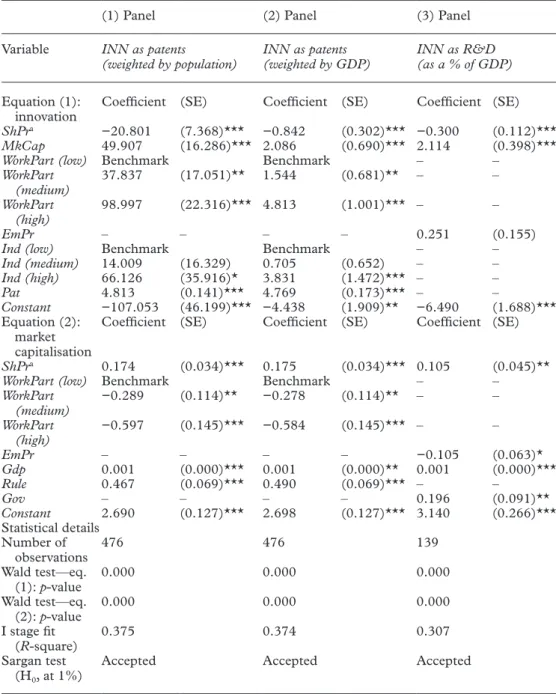
Table 2 reports the estimation results of the basic panel model specifications. The two equation parameters, simultaneously estimated, are reported one after the other. While the left column reports the variables, the remaining columns report the estimated parameters of the various model specifications. Specifically, mod-els (1), (2) and (3) are panel model specifications in which innovative activity is measured by, respectively, the number of patents in a five-year period weighted by the country’s population, the number of patents in a five-year period weighted by the country’s GDP and the R&D spending of a given year as a percentage of the country’s GDP, so as to check the robustness of the results to different measures of innovation. Given that R&D data for some years are missing for some countries, in model (3) a reduced number of controls is included in order to save the number of degrees of freedom.
The parameter estimates are broadly stable across the various model specifica-tions and provide strong support to our theoretical argument of a negative effect of shareholder protection on knowledge-intensive productions. In particular we find that an increase of the shareholder protection index (ShPr) has a negative and statistically significant effect on the innovative activity of countries (Inn), also controlling for a potential spurious relationship through the market capitalisation. This is shown by all of the considered model specifications. Although we cannot observe directly how investment decisions within corporations vary across coun-tries along with different levels of shareholder protection, we interpret this result as a signal for the presence of intershareholder opportunism when heterogene-ous shareholders can easily affect business decisions in those productions that require specific investments, such as innovative activities. Indeed, it is true that an increased shareholder empowerment might reduce corporate innovation also by means of a reduction in the incentives for other stakeholders (primarily workers) to undertake firm-specific investing, especially in countries such as the USA and the UK, where corporations show a more dispersed ownership structure. Nevertheless, in the estimation we use a shareholder protection index that specifically measures minority shareholders’ intervention power, while the risk of hold-up of workers by shareholders as a class is captured by the worker participation and employment protection indicators, which measure the extent to which shareholders can expro-priate managers and employees.
at School of Oriental and African Studies on July 8, 2013
http://cje.oxfordjournals.org/
Table 2. Cross-country estimation results: basic regressions (3SLS, all industries)
(1) Panel (2) Panel (3) Panel
Variable INN as patents
(weighted by population) INN as patents (weighted by GDP) INN as R&D (as a % of GDP) Equation (1):
innovation Coefficient (SE) Coefficient (SE) Coefficient (SE) ShPra −20.801 (7.368)*** −0.842 (0.302)*** −0.300 (0.112)***
MkCap 49.907 (16.286)*** 2.086 (0.690)*** 2.114 (0.398)***
WorkPart (low) Benchmark Benchmark – –
WorkPart
(medium) 37.837 (17.051)** 1.544 (0.681)** – –
WorkPart
(high) 98.997 (22.316)*** 4.813 (1.001)*** – –
EmPr – – – – 0.251 (0.155)
Ind (low) Benchmark Benchmark – –
Ind (medium) 14.009 (16.329) 0.705 (0.652) – – Ind (high) 66.126 (35.916)* 3.831 (1.472)*** – – Pat 4.813 (0.141)*** 4.769 (0.173)*** – – Constant −107.053 (46.199)*** −4.438 (1.909)** −6.490 (1.688)*** Equation (2): market capitalisation
Coefficient (SE) Coefficient (SE) Coefficient (SE)
ShPra 0.174 (0.034)*** 0.175 (0.034)*** 0.105 (0.045)**
WorkPart (low) Benchmark Benchmark – –
WorkPart (medium) −0.289 (0.114)** −0.278 (0.114)** – – WorkPart (high) −0.597 (0.145)*** −0.584 (0.145)*** – – EmPr – – – – −0.105 (0.063)* Gdp 0.001 (0.000)*** 0.001 (0.000)** 0.001 (0.000)*** Rule 0.467 (0.069)*** 0.490 (0.069)*** – – Gov – – – – 0.196 (0.091)** Constant 2.690 (0.127)*** 2.698 (0.127)*** 3.140 (0.266)*** Statistical details Number of observations 476 476 139 Wald test—eq. (1): p-value 0.000 0.000 0.000 Wald test—eq. (2): p-value 0.000 0.000 0.000 I stage fit (R-square) 0.375 0.374 0.307 Sargan test (H0, at 1%)
Accepted Accepted Accepted
SE, standard error. Notes:
aShPr
it: default rules.
* = 10% significance, ** = 5% significance, *** = 1% significance.
at School of Oriental and African Studies on July 8, 2013
http://cje.oxfordjournals.org/
Further interesting results are obtained. First, shareholder protection, as suggested by La Porta et al. (1998), may positively affect the market capitalisation (MkCap);3
the market capitalisation is also negatively affected by the worker participation rights (WorkPart) and the employment protection legislation (EmPr), consistently with the argument of Roe (2003), and is positively linked with the GDP per capita (Gdp), rule of law (Rule) and government’s independence (Gov). Second, worker participation rights have a positive and statistically significant effect on innovative activity (when the latter is measured by the number of patents). This finding may support the idea that worker participation and legal protection motivate employees to apply their skills and effort to collective learning processes, enhancing the corporate knowledge base and innovative activity (Lorenz, 1999; Michie and Sheehan, 1999, 2003; Lucidi and Kleinknecht, 2010; Kraft et al., 2011). In particular, as Acharya et al. (2010) observe, innovation is likely to be fostered by stringent laws governing the dismissal of employees. Hence, given the positive relationship between worker protection and innovation, stringent labour mar-ket institutions can be interpreted as a countervailing force to shareholder protection. However, to the extent that workers may play rent-seeking actions, the positive effect of worker participation on innovative activity is partially compensated by its negative effect on the incentives of financial investors to contribute their money to the corpora-tion, which is shown by the negative sign of the parameters associated with WorkPart and EmPr in equation (2). Third, the number of patents previously awarded by the cor-porations of a given country (Pat) is statistically relevant in explaining the amount of its subsequent innovations, which highlights the cumulative nature of technological inno-vation in knowledge-intensive productions. Fourth, the dummy Ind (high), measuring an industry share of GDP greater than 50%, is positive and statistically significant.
Briefly, besides the effects exerted by the control variables, the main intuition behind the estimation findings is that while shareholder protection induces greater financial investment by potential equity holders, it also stimulates non-cooperative business strategies. The final estimated outcome of these forces is a lower innovative activity of corporations and, ultimately, slower economic development.
Lastly, a diagnostic analysis of the results is performed. First, we checked the rel-evance and exogeneity of the instruments used in the estimation. In order to test the relevance condition, as recommended by Bound et al. (1995), we examined the first stage R-square, which, in our model specifications, is greater than 0.3 (i.e. the com-monly used rule of thumb) (Shea, 1997). In order to test the exogeneity condition, we implemented the Sargan test for overidentifying restrictions. The test results do not lead us to reject the null hypothesis (at the 1% level of statistical significance) of non-correlation of the instrumental variables to some set of residuals; thus the instruments are statistically validated. Second, as an overall diagnostic procedure, we performed the Wald test on all the model specifications; the test results lead us to reject the null hypothesis of the joint non-statistical significance of all the parameters. The statistical details are reported at the bottom of Table 2.4
3 It is noteworthy to observe that the impact of shareholder protection on market capitalisation, here, is
observed on a one-year basis. While a causal relationship between the two variables might actually hold in the short term, notable analyses show that such a relationship tends to lose statistical significance in the long term (e.g. Sarkar and Singh, 2010).
4 Notice that the OLS estimation results of equation (1) and 2SLS estimation results of equations (1)
and (2)—using the same set of covariates in the first and second stages, as suggested by Angrist and Pischke (2009)—also show a negative partial effect of shareholder protection on country-level innovative activity. These estimation results are not reported but are provided by the author upon request.
at School of Oriental and African Studies on July 8, 2013
http://cje.oxfordjournals.org/
5.2 Robustness checks
Even if the results presented in Section 5.1 are shown to be robust to different meas-ures of innovation, three further arguments may be offered against attributing eco-nomic meaning to our findings.
First, it may be argued that the indicator of minority shareholder protection by Pagano and Volpin (2005) is inaccurate (see, e.g., Enriques, 2002). As Spamann (2010) points out, the most basic issue for the coding of legal variables, such as the shareholder rights index, is whether only mandatory rules, default rules or optional rules should be counted. While Djankov et al. (2008) explicitly coded for default rules, La Porta et al. (1998) and Pagano and Volpin (2005) did not take an explicit position, although they seem to have been primarily concerned with default rules. To use default or optional rules in our analysis may not allow us to validly compare shareholder protection across countries. Indeed, the default and optional rules’ substantive content does not matter very much in the presence of low transaction costs (this is nothing more than a relatively straightforward application of the Coase theorem; Coase, 1960), which in turn vary substantially across countries depending on the efficiency of the legal systems.
Second, one may object that the informal character of shareholder activism entails that shareholders can operate outside the limits of shareholder power defined by national regulation (Brav et al., 2008). In some countries, such as the USA, small investors can easily circumvent the existing legal devices regulating shareholder voice and engage private negotiations with boards, in turn affecting corporations’ invest-ments and performance. As a result, an index measuring national legal rules of minor-ity shareholder protection may not capture all the ways through which small investors can influence corporate production strategies and innovation.
Third, relevant shareholder protection rights may cover aspects not included in the traditional definition of minority shareholder protection provided by La Porta et al. (1998). Small shareholder rights concerning the disclosure of major share ownership, the power to set items in the agenda of the general meeting and the power to influence
de facto changes (such as the sale of the company’s assets) are not included in the index
conceived by La Porta et al. (1998). What the law prescribes about the presence of independent board members is another aspect relevant to minority shareholder pro-tection, which, however, La Porta et al. (1998) do not consider.
In order to check the robustness of the estimation results to the first point, we per-form two cross-sectional model specifications counting only mandatory rules in the shareholder protection indicator. In this case we use the revised index by Spamann (2010), which uses the original variable definition from La Porta et al. (1998) and allows us to distinguish mandatory rules from default and optional rules. The revised index by Spamann (2010) refers to 1996 only. In the first cross-sectional model speci-fication, innovative activity is measured by the number of patents over a 10-year inter-val and exploit a sample of 46 observations; in the second model, R&D spending is used as an indicator of innovative activity and are forced to consider only 33 observa-tions because of some missing data. A further control variable is included in these two model specifications, namely a measure of the countries’ trade openness (Openness), calculated as the sum of merchandise exports and imports divided by the value of GDP (World Bank, 2008).
With respect to the second point, we undertake a panel model specification in which 48 country dummies are included. In so doing, we explicitly estimate the country fixed
at School of Oriental and African Studies on July 8, 2013
http://cje.oxfordjournals.org/
effects capturing the influence of those unobservable factors that affect shareholder activism and, through this, corporations’ innovation at an aggregated level as well as the role played by potential country-level time-invariant omitted variables.5
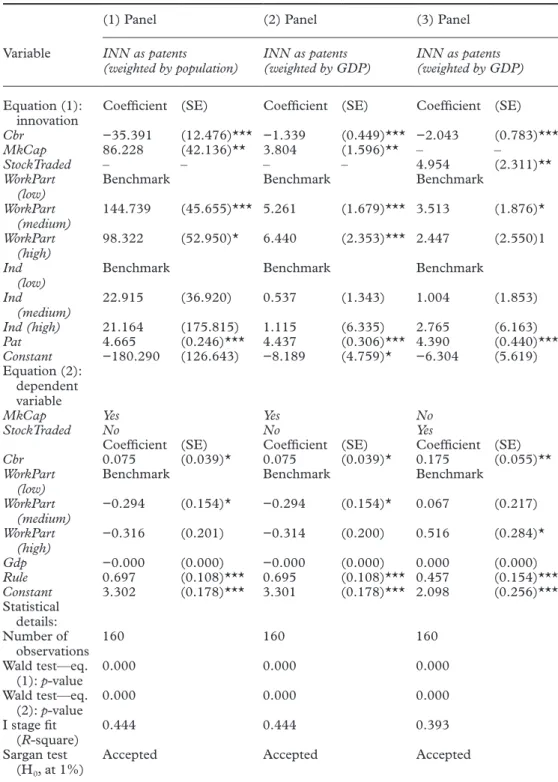
With respect to the third point, we run three additional panel model specifications in which the shareholder protection index as defined by La Porta et al. (1998) is substi-tuted by the indicator provided by Siems et al. (2009); these cover 25 countries over the 1995–2005 period. The indicator by Siems et al. (2009) is composed of 10 core vari-ables that cover the following issues: powers of the general meeting for de facto changes, agenda-setting power, postal voting, multiple voting rights, appointment of independ-ent board members, feasibility of directors’ dismissal, private enforcemindepend-ent of directors’ duties, shareholder rights against resolutions of the general meeting, mandatory bid law and disclosure of major share ownership. Each component of Siems et al.’s (2009) index can assume values ranging from 0 to 1. The final indicator (Cbr), which we use in the robustness check, is given by the sum of each component’s value. In principle, higher values correspond to stronger minority shareholder protection. In this robust-ness check three additional model specifications are performed. In the first and second specifications we use—as the dependent variable in equation (1)—innovative activity measured by, respectively, the number of patents in a five-year period weighted by the country’s population and the number of patents in a five-year period weighted by the country’s GDP, and where the logarithm of the market capitalisation (MkCap) is the dependent variable in equation (2). In the third additional model specification, we use innovative activity measured by the number of patents in a five-year period weighted by the country’s GDP as the dependent variable in equation (1) and substitute MkCap with the logarithm of the value of shares traded in the stock market (StockTraded), expressed as a percentage of the country’s GDP, in both equations (1) and (2). In this way the robustness of the estimates is checked also to another measure of financial mar-ket development. The source of the StockTraded variable is World Bank (2008).
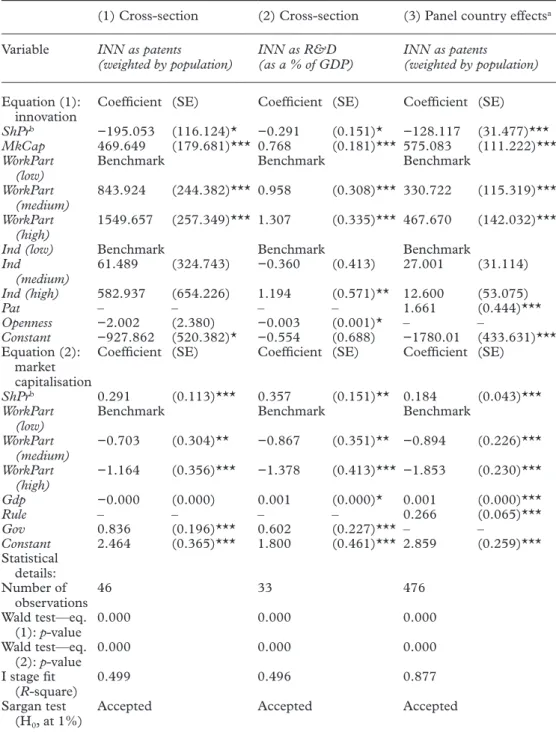
The results of these robustness checks are reported in Tables 3 and 4. Models (1) and (2) of Table 3 are cross-sectional specifications in which minority shareholder rights are measured by means of the Spamann (2010) index; model (3) of Table 3 is a panel model in which minority shareholder rights are measured by means of the Pagano and Volpin (2005) index and country fixed effects are added on the right-hand side of the model (in Table 3 they are not reported for reasons of space). Notice also that while in model specifications (1) and (3) reported in Table 3 a weighted number of patents is used as an indicator of innovation, R&D spending is used in model specifica-tion (2). Models (1) and (2) of Table 4 are panel specifications in which the ShPr vari-able is substituted by Cbr. In model (3) of Table 4, lastly, Cbr is used as the shareholder protection index and MkCap is substituted by StockTraded.
The main result is shown to be robust both to a different measure of minority share-holder protection and financial development, and to the presence of unobservable factors affecting innovation directly or indirectly through, for example, informal share-holder activism. As can be seen in Tables 3 and 4, we find that an index of minority
5 For example, countries that tend to exhibit a concentrated corporate ownership structure may show,
keeping other factors constant, a lower level of innovative investment projects, to the extent that a reduction of managerial discretion by large outside shareholders is detrimental to firm-specific investments (see, e.g., Burkart et al., 1997). Moreover, country fixed effects allow us to control also for time-invariant legal tradi-tions that may affect fiscal policies and other institutional dimensions relevant to corporatradi-tions’ innovation.
at School of Oriental and African Studies on July 8, 2013
http://cje.oxfordjournals.org/
Table 3. Cross-country estimation results: results of the robustness check estimations (3SLS, all industries) (1) Cross-section (2) Cross-section (3) Panel country effectsa
Variable INN as patents
(weighted by population) INN as R&D (as a % of GDP) INN as patents (weighted by population) Equation (1):
innovation Coefficient (SE) Coefficient (SE) Coefficient (SE) ShPrb −195.053 (116.124)* −0.291 (0.151)* −128.117 (31.477)***
MkCap 469.649 (179.681)*** 0.768 (0.181)*** 575.083 (111.222)*** WorkPart
(low) Benchmark Benchmark Benchmark
WorkPart
(medium) 843.924 (244.382)*** 0.958 (0.308)*** 330.722 (115.319)*** WorkPart
(high) 1549.657 (257.349)*** 1.307 (0.335)*** 467.670 (142.032)***
Ind (low) Benchmark Benchmark Benchmark
Ind (medium) 61.489 (324.743) −0.360 (0.413) 27.001 (31.114) Ind (high) 582.937 (654.226) 1.194 (0.571)** 12.600 (53.075) Pat – – – – 1.661 (0.444)*** Openness −2.002 (2.380) −0.003 (0.001)* – – Constant −927.862 (520.382)* −0.554 (0.688) −1780.01 (433.631)*** Equation (2): market capitalisation
Coefficient (SE) Coefficient (SE) Coefficient (SE)
ShPrb 0.291 (0.113)*** 0.357 (0.151)** 0.184 (0.043)***
WorkPart
(low) Benchmark Benchmark Benchmark
WorkPart (medium) −0.703 (0.304)** −0.867 (0.351)** −0.894 (0.226)*** WorkPart (high) −1.164 (0.356)*** −1.378 (0.413)*** −1.853 (0.230)*** Gdp −0.000 (0.000) 0.001 (0.000)* 0.001 (0.000)*** Rule – – – – 0.266 (0.065)*** Gov 0.836 (0.196)*** 0.602 (0.227)*** – – Constant 2.464 (0.365)*** 1.800 (0.461)*** 2.859 (0.259)*** Statistical details: Number of observations 46 33 476 Wald test—eq. (1): p-value 0.000 0.000 0.000 Wald test—eq. (2): p-value 0.000 0.000 0.000 I stage fit (R-square) 0.499 0.496 0.877 Sargan test (H0, at 1%)
Accepted Accepted Accepted
SE, standard error. Notes:
aCountry fixed effects not reported. bShPr
it: default rules in panel estimation, mandatory rules in cross-sectional estimation.
* = 10% significance, ** = 5% significance, *** = 1% significance.
at School of Oriental and African Studies on July 8, 2013
http://cje.oxfordjournals.org/
Table 4. Cross-country estimation results: results of the robustness check estimations (3SLS, all industries)
(1) Panel (2) Panel (3) Panel
Variable INN as patents
(weighted by population) INN as patents (weighted by GDP) INN as patents (weighted by GDP) Equation (1):
innovation Coefficient (SE) Coefficient (SE) Coefficient (SE) Cbr −35.391 (12.476)*** −1.339 (0.449)*** −2.043 (0.783)***
MkCap 86.228 (42.136)** 3.804 (1.596)** – –
StockTraded – – – – 4.954 (2.311)**
WorkPart
(low) Benchmark Benchmark Benchmark
WorkPart
(medium) 144.739 (45.655)*** 5.261 (1.679)*** 3.513 (1.876)* WorkPart
(high) 98.322 (52.950)* 6.440 (2.353)*** 2.447 (2.550)1 Ind
(low) Benchmark Benchmark Benchmark
Ind (medium) 22.915 (36.920) 0.537 (1.343) 1.004 (1.853) Ind (high) 21.164 (175.815) 1.115 (6.335) 2.765 (6.163) Pat 4.665 (0.246)*** 4.437 (0.306)*** 4.390 (0.440)*** Constant −180.290 (126.643) −8.189 (4.759)* −6.304 (5.619) Equation (2): dependent variable
MkCap Yes Yes No
StockTraded No No Yes
Coefficient (SE) Coefficient (SE) Coefficient (SE)
Cbr 0.075 (0.039)* 0.075 (0.039)* 0.175 (0.055)**
WorkPart
(low) Benchmark Benchmark Benchmark
WorkPart (medium) −0.294 (0.154)* −0.294 (0.154)* 0.067 (0.217) WorkPart (high) −0.316 (0.201) −0.314 (0.200) 0.516 (0.284)* Gdp −0.000 (0.000) −0.000 (0.000) 0.000 (0.000) Rule 0.697 (0.108)*** 0.695 (0.108)*** 0.457 (0.154)*** Constant 3.302 (0.178)*** 3.301 (0.178)*** 2.098 (0.256)*** Statistical details: Number of observations 160 160 160 Wald test—eq. (1): p-value 0.000 0.000 0.000 Wald test—eq. (2): p-value 0.000 0.000 0.000 I stage fit (R-square) 0.444 0.444 0.393 Sargan test (H0, at 1%)
Accepted Accepted Accepted
SE, standard error.
Note: * = 10% significance, ** = 5% significance, *** = 1% significance.
at School of Oriental and African Studies on July 8, 2013
http://cje.oxfordjournals.org/
shareholder protection has a negative and statistically significant effect on innovation in all six model specifications considered.
Interestingly, (unreported) estimated country fixed effects (obtained by including 47 country dummies in the panel model specification (3) of Table 3, the US dummy being excluded) show that Germany’s unobserved factors have a positive effect on innovation. Indeed, using the USA as the benchmark, the estimated parameter for Germany is shown to be positive and statistically significant at the 1% level, which is consistent with the argument that some unobserved factors characterising the USA in comparison with Germany, such as a larger informal shareholder activism, may have a negative effect on innovation.
We also find, in model specification (1) of Table 3, that the degree of country trade openness (Openness) does not affect the country-level production of patents in a statis-tically significant way. However, the results of model specification (2) of Table 3 show that trade openness has a negative effect on country R&D spending at the 10% level of statistical significance, which is consistent with previous findings (Furman et al., 2002).
Lastly, these estimation results are validated by the diagnostic analysis, the statistical details of which are reported at the bottom of Tables 3 and 4.6
5.3 Sensitivity analysis
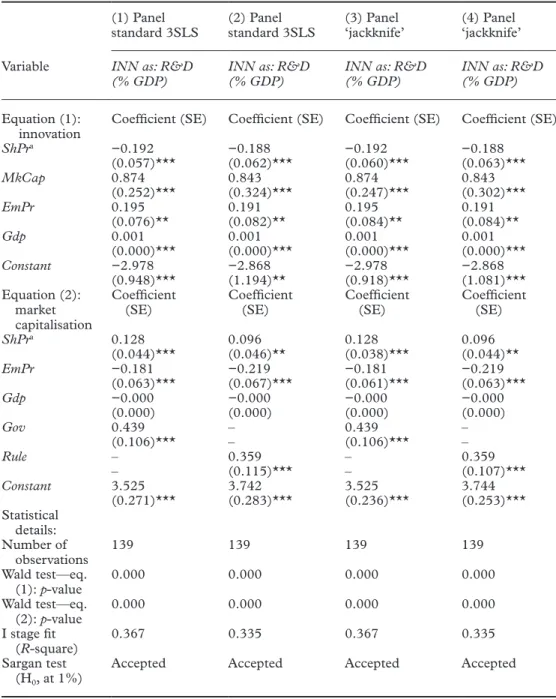
In this section, a sensitivity analysis of the empirical findings is conducted. The coun-tries included in the sample are at different stages of economic development and also might show outlier values in their innovative activity and economic characteristics. Here, we test whether countries’ heterogeneity in economic development and outlier values influence the statistical relevance of the estimation results. Specifically, we esti-mate the effect of legal shareholder control on innovative activity (measured through R&D spending as a percentage of a country’s GDP), controlling for the country’s GDP per capita (which is considered as a proxy for economic development), market capitalisation and other factors—market capitalisation being treated as an endogenous variable. Furthermore, we estimate the panel model both using a standard 3SLS esti-mator and a ‘jackknife’ variance estiesti-mator. The use of the ‘jackknife’ variance estima-tor permits a cross-validation process, which helps to detect the possible relevance of influential outliers to the estimation results. In the ‘jackknife’ estimate the sample of size n is divided in g groups of size m (where m = n – k). The estimate of each param-eter is computed g times, by ignoring the generic j-th group in each round. The overall parameter estimate is then obtained as the average of the g parameters. The estimation results are reported in Table 5.
Model specifications (1) and (2) of Table 5 are estimated through a standard 3SLS estimator, while specifications (3) and (4) of Table 5 are estimated through a ‘jackknife’
6 In unreported estimates we have tried to run our models on subsamples specific for different legal
origins. In particular we have isolated civil-law countries from the rest of the sample and performed an estimation analysis on the two subsamples so obtained. Unfortunately, post-estimation tests do not allow us to statistically accept the results obtained, perhaps due to low subsample size. In an additional (unreported) estimation, the basic econometric model was also run on the full sample, including a dummy variable for civil-law countries in the vector of controls in both equations (1) and (2). Such a variable is shown to have a negative and statistically significant effect on financial market development and a non-statistically significant effect on innovation outcomes. However, post-estimation tests, again, do not statistically validate the global estimation outcome.
at School of Oriental and African Studies on July 8, 2013
http://cje.oxfordjournals.org/
Table 5. Cross-country estimation results: sensitivity analysis (standard 3SLS and ‘jackknife’) (1) Panel
standard 3SLS (2) Panel standard 3SLS (3) Panel ‘jackknife’ (4) Panel ‘jackknife’ Variable INN as: R&D
(% GDP) INN as: R&D (% GDP) INN as: R&D (% GDP) INN as: R&D (% GDP) Equation (1):
innovation Coefficient (SE) Coefficient (SE) Coefficient (SE) Coefficient (SE)
ShPra −0.192 −0.188 −0.192 −0.188 (0.057)*** (0.062)*** (0.060)*** (0.063)*** MkCap 0.874 0.843 0.874 0.843 (0.252)*** (0.324)*** (0.247)*** (0.302)*** EmPr 0.195 0.191 0.195 0.191 (0.076)** (0.082)** (0.084)** (0.084)** Gdp 0.001 0.001 0.001 0.001 (0.000)*** (0.000)*** (0.000)*** (0.000)*** Constant −2.978 −2.868 −2.978 −2.868 (0.948)*** (1.194)** (0.918)*** (1.081)*** Equation (2): market capitalisation Coefficient
(SE) Coefficient (SE) Coefficient (SE) Coefficient (SE)
ShPra 0.128 0.096 0.128 0.096 (0.044)*** (0.046)** (0.038)*** (0.044)** EmPr −0.181 −0.219 −0.181 −0.219 (0.063)*** (0.067)*** (0.061)*** (0.063)*** Gdp −0.000 −0.000 −0.000 −0.000 (0.000) (0.000) (0.000) (0.000) Gov 0.439 – 0.439 – (0.106)*** – (0.106)*** – Rule – 0.359 – 0.359 – (0.115)*** – (0.107)*** Constant 3.525 3.742 3.525 3.744 (0.271)*** (0.283)*** (0.236)*** (0.253)*** Statistical details: Number of observations 139 139 139 139 Wald test—eq. (1): p-value 0.000 0.000 0.000 0.000 Wald test—eq. (2): p-value 0.000 0.000 0.000 0.000 I stage fit (R-square) 0.367 0.335 0.367 0.335 Sargan test (H0, at 1%)
Accepted Accepted Accepted Accepted
SE, standard error. Notes:
aShPr
it: default rules.
* = 10% significance, ** = 5% significance, *** = 1% significance.
at School of Oriental and African Studies on July 8, 2013
http://cje.oxfordjournals.org/
variance estimator. Specifications (1) and (3), on the one hand, and specifications (2) and (4), on the other, are obtained by using, respectively, government’s independence (Gov) and rule of law (Rule) as an instrument for the market capitalisation (MkCap). In this way we are able to check whether (and if yes, to what extent) the choice of the instrument influences the estimation results.
The parameter estimates are shown to be stable across different model specifica-tions. In particular, shareholder protection (ShPr) has a negative and statistically sig-nificant effect on innovation (here measured by means of R&D spending) in all the considered models. This confirms the statistical robustness of the main findings to dif-ferent levels of economic development across the country samples and to the possible presence of outliers. Moreover, both the government’s independence and the rule of law turn out to be good instruments for market capitalisation.
5.4 Industry heterogeneity
We also explore how the relationship between countries’ innovation and national legal institutions of shareholder protection varies across industries. Indeed, some industries are relatively more in need of external finance, as suggested by Rajan and Zingales (1998). For example, telecommunications and information technology productions are shown to be more dependent on external financing, while process engineering (e.g. food processing, paper and materials processing) is less dependent. This implies that, ceteris
paribus, stock market development should have a greater influence on innovative activity
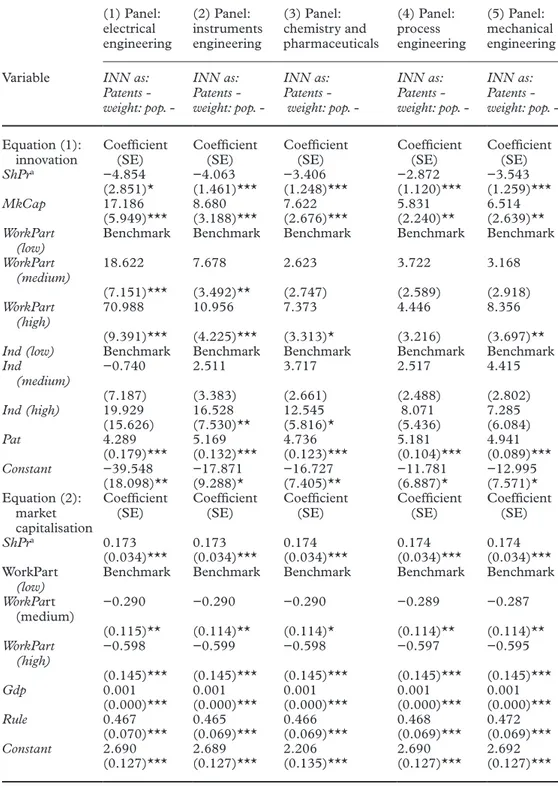
in an industry such as electrical engineering than in process or mechanical engineer-ing, which requires little external finance. In turn, if our intershareholder opportunism argument is correct, this may affect the intensity of the marginal effect of the institu-tions of shareholder protection on countries’ innovative performance, to the extent that ‘finance-hungry’ industries are more open to small stockholders’ equity investments. In order to explore this heterogeneity dimension and to provide more precise estimation results, industry-specific versions of the model are performed. Specifically, patent data are grouped according to the five-industry ISI–INIPI–OST classification system as fol-lows: (i) electrical engineering and information and telecommunications technology; (ii) optics, instruments and medical technology; (iii) chemistry and pharmaceuticals; (iv) paper and printing, material processing, metallurgy and process engineering; and (v) transport and mechanical engineering. The results of this further method are reported in Table 6. The left-hand column reports the variables, while the remaining columns report the estimated parameters of industry-specific models. In all of the model specifications reported from column (1) to column (5) of Table 6, innovative activity is measured by the number of patents in a five-year period weighted by the country’s population, while shareholder protection is measured through the index of Pagano and Volpin (2005).
When the estimation is performed on industry-specific samples, our main conclu-sion does not change, as the estimated coefficient relating to the shareholder protec-tion index remains negative and statistically significant at the 1% level across sectors. In addition, industry-specific regressions reveal that the effect of market capitalisation on innovative activity is higher in those sectors that rely relatively more on external funding (such as electrical engineering), which in turn is related to a stronger negative effect of the minority shareholder protection institutions. On the contrary, an industry such as process engineering, which is relatively less dependent on external finance, shows a weaker link between stock markets, investor protection and innovation.
at School of Oriental and African Studies on July 8, 2013
http://cje.oxfordjournals.org/