PhD program in Biotechnologies for Human Health
XXVI cycle
EXTRACELLULAR VESICLES:
DEVELOPMENT OF ISOLATION METHODS AND
ANALYSIS IN ERYTHROID RIBOSOMAL STRESS
PhD thesis of
ROSSELLA CRESCITELLI
By believing passionately something
that still does not exist, we create it.
The nonexistent is whatever
we have not sufficiently desired.
Franz Kafka
(3 July 1883 - 3 June 1924)
Extracellular vesicles (EVs) are membrane-covered cell fragments released by most cell types, in different physiological and pathophysiological conditions.
Although a definitive categorization has yet to be achieved, EVs can be
classified in three classes: apoptotic bodies (ABs),
microvesicles/microparticles (MVs/MPs) and exosomes (EXOs). Due to numerous similarities that exist among them the separation is still a challenge so a standardized approach to their isolation and characterization is required.
In the first part of this thesis, we focused on proper separation and characterization of subpopulations of EVs.
First of all we compared a differential centrifugation-based protocol used to isolate ABs and MVs and another protocol used to isolate EXOs after removal of ABs and MVs. EVs from supernatant of three cell lines were characterized focusing on their morphology, RNA profile and surface marker expression. We demonstrated that pellets showed highly different distribution of size, shape and electron density with typical AB, MV and EXO characteristics. Distinct vesicles fractions had clearly different RNA profiles. rRNA was primary detectable in ABs and smaller RNAs without prominent rRNA profiles in EXOs. By contrast, MVs contained little or no RNA except for those collected from TF-1 cells. Moreover, we showed that markers considered typical of EXOs (CD9, CD63 and CD81) were present in all EV types when vesicles were analyzed by flow cytometry using anti-CD63-coated beads.
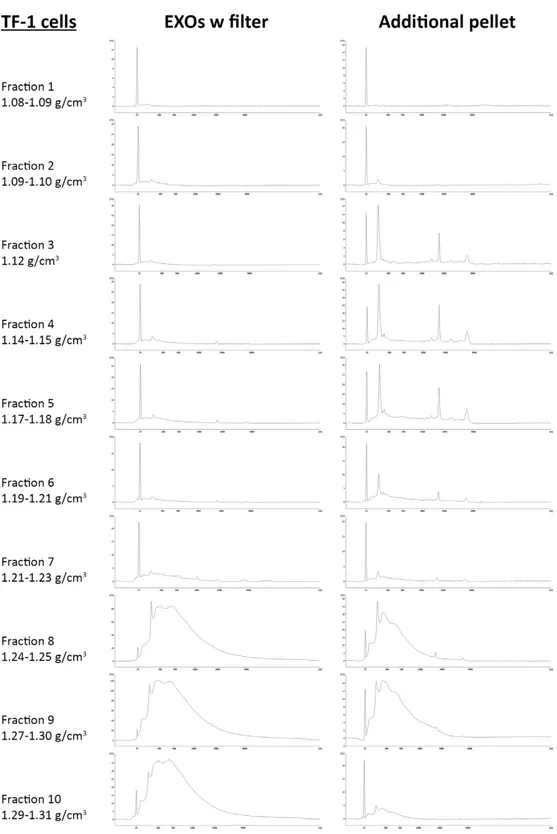
To further investigate EV subpopulations, we demonstrated that two populations of exosome-like vesicles could be identified with or without using 0.22 µm filter. In particular, just one pellet was collected using filter (“EXOs w/o filter”) whereas two different pellets were collected without filter: “additional pellet”, at the bottom of the tube and “EXOs w filter”, attached to the tube. As well as for ABs, MVs and EXOs, they showed
“additional pellet”. Moreover, loading “EXO w filter” and “additional pellet” on sucrose gradient, RNA profile analysis showed that RNAs in the two pellets have a different distribution. In “EXO w filter”, small RNA was found in lower fractions whereas “additional pellet” showed both rRNA-positive fractions (in upper fractions) and rRNA-negative fractions (in lower fractions). Our results demonstrated that the differences shown in EXO studies could be due not only to a different EXO origin, but also to the different filter used.
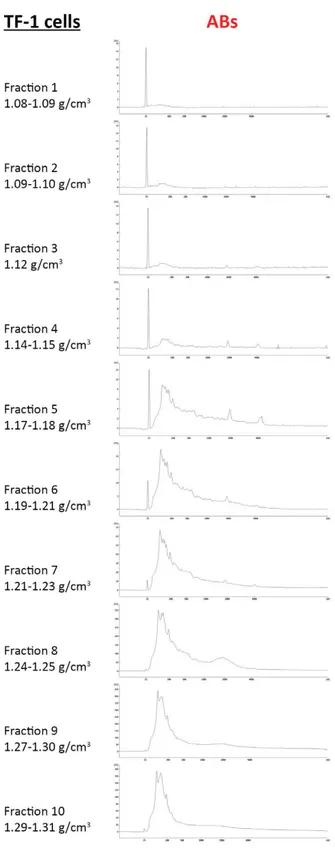
Further investigation demonstrated that EV nomenclature is still a problem; authors often investigated the same type of vesicles, but called them in different ways. By loading ABs, MVs, EXOs as well as “EXO w filter” and “additional pellet” on sucrose gradient and looking at RNA profiles, we demonstrated that MV pellet was composed by both rRNA-positive vesicles (in upper fractions) and RNA-negative vesicles (in lower fractions) similar to what observed in “additional pellet”. Fractions obtained from EXO pellet were composed only by rRNA-negative vesicles as observed in fractions from “EXO w filter”.
After the development of EV isolation method, able to reduce the contamination between different EV types, we applied our technical knowledge to investigate EVs in a specific biological process: ribosomal stress, a condition caused by aberrant ribosome biogenesis. Defects of ribosome biogenesis lead to a number of ribosomal diseases. Diamond Blackfan Anemia (DBA) is the first human disorder discovered in this group. Abnormal ribosome biogenesis induces apoptosis in erythroid progenitors so DBA research is limited by the unavailability of the disease cell target. Analysis of EVs shed from erythroid progenitors is useful to overcome this limitation.
First we investigated EV miRNA composition in CD34+ cells after induction
of ribosomal stress due to silencing of RPS19 (DBA cell model) and then we evaluated EVs in blood from patients with DBA. miRNAs that were
Specifically, in MVs C versus MVs S, three miRNA were up-regulated 412, miR-1281, miR-1273f) and eight were down-regulated (miR-153, miR-1248, miR-526b-5p, miR452-5p, miR-105-5p, miR-374a-5p, miR-148a-3p and miR-588). Comparing miRNAs changed in EXOs C versus EXOs S, just one miRNA showed to be up-regulated (miR-643), whereas four miRNAs were down- regulated (654-3p, 1276, miR-539-5p and miR-188-3p). Interestingly, two of these miRNAs are involved in cell death i.e. miR-412 and miR-153. miRNA signature in MVs and EXOs released in ribosomal stress has been identified for the first time. The finding of abnormalities in vesicles shed from cells representing a model for DBA prompted us to explore the diagnostic potential of erythroid vesicles in patients with DBA. MPs were collected from blood of patients with DBA, patients showing a non-DBA haematological disease and healthy controls. Vesicle markers were studied by flow cytometry: CD34, CD71 CD235a (Glycophorin A) and phosphatidylserine (PS). The MP number in specific gates has been calculated. Interestingly, we found that the
CD34+/CD71low population was absent in anemic patients with DBA, but
was well represented in healthy controls and in patients affected by a non-DBA condition. The receiver operating curve (ROC) analysis showed that
MP CD34+/CD71low evaluation had a good diagnostic value for DBA
diagnosis. Other MP populations have been identified demonstrating that flow cytometry is able to analyse MP shed from hematopoietic cells at different developmental stage.
1.1 Extracellular vesicles (EVs) 2
1.1.1 Apoptotic bodies (ABs) 3
1.1.2 Microvesicles (MVs) 5
1.1.3 Exosomes (EXOs) 7
1.2 Molecular composition of extracellular vesicles 9 1.3 Isolation and characterization methods 10 1.4 Extracellular vesicles: medical implications and therapeutic/diagnostic
potential 13
1.5 Extracellular vesicles from blood samples 16
1.5.1 Pre-analytical challenges 16 1.5.2 Methods of EV analysis in blood 18
1.6 Erythropoiesis and erythroid progenitor markers 19
1.6.1 Extracellular vesicles from reticulocytes 22
1.7 Extracellular vesicles released during cellular stress – p53 involvement 24 1.8 Ribosomal stress: cell proliferation inhibition through p53dependent and
-independent mechanisms 27
1.9 Diamond Blackfan Anemia (DBA), a human disease due to ribosomal
stress 29
1.9.1 Clinical features and molecular basis 29 1.9.2 Global gene expression in p53 null-cell models of DBA suggests
activation of p53-independent pathways (Aspesi et al, submitted to Gene) 31
2. Overview of the objectives 57
3. Results and discussion 59
3.1 Isolation and characterization of EVs: RNA profile analysis distinguishes
EV subpopulations 60
3.1.1 Centrifugation based protocols to separate ABs, MVs and EXOs (Crescitelli et al, 2013) 60 3.1.2 Effect of filtration on the purity of exosome fraction: identification of two types of exosome-like vesicles 73
· Aim of the project 73
· Experimental plan and methods 73
· Results and discussion 75
3.1.3 RNA characterization in EV subpopulations: RNA profile
comparison between exosomes-like vesicles and ABs, MVs and EXOs 80
· Aim of the project 80
3.2.1 MicroRNA signature in MVs/EXOs shed from CD34+ cells down- regulated for RPS19 (DBA cell model) 87
· Aim of the project 88
· Experimental plan and methods 88
· Results and discussion 90
3.2.2 Diagnostic potential of extracellular vesicles – characterization and quantification of microparticles in patients with Diamond Blackfan Anemia (DBA) 96
· Aim of the project 96
· Experimental plan and methods 97
· Results and discussion 100
4. Conclusions and future perspectives 118
References 126
1. Introduction
2
1.1 Extracellular vesicles (EVs)
Extracellular vesicles (EVs) are membrane-covered cell fragments released by most cell types, in different physiological and pathophysiological conditions (Théry C., 2009), (Mathivanan S J. H., 2010), (Ratajczak J., 2006), (Cocucci E, 2009), (Johnstone RM, 2006).
They can be detected in body fluids including blood, plasma, urine, saliva, amniotic fluid, milk, pleura ascites (Simpson RJ, 2009), (Lässer C A. V., 2011), and contain proteins, lipids and RNA that are representative of host cell (Valadi H, 2007), (Théry C Z. L., 2002), (Mathivanan S L. J., 2010). It is becoming increasingly clear that they have specialized functions and play a key role in intracellular signalling, waste management and coagulation. Consequently, there is a growing interest in the clinical application of EVs. Vesicles can potentially be used for therapy, prognosis and as disease biomarker (van der Pol E B. A., 2012).
The discovery of EV dates back to 1940, thanks to preliminary studies performed with the aim to study the “biological significance of thromboplastic protein of blood” (Chargaff E, 1946). More than twenty years later, this subcellular fraction was identified by electron microscopy and was shown to consist of small vesicles, originating from platelets and termed “platelet dust” (Wolf P., 1967). Ten years later, numerous microvesicles were detected in foetal calf serum (Dalton AJ., 1975). From this preliminary studies, dozen of different names have been used for extracellular vesicles based on their specific function: calcifying matrix vesicles that initiate bone formation (Anderson HC., 1969), tolerosomes that induce immunological tolerance, or their cell origin: dexosomes (dendridic cell-derived exosomes) (Le Pecq JB., 2005), prostasomes (prostate-derived exosomes) (Stegmayr B, 1982), matrix vesicles (vesicles in bone, cartilage and atherosclerotic plaques) (Tanimura A, 1983), synaptic vesicles (vesicles from neurons) (Fischer von Mollard G, 1990). Though a definitive categorization is yet to be achieved (Simpson RJ., 2012), EVs can be classified in three classes based on their size and presumed biogenetic
pathways: apoptotic bodies (ABs), microvesicles (MVs) and exosomes (EXOs) (Kalra H, 2012) (Fig.1).
Fig.1: Schematic representation of extracellular vesicles (EVs). Principal
populations are shown: apoptotic bodies (ABs), microvesicles (MVs) and exosomes (EXOs). Modified from György B et al, 2011.
1.1.1 Apoptotic bodies (ABs)
In 1972, for the first time, the term “apoptotic body” has been used (Kerr JF, 1972), but Horviz R. et al conducted the seminal work in apoptosis research studying cell development in Caenorhabditis elegans (Sulston JE, 1977) (Fixsen W, 1985).
These particles have a size between 1-5 µm, similar to the size range of platelets (Hristov M, 2004), a density between 1.16 to 1.29 g/ml, partially overlapping with exosome density and a morphology that is heterogeneous when compared with other vesicles visualized by TEM (van der Pol E B. A., 2012). They are released as blebs from cells undergoing apoptosis. A cell dying by apoptosis goes through several stages: they start with condensation of the nuclear chromatin, followed by membrane blebbing and progress to
4
disintegration of the cellular content into membrane vesicles termed apoptotic bodies. The clearance of apoptotic bodies by macrophages is mediated by specific interactions between recognition receptors on the phagocytes and the specific changes (such as oxidation of surface molecules) in the composition of the apoptotic cell membrane. These changes create binding sites for Thrombospondin (Tsp) or the complement protein C3b (Akers JC, 2013). (Fig.2)
Fig.2: Formation of apoptotic bodies during apoptosis. Modified from Akers JC et
al, 2013.
Apoptotic cells release two different types of apoptotic vesicles: the first one originates from the plasma membrane and contains DNA and hystones, whereas the other originates from endoplasmic reticulum and does not contain DNA or hystones, but exposes immature glycoepitopes (Bilyy RO, 2012). For studies focused on cells undergoing apoptosis, generally, authors look at the phosphatidylserine expression and DNA fragmentation (Beyer C, 2010). ABs are involved in horizontal transfer of DNA (Holmgren L, 1999) including oncogenes (Bergsmedh A, 2001) and presentation of T cell epitopes (Bellone M, 1997).
1.1.2 Microvesicles (MVs)
They were described for the first time by Chargaff and West in 1946 (Chargaff E, 1946). Twenty years later, Wolf P. isolated a fraction composed by lipid-rich particles obtained by ultracentrifugation from plasma and called them “platelet dust” (Wolf P., 1967).
MVs have a size between 100-1000 nm (Théry C O. M., 2009) overlapping that of bacteria, but there is no consensus on the lower cut-off (Yuana Y, 2011). They are surrounded by phospholipid bilayer and are shed directly from budding of plasma membrane (György B S. T., 2011). They are released during cell stress conditions (van der Pol E B. A., 2012) after activation of cell surface receptors or during apoptosis following
intracellular Ca2+ increase (Baroni M, 2007), (Kahner BN, 2008). These
vesicles are involved in procoagulant function (Leroyer AS, 2008), in the pathogenesis of rheumatoid arthritis (Boilard E, 2010), tumour proinvasive activity (Giusti I, 2008), neoplastic transformation (Antonyak MA, 2011), foetus-mother communication (Pap E, 2008). They are generally characterized by phosphatidylserine but some observations suggest the existence of MVs that are negative for this marker (Connor DE, 2010). They are isolated using centrifugation-based protocols (Yuana Y, 2011) using a centrifugation force of 10,000-20,000 g (Théry C O. M., 2009) or capture-based assays (Sellam J, 2009) followed by flow cytometry (György B M. K., 2011).
Few proteins seem to be ubiquitously expressed; an example is β1 integrin (Dolo V, 1998). MV composition depends on cell of origin. MVs from tumours express metalloproteinases and other proteolytic enzyme (Gutwein P, 2003), (Gasser O, 2003), whereas MVs from platelets express integrins, glycoproteins GPIb, GPIIb-IIIa and P selectin (Del Conde I, 2005), (Cocucci E, 2009). MVs are able to interact with cells that they recognize specifically and transfer receptors, ligands, mRNAs and miRNAs contributing to epigenetic ad proteomic properties of target cells (Fig.3) (Hunter MP, 2008), (György B M. K., 2011).
6
Fig. 3: MV-mediated intercellular communication. Components of donor cells are
incorporated into MVs that contain proteins, RNAs and DNA. MVs can be taken up by recipient cells through endocytosis and release their contents after fusing with the endosomal membrane or the plasma membrane. Modified from van der Vos KE et al, 2011.
It has been demonstrated that they induce change in the maturation and differentiation of target cells. For example, MVs from neutrophils can impair the maturation of dendritic cells (Eken C, 2008).
They have been through studied in coagulation. Upon exposure to collagen, platelets release MVs coated with tissue factor which binds with its surface ligand (for example P-selectin1) on macrophages (Polgar J, 2005), neutrophils (Pluskota E, 2008) and other platelets.
An increased amount of MVs has been observed in plasma from patients with anti-phospholipid syndrome (Asherson’s syndrome) (Ardoin SP, 2007) as well as in inflammatory conditions (Distler JH, 2005).
They have roles in tumours progression and contribute to angiogenic effect through horizontal transfer of mRNAs and miRNAs (Skog J, 2008).
Because of these properties EVs are considered as potentially innovative targets for therapy.
1.1.3 Exosomes (EXOs)
The term “exosome” was first used in 1981 for vesicles with nucleotidase activity that were shed from neoplastic cell lines (Trams EG, 1981). In 1983 Stahl and Johnstone (Harding C, 1983), (Pan BT T. K., 1985) described small vesicles containing transferrin receptor that were released from reticulocytes.
EXOs have a diameter between 50-100 nm and a density that ranges between 1.13 and 1.19 g/ml. They show a phospholipid bilayer structure with a size overlapping that of viruses. They are found in many fluids (urines, blood, ascites, cerebrospinal fluid) (Caby MP, 2005), (Pisitkun T, 2004), (Keller S, 2006), (Vella LJ, 2008).
Differential centrifugations followed by sucrose gradient
ultracentrifugations are typically used for EXO isolation (Théry C A. S., 2006). Transmission electron microscopy (TEM), western blot and mass spectroscopy are used for their characterization. Using TEM, the morphology of exosomes has been described as cup-shaped (Johnstone RM A. M., 1987). However, more recent studies have shown that the cup-shaped morphology was an experimental artefact caused by the procedures used to prepare samples (Conde-Vancells J, 2008).
The exosome formation process starts with the invagination of plasma membrane (endocytosis) (Huotari J, 2011). This process can be clathrin-mediated (classical pathway) or clathrin independent, a less studied process compared to the first one (Le Roy C, 2005). Within the cell, endocytic vesicles fuse with early endosomes that mature into late endosomes and then in multivesicular bodies (MVBs). Two types of MVBs are recognized; one is formed in the degradative pathway (i.e. MVBs that fuse with lysosomes) and the other in the exocytosis pathway (i.e. MVBs that fuse with plasma membrane) (Mathivanan S S. R., 2009). Exosomes are formed
8
by endocytosis of early endosome membrane (Roizin L, 1967). MVB generation and exosome secretion depend on the action of the ESCRT complex, an endosomal complex that is required for transport (Wollert T, 2010) (Fig. 4).
Fig. 4: Schematic description of exosome (EXOs) release. EXOs are represented
by small vesicles of different sizes that are formed by budding from early endosomes or MVBs and they are released by fusion with the plasma membrane. Other MVBs fuse with lysosomes. Modified from Raposo G et al, 2013.
To date, the most studied and characterized EXOs are those released from immune and tumour cells. They are involved in antigen presentation (Théry C., 2009), (Raposo G N. H., 1996), immunostimulation, tumour growth, metastasis and angiogenesis (van der Pol E B. A., 2012). Thus they can protect tumour cells inhibiting antitumor drug accumulation. They can contribute to multidrug resistance (Ciravolo V, 2012).
They exert their functions in different ways: direct exosome-cell contact, vesicle endocytosis and exosome-cell fusion (Théry C., 2009). As well as microvesicles, they can transfer mRNAs and miRNAs (Valadi H, 2007), but also oncogenic receptors (Al-Nedawi K M. B., 2008) and HIV particles (Izquierdo-Useros N, 2009). By transporting ligands and receptors, they can
drive cell growth and development and thus also modulate the immune system (van der Pol E B. A., 2012). For example, it has been demonstrated
that activated T cells and peripheralblood mononuclear cells release EXOs
expressing Fas Ligand suggesting that they have a role in cell death during immune regulation (Martínez-Lorenzo MJ, 2004).
Structurally, they are characterized by phosphatidylserine exposure (Chaput N, 2011) and high levels of cholesterol, sphingomyelin, ceramide and lipid rafts (Wubbolts R, 2003), (Simons M, 2009), (Mathivanan S J. H., 2010), (Théry C A. S., 2006). Typical EXO markers are tetraspanins such as CD63, CD81, CD9 and proteins like LAMP1 and TGS101 (Mathivanan S J. H., 2010), (Dignat-George F, 2011) Alix complex, heat shock proteins as well as proteins involved in membrane transport and fusion, like Rab, GTPase, annexin and flottilin (Théry C Z. L., 2002), (Beyer C, 2010), (Bobrie A C. M., 2011), (Record M, 2011).
1.2 Molecular composition of extracellular vesicles
As mentioned in chapter 1.1, the protein composition reflects the origin of the parental cells (Pap E, 2008). EXOs from different cell lines contain endosome-associated proteins such as Rab GTPase, SNARE, Annexin, flotillin. Some of them are involved in multivesicular endosomes biogenesis, such as Alix and Tsg101 (van Niel G, 2006). EVs are enriched in membrane proteins because of their plasma membrane or endosome origin. Tetraspanins are among the most common membrane proteins in all EVs, e.g. CD63, CD81, CD82, CD53 and CD37. They were firstly identified in EXOs from B cells (Escola JM, 1998). EVs are also enriched in proteins associated with lipids raft (such as flotillin) (Théry C R. A.-C., 1999).
EXOs expose different saturated and monosaturated fatty acids as well as cholesterol and sphingomyelin. Little is known about specific proteins and lipid composition of MVs (Raposo G S. W., 2013).
10
In 2007, Valadi et al demonstrated that EVs included both mRNAs and miRNAs. mRNAs from EVs can be translated in protein when inserted in target cells. 1300 mRNAs were found in EXOs from mouse mast cell line, human mast cell line and BMMC (Bone Marrow-derived Mast Cells) (Valadi H, 2007). Extracellular RNA has been found not only in EXOs but also in MVs (Grange C, 2011) and ABs (Zernecke A, 2009). The mRNAs or miRNAs reflect the originating cell profile (Skog J, 2008), (Ratajczak J., 2006). Beyond mRNAs and miRNAs many authors demonstrated that EVs contain other small non coding RNAs such as tRNA fragments, Y RNA, small interfering RNA (Bellingham SA, 2012), (Nolte-'t Hoen EN, 2012) as well as fragments of 28S and 18S rRNA subunits (Jenjaroenpun P, 2013). The complete protein, lipid and RNA composition of EVs is listed in two
online databases: ExoCarta (www.exocarta.org) and EVPedia
(www.evpedia.info/).
1.3 Isolation and characterization methods
Extracellular vesicle studies are hampered by lack of a standardized protocol that distinguishes different vesicle types (Onodera T, 2010). Numerous similarities exist among the different EVs; this makes the separation of different subsets a challenge (György B S. T., 2011).
The widely accepted protocol for EXO isolation includes ultracentrifugation followed by sucrose density gradient or cushions (Théry C A. S., 2006). However, a differential centrifugation protocol based on different centrifugations with increased force, is considered the “gold standard” system (Stephen J. Gould, 2013) and useful to separate subpopulations of extracellular vesicles at different steps. The use of a filtration step is debated. There is not a general agreement on the optimal isolation protocol for MVs or ABs.
In general, the isolation procedure includes a first centrifugation step (200-1,500 × g) to eliminate cells and cellular debris followed by a stronger
centrifugation (10,000-20,000 × g) to eliminate vesicles with a bigger size (100-800 nm generally called MVs). A higher speed centrifugation (100,000 – 200,000 × g) is able to pellet EXOs (Mathivanan S J. H., 2010), (Théry C Z. L., 2002), (Théry C A. S., 2006).
To better purify pellets, EVs can be loaded on sucrose gradient or cushions (Théry C A. S., 2006). Other systems include immunoaffinity isolation (employing magnetic beads conjugated with antibodies directed against EV protein markers) (Clayton A C. J., 2001), nanomembrane ultrafiltration concentrator (Cheruvanky A, 2007).
Several companies developed kits to isolate EXOs or to distinguish different
EV subpopulations. The most used kits are ExoQuickTM from System
Biosciences and “Total Exosome Isolation” from Invitrogen. Moreover
Bioo Scientific Company developed the ExoMirTM Plus kit that uses filters
with pores of different diameters and allows to directly isolate RNA from cells, ABs, MVs and EXOs, without centrifugation steps.
However, it is important to state that, since vesicles are heterogeneous, there is no system able to accurately separate a specific type. The isolation efficiency depends on the shape and viscosity of solution, as well as on temperature, centrifugation time and the rotor type used for the centrifugation (van der Pol E B. A., 2012). Furthermore, isolation methods are based on size, sedimentation, density, and surface molecules, but there is no consensus about these specific characteristics for each subpopulation of extracellular vesicles. For example MV density is unknown, and there is no agreement on specific EXO markers that are able to distinguish EXOs from MVs (Théry C., 2009).
For these reasons there is a need to develop a standardized method to distinguish EV types (Tauro BJ, 2012), (Yamada T, 2012), (Taylor DD Z. W.-T., 2011).
Because of all these limits, a combination of different methods has been suggested. Due to their small size, it is not possible to use optical methods to visualize EXOs as well as MVs and ABs. They can only be directly visualized by electron microscopy (TEM). To date, TEM is considered the
12
gold standard for vesicles size determination, but the procedures used to obtain the pellet (centrifugation, dehydration, fixation) could alter EV morphology (György B S. T., 2011). Electron microscopy is the only method that shows the presence of different subpopulations of extracellular vesicles (Lässer C E. M., 2012). Thanks to other techniques such as Cryo-EM (Tatischeff I, 2012), scanning electron microscopy (Sokolova V, 2011) and atomic force microscopy (György B M. K., 2011), nowadays researchers consider the cup-shaped EXO morphology, a TEM artefact due to fixation process (Théry C A. S., 2006). A very innovative method is Raman tweezers microspectroscopy (RTM) that provides an EXO global composition without using any exogenous label (Tatischeff I, 2012).
Western blot and flow cytometry have also been used. The use of Western blot is limited because no EV-specific protein marker is known. Commonly, CD63, Tsg101 and Alix are used to identify EXOs. The absence of proteins such as calnexin (from endoplasmic reticulum) is used as a negative control because it indicates no contamination by EVs from endoplasmic reticulum (Théry C A. S., 2006), (Lässer C E. M., 2012).
Probably the most used technique is flow cytometry. It is very useful for high-throughput EV quantification and multiparameters characterization (van der Vlist EJ, 2012), but many flow cytometers are not able to analyse EVs due to their lower detection limit of 300-500 nm (Freyssinet JM, 2010) (Lacroix R., 2010). Often, to overcome this limit, authors bind EXOs to antibody-coated beads before flow cytometry. The antibody choice depends on EXO origins but antibodies able to recognize EXO common markers are often used (i.e. anti-CD63) (Lässer C E. M., 2012).
Other very innovative systems are dynamic light scatter (DLS) and nanoparticle tracking analysis (NTA). They allow EV size determination through Brownian motion (van der Vlist EJ, 2012), (Tatischeff I, 2012), (Sokolova V, 2011). Even if several authors have favourably valuated these new techniques (van der Pol E H. A., 2010), (Filipe V, 2010), others feel that quantification of an EV pool of heterogeneous size is not precise and
only few parameters can be analysed at the same time (van der Vlist EJ, 2012).
There is an increased interest to analyse RNAs in subpopulations of extracellular vesicles because the EXO RNA differs from cellular RNA and probably, from that included in EVs. This characteristic may allow to distinguish different EV subpopulations and to evaluate contamination from different vesicles in a specific pellet. Using capillary electrophoresis, cells show two prominent RNA peaks corresponding to 18S and 28S rRNA subunits whereas EXOs lack prominent ribosomal RNA peaks and are enriched by smaller RNAs (Valadi H, 2007) (Lässer C, 2013).
1.4 Extracellular vesicles: medical implications and
therapeutic/diagnostic potential
It is clear that EVs have metabolic effects on their target cells. This property supports their relevance in human disease (Anderson HC, 2010).
Their involvement has been shown in ostheoarthritis (Ali SY, 1983), gastric
ulcers and bacterial infection (Nowotny A, 1982), (Bhatnagar S, 2007),
(Ismail S, 2003), (Kuehn MJ, 2005), atherosclerosis (Tanimura A, 1983), (Hsu HH, 1999), thromboembolic conditions (Chironi GN, 2009), (Cocucci E, 2009), hypertension (Daniel L, 2008) and cancer (Peinado H, 2012), (Taylor DD G.-T. C., 2011), (Zhu W X. W., 2006), (Zhu W H. L., 2012). In atherosclerosis, Hsu et al demonstrated that macrophages and intimal smooth muscle cells release MVs (Tanimura A, 1983), (Hsu HH, 1999). Rautou et al showed that vesicles from atherosclerotic plaques are able to transfer ICAM-1 to endothelial cells. This process induces phosphorylation of extracellular signal regulated kinase 1/2 and supports a role of EVs in atherosclerotic plaque progression (Rautou PE, 2011).
Another well known MV role involves promotion of normal and pathological blood coagulation (Chironi GN, 2009), (Pásztói M, 2009). On their surface, MVs from platelets expose platelet-derived tissue factor and
14
von Willebrand’s factor, the major coagulation initiator (Dvorak HF, 1981). Therefore, EVs represent a surface in the assembly of the complexes involved in the coagulation cascade (Lentz BR., 2003).
MVs have been involved also in thrombotic thrombocytopenic purpura, a disease characterized by thrombi formation in the microcirculation. MVs have procoagulant activity and induce microthrombi formation (Galli M, 1996). It is not surprising that the MV number is increased in plasma from patients with this disease (Galli M, 1996).
An increased amount of MVs is documented also in plasma from patients with chronic renal disease (Faure V, 2006).
EVs role in cancer has been thoroughly studied. Tumour cells are able to constitutively release all types of EV subpopulations (György B S. T., 2011). These EVs are involved in many tumour aspects such as tumour cell survival, growth, host invasion and metastasis. Moreover, they are able to evade host immunity (Valenti R, 2007). Thanks to their capability to transport and release proteases (Ginestra A, 1998), they promote tissue invasion. Local blood coagulation induced by EVs favours tumour cells adhesion to vessels (Dvorak HF, 1981). Tumour growth is supported by MVs expressing epithelial growth factor (Al-Nedawi K M. B., 2009) and tissue factors (Osterud B, 2003). The role of EVs has been studied in glioblastoma (Skog J, 2008), melanoma (Hood JL, 2009) and lung cancer. EXOs from lung cancer are enriched in specific miRNAs such as miR27, miR29, miR21 that are Toll like receptors agonists and are able to increase the inflammatory response. This process induces tumour growth and metastasis (Fabbri M, 2012).
Taverna et al demonstrated that EXOs from chronic myelogenous leukemia cells induce angiogenesis (Taverna S, 2012). Umezu at al studied the ability of exosomal miR-92 from chronic myelogenous leukemia (K562) to induce cell migration and tube formation in human umbilical vein endothelial cells (HUVECs) (Umezu T, 2013).
The investigation of EV role in disease not only can be useful to better understand pathophysiology of diseases, but it also may open new perspectives for both diagnosis and therapy.
Because of EXO specific tropism and their ability to transfer cargo to recipient cells, many researchers focused on EXO (and EVs in general) potential in therapies. EXOs are well tolerated by human body and have a long half-life in circulation (Lai RC, 2013). They can also overcome the blood-brain barrier (van den Goor JM, 2007). These characteristics give them a delivery potential for drugs and genes. For example, Sun et al have been able to load an anti-inflammatory drug (curcumin) in EXOs. They demonstrated that encapsulation of curcumin into exosomes increases its solubility, stability, and bioavailability (Sun D, 2010).
Many studies dealt with genetic material delivery using EXOs: Ohno et al demonstrated that EXOs are able to release the anti tumour miR-let-7a to breast cancer cells that express EGFR (Ohno S, 2013).
Other therapeutic EV applications derive from their ability to induce immune response against tumour. Maheveni et al demonstrated the ability of EXOs from melanoma and glioma cells to induce immune response and improve mice survival (Mahaweni NM, 2013). Other research groups used EXOs to treat malaria (Martin-Jaular L, 2011) or AIDS patients (Nanjundappa RH, 2011). Two clinical trials are ongoing (Escudier B, 2005), (Morse MA, 2005).
However, many challenges need to be dealt with, in particular the best technique to load EVs with drugs and how to target the cargo (Borges FT, 2013).
EVs are also considered potential biomarkers for disease diagnosis. Because EV protein marker and nucleic acid content reflects the nature and state of their parental cells, EVs are considered a precious source of information (Corrado C, 2013). For example Noerholm et al demonstrated that serum microvesicle RNA from patients with glioblastoma multiforme has significantly down-regulated levels of RNAs coding for ribosome
16
production, compared to normal healthy controls (Noerholm M, 2012). An
increase of claudin-containig EXOs in blood is associated with ovaric cancer (Li J S.-B. C.-T., 2009). A mutant transcript of EGFR has been observed in plasma EXOs from glioblastoma patients (Skog J, 2008).
All these possible applications require improvement in isolation and detection methods.
1.5 Extracellular vesicles from blood samples
Different subpopulations of extracellular vesicles have been reported in blood. Sometimes authors refer to blood EVs as microparticles (MPs) or cellular membrane microparticles. This term is not fully descriptive, but is often used (Freyssinet LM., 2003).
Many studies documented the MP number variation in different pathologies and support their use in diagnostics. It is clear that MP release is a well controlled biological process. It has been demonstrated that platelets vesiculate in response to shear stress (Miyazaki Y, 1996) and storage (Bode AP, 1991). Combes et al demonstrated that a dramatic increase of MPs from platelets was observed when TNF-α promoting proapoptotic pathway was induced (Hamilton KK, 1990).
1.5.1 Pre-analytical challenges
Aiming to use MP analysis in diagnosis, pre-analytic variables need to be considered.
Pre-analytic factors have not been extensively studied in literature. The MP release, especially from erythrocytes and platelets, is strongly sensitive to environmental factors. For this reason, all steps, from blood collection until analysis, need to be standardized. The variables that need to be considered are: the diameter of needle used for sample collection, way of collection (vacutainer, syringe, tube) and type of anticoagulant, storage temperature,
freeze-thaw cycles and analytic protocol (Simak J, 2006), (György B S. T., 2011). Simak and Gelderman suggested that time between collection and isolation should be as short as possible. In that period, blood should be maintained at room temperature with gentle agitation (Simak J, 2006). Rubin et al demonstrated that erythrocyte EV concentration changes depending on agitation, storage time and temperature (Rubin O, 2010). Moreover, the number of Annexin V-positive MPs increases after several freeze-thaw steps in platelet-rich plasma (Connor DE, 2010).
A crucial step in the centrifugation is represented by platelet depletion. MP lost and the induction of MP release from platelets and erythrocytes could depend on centrifugation protocol (Simak J, 2006).
Shah et al demonstrated that just two centrifugation steps yield a high number of MPs as compared with a three steps centrifugation protocol. On the other hand, needle diameter does not seem to affect MP number.
Citrate is generally used as anticoagulant. However, Shah et al showed that high levels of platelet- and erythrocyte-derived MPs were detected using heparin and Phe-Pro-Arg-chloromethylketone as anticoagulants as compared to citric acid-sodium citrate dextrose and sodium citrate (Shah MD, 2008).
It is not often possible to process samples immediately after collection. Storage could create artefacts. Shah et al demonstrated a reduced number of MPs that are positive for AnnexinV/tissue factor after storage. On the other hand, the storage at -70 °C of platelet-free plasma for a couple of weeks does not influence MP analysis. A quick cycle of freeze-thaw is suggested because the prolonged incubation of samples at 37 °C could lead to deterioration of MPs and antigen loss (Shah MD, 2008).
Generally, each laboratory develops its own assay to study MPs but different protocols of extraction, antibodies, and their clones have a dramatic impact on the results of MP analysis. Standardized procedures need to be implemented.
18
1.5.2 Methods of EV analysis in blood
A lot of different methodological approaches have been used to analyse MPs from blood. Two methods are mostly used: 1) microparticle affinity assay and 2) flow cytometry.
The first one is an ELISA assay based on antibodies able to recognize MP specific protein markers. A particular affinity assay uses Annexin V in
presence of Ca2+ to recognize only MPs that are positive to
phosphatidylserine (Simak J, 2006). This is a robust method, easy to use in the clinical setting and allows the analysis of a high number of samples at low cost. However, it does not allow MP quantification. Only “quality” information is obtained, no information about size and granularity. Furthermore, the MP positivity to phosphatidylserine is under discussion. Although it has been used as a typical MP marker, recent studies suggest the presence of Annexin V-negative MPs. Connor et al demonstrated that more than 80% of platelet-derived MPs in blood are Annexin V-negative (Connor DE, 2010).
Flow cytometry (FACS) is the most common used approach to MP analysis, although the commonly used instruments cannot analyse MPs with a size less than 300-500 nm (Freyssinet JM, 2010). It allows the rapid analysis of a large number of MPs and provides information about size and granularity. Using labelled antibodies to recognize specific MP antigens, it can distinguish MPs shed from different cellular populations (Shah MD, 2008). However, results should be interpreted carefully. György et al demonstrated that during MP flow cytometry acquisition, immune complexes are formed and may be detected. Furthermore, when indirect labelling is used, they showed that primary and secondary antibodies form immunocomplexes detected in the MP gate and may hamper interpretation. To avoid immunocomplex formation these authors suggest to use direct immunolabelling (György B M. K., 2011).
The use of FACS needs instrument calibration before MP analysis. Size beads of different diameters may be used to evaluate MP size (Simak J,
2006). Fluorescent beads of standardized size are produced by different companies (Becton Dickinson, Sigma, BioCytex). Generally, three bead diameters are used and MP gate is chosen accordingly (Robert S, 2009). FACS allows quantification of MPs that are positive for specific protein markers. Two methods are generally used: 1) the flow rate method is based on the number of MPs detected in a settled time (Nantakomol D, 2008); the analysis of biological samples with different viscosities is unfeasible
(Orozco AF, 2010); 2) TruCountTM tubes (Becton Dickinson) contain a
lyophilized pellet that dissolves during sample preparation releasing a known number of fluorescent beads, that allow calculation of the absolute MP number.
The TruCountTM tubesmajor benefit is that the amount of labelled-beads is
not introduced by the operator, eliminating a possible technical error. The absolute MP number is calculated from the number of events in MP and
TruCountTM bead gate, total number of TruCountTM beads in the tube and
the volume where the sample and beads have been re-suspended (Shet AS, 2003), (Jayachandran M, 2009). It is the most thorough system to analyse the absolute MP number. On the other hand, it could be expensive depending on the sample number (Orozco AF, 2010). Flow cytometry is the best candidate to be considered as the “gold standard” for MP analysis (Gelderman MP, 2008).
1.6 Erythropoiesis and erythroid progenitor markers
The hematopoietic system ensures the production of the different cell types that compose the human blood. The continuous blood cell production is guaranteed by pluripotent stem cells (HSC) that are progressively committed to multipotent progenitors and evolve to committed progenitors (Testa U., 2004).
In particular, erythropoiesis is a multistep process that leads HSC to differentiate in erythrocytes, cells specialized for oxygen transport.
20
The first step is the differentiation of HSC in hematopoietic progenitors named CFU-GEMM. Subsequently, they evolve to committed erythroid
progenitors, i.e. erythroid burst-forming units (BFU-e) and erythroid
colony-forming units (CFU-e). Then erythroid precursors with a characteristic morphology are formed. The first identifiable erythroid precursor is the proerythroblast, a cell characterized by a large nucleus, basophilic nucleoli and cytoplasm. Through several cell divisions they evolve first to the basophilic erythroblast, then to the polychromatophilic erythroblast and to the orthocromatic erythroblast. During these steps size is reduced, chromatin is condensed and sensitivity to erythropoietin (EPO) appears because EPO receptors are expressed (Testa U., 2004). Finally, the orthocromatic erythroblast loses its nucleus and becomes a reticulocyte, a non-nucleated cell with remnants of Golgi and endoplasmatic reticulum compartments.
After a brief stay in bone marrow (R1), it passes through the endothelial wall of marrow sinuses and reaches blood circulation (R2) (Videl M., 2010). Here it becomes an erythrocyte, a biconcave disk without nucleus and organelles that contains mostly haemoglobin.
Erythroid differentiation is based on a well regulated transcriptional process which result in the different expression of specific antigens (Santos PM, 2011). These antigens can be used to identify differentiation stages and to distinguish the different committed precursors. FACS analysis allows to evaluate many antigens at the same time (Fig. 5).
Fig. 5: Maturation during erythropoiesis. The most representative markers
expressed during erythroid maturation steps are indicated. The intensity colour variation corresponds to expression levels.
CD34 is a marker of activated early progenitors (HSC and CFU-GEMM) and committed erythroid progenitors (BFU-e and CFU-e) (Furness SG, 2006). Being a marker expressed only by activated progenitors its principal function is to promote HSC proliferation due to its anti-adhesion property. CD34 expression levels slowly decrease and it is absent in proerythroblasts. BFU-e and CFU-e express also CD117 (proto-oncogene c-Kit) (Andre C, 1997). CD117 expression decreases during development. It is still
22
expressed, at low levels, by proerythroblasts. Proerythroblasts are, also, characterized by CD105 and CD71. The first one is member of TGFβ receptor complex involved in TGFβ modulation signalling as well as cytoskeletal organization (Sanz-Rodriguez F, 2004). CD105 is expressed also by basophilic erythroblasts, but at low levels. On the other hand CD71 levels increase from proerythroblast to orthocromatic erythroblast when it is expelled by reticulocytes through vesicle formation (Fajtova M, 2011). CD71 is the cluster differentiation name for transferrin receptor protein (TFR), a membrane glycoprotein whose function is to mediate cellular uptake of iron from transferrin. The highest amount of transferrin receptor is found on erythroid cells because they need to acquire iron for haemoglobin synthesis. It is released from reticulocytes during their maturation in erythrocytes by EXO secretion (Ponka P, 1999).
The last marker to be expressed is CD235a (glycophorin A). It appears at the proerythroblast stage and its expression increases through maturation being the highest in erythrocytes (Fajtova M, 2011). Glycophorin A is one of the sialoglycoproteins that are expressed on red blood cell membranes. It is the major contributor to the negative surface charge of red blood cells. This negative charge is important for red cells interaction with the vascular endothelium (Griffiths RE, 2012).
Fajitova et al identified antigen CD36 as a marker of late differentiation. It is expressed mostly on basophilic erythroblasts, but also on proerythroblasts, polycromatophilic and orthocromatic erythroblasts. The same authors identified CD38 and CD45 in both preoerythroblasts and basophilic erythroblasts (Fajtova M, 2011) although these are typical markers of immune cells (Jackson DG, 1990), (Brown VK, 1994).
1.6.1 Extracellular vesicles from reticulocytes
During maturation, a remodelling of plasma membrane is observed with reduction of cell volume and surface area (Géminard C d. G., 2002). Autophagy and membrane shedding have been shown to be involved in this
process (Seelig LL., 1972), (Simpson CF, 1968). More recently, Johnstone
et al demonstrated that vesicle secretion is the principal process (Johnstone
RM M. A., 1991), (Pan BT J. R., 1983). Johnstone and Stahl demonstrated that TFR shedding is associated to small vesicle release in reticulocytes maturation (Pan BT J. R., 1983), (Harding C, 1983). It now is apparent that EXO secretion during reticulocyte maturation is an integral part of the red cell development program (Blanc L V. M., 2010). Considering that EXOs have a diameter around of 60 nm, each reticulocyte releases between 800 to
2600 EXOs equivalent to 1014 EXOs released every day in circulation
(Blanc L D. G.-B., 2005).
TFR is, of course, the most studied protein released in EXOs. During reticulocyte maturation this receptor is internalized into the cells through coated pits. Then it can be recycled to plasma membrane or segregated in multivesicular endosomes (Fig. 6). Multivesicular bodies evolve and release TFR positive EXOs (Géminard C d. G., 2002). Huebers et al demonstrated that the concentration of TFR reflects erythropoiesis rate. For this reason patients affected by erythroid hypoplasia induced by marrow-suppressive drugs showed a low amount of TFR as compared with controls (Huebers HA, 1990). Furthermore, EXOs released by reticulocytes are enriched with lipid and proteic markers. Beside lipid rafts (de Gassart A, 2003), other molecules are released with EXOs, including AChE, a glycosylphosphatic-dylinisitol-anchored protein (Johnstone RM A. M., 1987), as well as CD55 and CD59, whose loss has been observed in patients with paroxysmal nocturnal hemoglobinuria (Ware RE, 1995). Other EXO markers, such as hsc70 and Alix, have been observed in EXOs released from reticulocytes. They follow the TFR fate. Hsc70 has been demonstrated to interact with TFR during proteasome degradation (Géminard C D. G., 2004), whereas Alix interacts with TFR cytosolic domain and with ESCRT machinery involved in multivesicular body formation (von Schwedler UK, 2003).
24
Fig 6: TFR pathway during reticulocyte maturation. Modified from Blanc L et al,
2005.
Exosomal secretion is an integral part of erythropoiesis (Blanc L V. M., 2010). Vesicles could be involved in all passages of erythroid progenitor maturation. Further studies are needed to investigate this exciting possibility and to ascertain whether impairment EV secretion could be involved in pathophysiology of red blood cell disorders.
1.7 Extracellular vesicles released during cellular stress – p53
involvement
Cells are subjected to many different endogenous and exogenous stress types. Many responses have been developed to address each stress type, such as cell cycle arrest, apoptosis, senescence, autophagy (Yu X R. T., 2009).
In the last ten years the role of EVs in the development of adaptive mechanisms against stress conditions has been demonstrated (Kucharzewska P, 2013). Much of what we know about the EV function in stress is gathered from studies focused on cancer. As already described, many authors showed that EVs are involved in tumour progression mechanisms, such as angiogenesis and metastasis (Kucharzewska P, 2013). Furthermore, several studies described cell vesiculation in response to different stress types such as hypoxia (Wysoczynski M, 2009), (Zhang HC, 2012), (King HW, 2012), low PH level (Parolini I, 2009), oxidative stress (Eldh M, 2010), (Hedlund M, 2011), (Zhan R, 2009), thermal stress (Zhan R, 2009), (Clayton A T. A., 2005), (Chen T, 2011), radiation (Wysoczynski M, 2009), shear stress (Miyazaki Y, 1996) and drug effects (Lv LH, 2012). It is well documented that stress conditions on parental cells affect the EV content. For example, Choi and co-workers demonstrated that EVs released by primary cells have a very different protein cargo when compared with EVs shed from metastatic cells (Choi DS, 2012). In hypoxic conditions, the EXO amount shed from carcinoma cells (Park JE, 2010) as well as human and murine lung cancer cell lines (Wysoczynski M, 2009) is increased. These EXOs are enriched with proteins potentially able to modulate tumour microenvironment. In breast cancer cell culture increased amount of EXOs depends on HIF-1α. These EXOs are enriched with miR-210, a short RNA well known to be regulated by hypoxia (King HW, 2012). Mesenchymal stem cells release EVs that are similar to those shed by parental cells, but the majority of them are negative for platelet-derived growth factor receptor (Zhang HC, 2012).
Regarding EV response in low PH conditions, Taraboletti et al demonstrated that EVs containing VEGF were destroyed under acidic pH conditions (a characteristic of the tumour microenvironment). Consequently, VEGF release led to significantly higher stimulation of cell
motility (Taraboletti G, 2006). Moreover, in the same conditions, EVs
released from melanoma cells have a less flexible membrane due to a different lipid composition. They are enriched with ganglioside GM3 and
26
sphyngomyelin. These lipids seem to bestow on EVs a better ability to fuse with plasma membrane of recipient cells (Parolini I, 2009). Eldh et al showed that oxidative stress induce a massive change in mRNA content in EXOs from mast cell lines. Furthermore, EXOs are able to confer resistance against oxidative stress and viability improvement in recipient cells (Eldh M, 2010).
Levine and co-workers have investigated the role of p53, a transcriptional factor activated by a wide variety of stress signals. It acts to restore cellular homeostasis and prevents the accumulation of errors on DNA changes (Levine AJ., 1997). In 2006, Yu et al observed that, after p53 activation, several proteins encoded by genes that are not p53 transcriptional targets, increased in the cell medium of non small cell lung cancer cell line (H460) and they were released through EXOs. They discovered that the p53 role in EXO production is linked to the expression of a p53 gene target: TSAP6 (Yu X H. S., 2006). TSAP6 is involved in proteins transport (Roperch JP, 1998). Two years later, Telerman and collaborators provided the first genetic evidence that exosome formation is a tightly controlled biological process dependent of TSAP6. TSAP6 deficient mice show microcytic anemia (reticulocytes and erythrocyte were smaller with abnormal shape and osmotic fragility). Reticulocytes from these mice could not expel TFR during their maturation (Lespagnol A, 2008). Absence of TSAP6 resulted in a deficiency of EXO formation delaying the maturation of bone marrow erythroblasts and reticulocytes. Another p53 gene target, CHMP4C, is known to be involved in EXO production. It is part of the ESCRT-III protein complex that is essential for endosome formation (Yu X R. T., 2009). However, a p53 independent mechanism has been shown. An accumulation of ceramide, a lipid molecule involved in EXO formation (Trajkovic K, 2008), has been shown in response to different stress types (Nikolova-Karakashian MN, 2010). It could be interesting to evaluate whether stress-induced ceramide accumulation is paralleled by increase EXO production.
1.8 Ribosomal stress: cell proliferation inhibition through
p53-dependent and -independent mechanisms
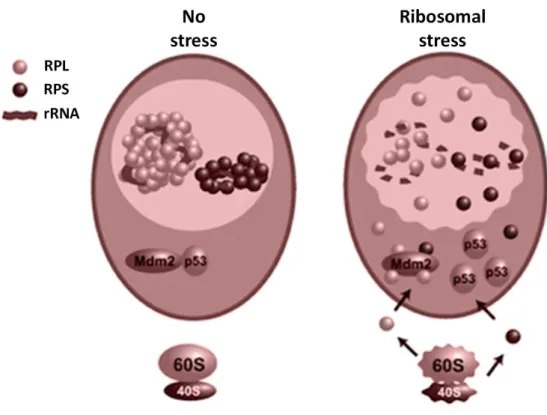
p53 activation is induced by cells exposed to different stress types as UV radiation, heat shock, hypoxia (Horn HF, 2007). Also an aberrant ribosome biogenesis leads to increased p53 levels. This condition is named “ribosomal stress” (or “nucleolar stress”) (Pestov DG, 2001), (Rubbi CP, 2003).
Ribosome biogenesis occurs in the nucleolus and is the result of coordinated steps that include rRNA precursor processing. Briefly, RNA polymerase I is involved in transcription of 47S rRNA precursor. The processing of this precursor generates the mature 18S, 5.8S and 28S rRNA, whereas 5S RNA is transcribed independently. rRNA and ribosomal proteins (RPs) are collected in a specialized cellular compartment: the nucleolus, where rRNA and RPs are assembled to form the large 60S and the small 40S subunits. Finally, the subunits are exported to the cytoplasm (Lempiäinen H, 2009). Perturbation to this complex process includes inadequate rRNA transcription, disruption of rRNA procession or RP imbalance. These abnormalities trigger ribosomal stress followed by p53 activation (Deisenroth C, 2010). p53 activity is regulated by the MDM2 oncoprotein that binds to p53 and targets it to degradation. Under normal condition p53 levels are low because it is constantly degraded through MDM2 interaction. In many stress conditions, the interaction MDM2-p53 is disrupted and p53 levels increase (Olausson KH, 2012).
Several tumour suppressor proteins, such as ARF, have been demonstrated to bind MDM2 and inhibit MDM2-p53 interaction (Zhang Y X. Y., 2001). Several RPs are able to bind MDM2 inducing increased p53 levels. “Free” RPs are available to bind MDM2 as consequence of altered ribosome biogenesis (Zhang Y L. H., 2009) (Fig. 7).
28
Fig. 7: Schematic p53-dependent mechanism induced by ribosomal stress.
Modified from Zhang Y et al, 2009.
Several studies demonstrated that several RPs, such as RPL5 (Dai MS L. H., 2004), RPL11 (Zhang Y W. G., 2003), (Lohrum MA, 2003), (Bhat KP, 2004), RPL23 (Dai MS Z. S., 2004), (Jin A, 2004) and RPS7 (Chen D, 2007) could bind MDM2 and inhibit its E3 ubiquitin ligase function.
However, beside p53-dependent pathways, recently a p53-independent mechanism of cell arrest in response to abnormal ribosome biogenesis has been documented (Donati G M. L., 2012). Firstly discovered in Drosophila (Grewal SS, 2007), it has been better documented in recent years. In 2009, Li at al investigated the role of pescadillo, a protein involved in processing of pre-rRNA molecules. They demonstrated that knockdown of this protein results in cyclin D1 down-regulation and cyclin-dependent kinase inhibitor p27/Kip1 up-regulation (Li J Y. L., 2009).
Furthermore, a PIM1-dependent pathway has been suggested. Iadevaia et al demonstrated that RPs deficiency caused down-regulation of PIM1 expression. Down regulation of RPS19 and other RPs induced PIM1
proteasome degradation. PIM1 is a serine/threonine kinase that reduces the activity of p27/Kip1. PIM1 reduction induces p27/Kip1 stabilization and blocks the cell cycle regardless p53 (Iadevaia V, 2010).
The role of RPL11 in p53-independent mechanisms has been investigated. Inhibiting rRNA transcription, RPL11 protein is “free” and binds MDM2. The result is that E2F-1 protein is not blocked by MDM2 and can induce expression of E2F gene targets that are necessary for the progression through cell cycle (Donati G B. E., 2011). Furthermore, RPL11 together with RPL5 is able to bind c-Myc, a well documented cell proliferation stimulator. The binding of RPL11 to c-Myc induces reduction of c-Myc transcription and c-Myc degradation followed by reduced cell proliferation (Liao JM, 2013).
1.9 Diamond Blackfan Anemia (DBA), a human disease due
to ribosomal stress
Mutations in genes encoding for RPs have been identified as the cause of human genetic diseases. Diamond Blackfan Anemia (DBA) is the first human disease shown to be caused by a defect in ribosomal proteins (Draptchinskaia N, 1999). It is a congenital bone marrow failure syndrome due to a specific defect of the erythroid lineage (Hölzel M, 2010). This haematological disorder is member of a class diseases known as “ribosomophaties”, characterized by genetic anomalies resulting in defective ribosome biogenesis (Raiser DM, 2013). DBA pathogenesis is due to ribosomal stress triggered by an abnormal ribosome biogenesis.
1.9.1 Clinical features and molecular basis
DBA (MIM 105650) is categorized as a congenital bone marrow failure syndrome, presenting during infancy with an incidence of 4-5 cases/one millions live births (Orfali KA, 2004). It is a hypoplastic anemia
30
characterized by other haematological characteristic as macrocytosis, reticulocytopenia, high activity of adenosine deaminase (ADA) in red cells (Lipton JM, 2009). Defective erythropoiesis is revealed by a very low number of erythroid precursors and, functionally, by a reduction of BFU−E progenitor cells in the bone marrow. It shows autosomal dominant transmission (Campagnoli MF G. E., 2004). Proliferative and differentiative activity towards the other lineages is normal.
Beside these haematological characteristics, half of patients show physical abnormalies as short stature, thumb abnormalies, heart defect, craniofacial abnormalies and cleaft lip and palate (Lipton JM, 2009).
Standard therapy consists in steroids; about 40% of patients respond to this therapy. The non-responsive patients are treated with red blood cell transfusion, but stem cell transplantation is the only definitive treatment (Vlachos A M. E., 2010). Twenty per cent of patients develop a clinical remission, but the biological reasons are unknown (Quarello P, 2010). DBA shows an autosomal dominant inheritance and all mutated genes have heterozygous mutations (Ball S., 2011). RPS19 is the first DBA gene identified (Draptchinskaia N, 1999). Mutations in RPS19 have been found in 25% of patients (Campagnoli MF R. U., 2008). Ten genes encoding ribosomal proteins have been found mutated in DBA patients, i.e. RPS19, RPS24, RPS17, RPL5, RPL11, RPS7, RPL35a, RPS26, RPS10, RPL26 (Draptchinskaia N, 1999), (Gazda HT G. A.-L., 2006), (Cmejla R, 2007), (Gazda HT S. M., 2008), (Farrar JE, 2008), (Doherty L, 2010). The most frequently mutated genes, after RPS19, are RPL5 and RPL11 that account for 10% of DBA patients (Gazda HT G. A.-L., 2006). About 60% of patients show mutations in genes encoding ribosomal proteins. Extra-ribosomal factors have been speculated to have a role in those patients that are mutation-negative for RP genes. GATA-1, encoding for a hematopoietic transcription factor has been found mutated in four patients with DBA (Sankaran VG, 2012), (Parrella S, 2014).
Several studies in Drosophila, Xenopus, Zebrafish and mouse showed that p53 activation is involved in DBA development (Kongsuwan K, 1985),
(Miller L, 1970), (Danilova N, 2008), (McGowan KA, 2008). As already said, the insufficient RP production could lead to excess of other RPs that can interact with MDM2 inducing cell cycle arrest (Zhang Y L. H., 2009). However, the role of p53 in DBA pathogenesis is still under discussion. Also independent mechanisms have been suggested. Both p53-dependent and -inp53-dependent mechanisms may cooperate and induce cell cycle arrest with a proapoptotic phenotype in erythroid progenitors.
1.9.2 Global gene expression in p53 null-cell models of DBA suggests activation of p53-independent pathways (Aspesi et al, submitted to Gene)
Defects in ribosome synthesis have been shown to activate p53 thereby providing a rationale for the pro-apoptotic phenotype of erythroid progenitor in DBA (Draptchinskaia N, 1999), (Vlachos A B. S., 2008). p53 inhibition has been demonstrated to attenuate the proapoptotic phenotypes in DBA models (Drosophila, Xenopus, zebrafish and mouse) (Kongsuwan K, 1985), (Miller L, 1970), (Danilova N, 2008), (McGowan KA, 2008). However, p53 inhibitors cannot be used in therapy because of their risk of cancer development. We considered that identification of p53-independent pathways could suggest more realistic treatments for DBA. To this aim, we analysed the gene expression changes in three p53-null cell models of DBA as compared with the appropriate controls. Using a microarray approach (Affimetrix GeneChip Human Genome U133A) followed by sophisticated statistical analysis (ranking-PCA), a set of dysregulated genes that are common to the three DBA cell models has been identified. The Gene Onthology classification showed an enrichment of genes involved in amino acid metabolism, negative regulation of cell proliferation, apoptosis and cell redox homeostasis whereas PANTHER Biological annotation identified genes involved in haematopoiesis and amino acid/steroid metabolism. Our results demonstrated that gene expression is altered in DBA cell models in agreement with the proapoptotic phenotype observed in DBA. The
32 manuscript is attached.
58
In the last years, the field of extracellular vesicles (EVs) has been characterized by an increasing interest due to their possible use as biomarkers for different diseases and their therapeutic potential.
However, a great challenge still needs to be solved, i.e. the standardization of methods used to separate EV subpopulations. It is crucial to distinguish the different EV subpopulations to avoid cross contamination that could lead to data misinterpretation.
Therefore, the first aim of this thesis has been to analyse different isolation methods to obtain the following objectives:
1. To evaluate the potential of centrifugation-based protocols to separate apoptotic bodies, microvesicles and exosomes and characterize them by RNA profile analysis, electron microscopy and flow cytometry.
2. To analyse the effect of a filtration step on exosome pellet purity, looking at the RNA profile of the isolated exosomal fractions.
3. To compare the different EV populations obtained using protocols detailed at points 1 and 2 and looking at their RNA profiles.
A significant numbers of studies focused on the role of EVs in response to biological stress (hypoxic conditions, low pH level, oxidative stress, thermal stress, radiation, shear stress and drugs effect). However, nobody has analysed EV release during ribosomal stress. Diamond Blackfan Anemia (DBA) is a disease due to abnormal ribosome biogenesis that induces apoptosis in erythroid progenitors. DBA research is hampered by the inability to study erythroid progenitors. The characterization and quantitative analysis of EVs from erythroid progenitors could be useful to overcome this limitation. The following objectives were attempted:
4. To investigate the miRNAs pattern in EVs shed by a DBA cell model.
5. To characterize and quantify microparticles from erythroid progenitors released in blood of patients with Diamond Blackfan Anemia.