SCUOLA DI SCIENZE
Corso di laurea magistrale in Biologia Marina
SUSTAINABILITY AND VALORIZATION OF SMALL PELAGICS:
IMPLEMENTATION OF A SHARK-FREE ECO-LABEL FOR PELAGIC TRAWLING FISHERIES IN THE ADRIATIC SEA
Tesi di laurea in Economia e Politica della Pesca
Relatore Presentata da Dr. Luca Mulazzani Laura Piredda
Correlatore Dr. Sara Segati Dr. Simone D’Acunto
2
INDEX
1. Introduction: General characteristics of the Adriatic Sea ... 4
1.1 Negative aspects of fishing in the northern Adriatic Sea ... 5
1.2 The PRIZEFISH Project ... 5
2. Purpose of the study ... 6
3. By-catch and shark meat consumption in Italy ... 7
3.1 General ecological and biological characteristics of sharks ... 8
4. Ecosystem services ... 10
4.1 Classification of the Millennium Ecosystem Assessment ... 10
4.2 Anthropocentrism and Biocentrism ... 10
4.3 Sharks and ecotourism ... 11
4.4 Negative perception regarding sharks ... 12
4.5 Multifuncionality in fisheries ... 12
5. Eco-labels ... 14
5.1 Knowledge of eco-labels ... 14
5.2 The eco-labels considered for the survey ... 15
6. Contingent Valuation Method ... 17
6.1 Contingent Valuation Method surveys typologies ... 18
6.2 Negative aspects of the Contingent Valuation Method ... 18
7. Materials and methods ... 20
7.1 Consumer questionnaire design ... 20
7.2 Fishmonger and supermarket questionnaire design... 22
7.3 Wholesaler questionnaire design ... 23
7.4 Consumers survey elaboration... 23
7.5 Qualitative analyses ... 26
7.6 Sharks by-catch data collection ... 27
7.7 Economic advantage per vessel ... 28
8. Results and discussions ... 30
8.1 Qualitative analyses results: Frequency purchase of fresh fish products ... 30
8.2 Socio-demographic variables ... 30
8.3 Main fish aspects ... 31
3
8.5 EMBC scale results ... 33
8.6 Estimation of the willingness to pay ... 33
8.7 Sales managers questionnaires results ... 35
8.7.1 Supermarket of Pavullo nel Frignano ... 35
8.7.2 Supermarket of Ravenna ... 35
8.7.3 Fishmonger of Pavullo nel Frignano ... 36
8.7.4 Fishmonger of Ravenna. ... 36
8.8 Wholesaler questionnaire results ... 37
8.9 Linear regression results ... 37
8.10 By-catch value results for the pair of vessels ... 39
8.11 Economic advantage per vessel results ... 40
9. Conclusions ... 41
10. Acknowledgements...43
4
1. Introduction: General characteristics of the Adriatic Sea
The Adriatic Sea is a fraction of the Mediterranean Sea, situated between the Italian and Balkan Peninsulas. It borders six countries: Italy, Slovenia, Croatia, Bosnia-Herzegovina, Montenegro and Albania. Geo-morphological characteristics, along with political and economic aspects, have led to the implementation of two Geographical Sub-Areas that divide the Adriatic Sea: GSA 17 and GSA 18. The GSA 17 covers the Northern and Central Adriatic Sea up to the Gargano-Kotor junction, where the water is shallow and depth constantly increases from north to south, but generally does not exceed 100 meters. The Pomo pit, in the middle of the Adriatic basin, is the only area where depth can reach 200-260 meters. Muddy and sandy sediments of different granulometry and composition cover the Italian seabed, while the Po river has an important control on salinity, temperature and primary production (Barausse et al., 2014). On the other hand, the Croatian coast is characterized by rocky articulations that include islands, bays and canals. The GSA 18 is connected to the Northern Ionian Sea through the Otranto Channel and the bathymetry of the Southern Adriatic Sea reaches almost 1233 meters (Bombace et al., 2011; Barausse et al., 2014; MIPAAF, 2019).
The Mediterranean Sea is characterized by multi-specific stock and the Adriatic Sea constitutes one of the most important fishing grounds where almost every target species can be considered shared among countries. Therefore, the institution of partnerships is thus necessary in order to improve a better fishery management (Bonanomi et al., 2018). One of the main target resource in the Adriatic Sea is small pelagic fish, which include mainly anchovies, Engraulis encrasicolus (Linnaeus, 1758) and sardines, Sardina philcardus (Walbaum, 1792).
According to CNR-ISMAR, small pelagics represent 41 % of total Adriatic catches. Pelagic pair trawling has been introduced for the first time by the northern Adriatic fishers as the main fishing gear for small pelagic fish. According to the (EC) No 1967/2006, “trawl nets means nets which are actively towed by the main vessel engine and consisting of a cone- or pyramid-shaped body (as trawl body) closed at the back by a cod-end and which can extend at the opening by the wings or can be mounted on a rigid frame. Horizontal opening is either obtained by otter boards or provided by a beam or frame of variable shape and size. Such nets can be towed either on the bottom (bottom trawl net) or in midwater (pelagic trawl net)”.
5
1.1 Negative aspects of fishing in the northern Adriatic Sea
The Northern-Central Adriatic is one of the most overfished basins of the Mediterranean Sea, because of its important productivity and the high marine resources demand. Unfortunately, pelagic trawling does not only catch target species, but also different elasmobranch, like sharks and rays, which end up caught in the nets. Those species represent the so-called by-catch; therefore, it is important to understand the impact of fisheries on elasmobranch populations for a better management.
Humans rely on biodiversity in many different ways and anthropogenic activity is rapidly impoverishing natural resources. As human population is growing and the demand for marine resources supplies, too, sustainable fishing is needed in order to ensure marine resources recovery in a long-term period, in this way future generations will be able to benefit from it, too (Bonanomi et al., 2018). Environmental concern is not a new topic and since the late 1960s, people’s awareness regarding environment has raised considerably. Once the myriad impacts on the environment were identified, different steps towards eco-friendly approaches have been introduced. Among these, eco-labels and certifications took an important role in fish trade, as they give an added value to a more sustainable product (Galarragua, 2002).
1.2 The PRIZEFISH Project
This study is included in the framework of the project “PRIZEFISH - Piloting of eco-innovative fishery supply-chains to market added-value Adriatic fish products” funded by the Call 2014 - 2020 Interreg V-A Italy - Croatia CBC Programme. The PRIZEFISH project has the purpose of ameliorating Adriatic fishery resources management among the Italian and Croatian region through eco-innovative fishery supply-chains. The fulfilment of a medium-term sustainability strategy based on solid scientific and socio-economic research and innovative actions to meet small-scale fisheries amelioration is needed.
The main challenge is to collaborate with several parties, such as fishers, in order to improve territorial socio-economic status and to deal with overexploitation of Adriatic Sea resources for a long-term benefit. The PRIZEFISH project aims to connect scientists, researchers and experts in marine fishery and economic sciences who work together in order to achieve environmental and sustainability certification, conferring an added value through eco-labels to Adriatic fish products.
6
2. Purpose of the study
Small pelagic fish is one of the most consumed products in the Adriatic Sea and has great economic and culinary value. This study investigates the results of a contingent valuation method, conducted in two fishmongers and two supermarkets, carried out in order to determine consumers’ willingness to pay for a “shark-free” certified product compared to the ordinary small pelagic fish product. In particular, the information collected for this survey concerns consumers’ choice for the purchase of sustainable commodities, their personal interest and level of knowledge of eco-labels. It is important to understand the power that these eco-labels have on consumers’ selection of products. Extra surveys addressed to sales manager of the respective stores have been accomplished.
This study aims to appraise a certain price that consumers would pay for a certified small pelagic fish product. The improvement of consumers’ interest for eco-certified products is a goal in order to raise awareness for the conservation of the Adriatic Sea and its fish resources. It is essential to meet consumers and fishers needs and at the same time preserve marine ecosystems and species.
The following paragraphs are developed along these lines. Paragraph 3 considers the state of art of by-catch and the role of Italy regarding shark meat consumption. Paragraph 4 defines the concept of ecosystem services and multifuncionality in fisheries, introducing the anthropocentric concept, focusing on the role and presence of species, like sharks, as a benefit for humans, from an economic point of view. Paragraph 5 introduces the world of eco-labels and their power to improve sustainability in marine ecosystems and fish resources. Paragraph 6 describes the positive and negative aspects of the Contingent Valuation Method. Paragraph 7 contains the materials and methods of this study to define the willingness of consumers to pay for a shark-free eco-labelled product, the sales managers concern and the economic estimation of the annual amount of money that the fishers would not gain out of the by-catch. Paragraph 8 justifies the results and discussion of the survey, analyzing the positive and negative aspects. Paragraph 9 concludes the study,advancing the possible solutions.
7
3. By-catch and shark meat consumption in Italy
There is a plethora of studies concerning shark populations degradation caused by commercial fishing activity. This unsustainable situation is no longer tolerable, because is now well-known the role of sharks as key species in marine ecosystems and the critical effects their reduction would cause directly to the trophic chain, but also to human kind (Ferretti et al., 2008; Clua et al., 2011). The Mediterranean Sea is a laboratory of life and overfishing, in addition to climate change and pollution, is one of the main threats and anthropogenic activity has a heavy influence on marine habitats and populations. Many shark species are extremely affected by overfishing that causes the decrement of large shark populations. Sharks are exploited all over the world, both as target species (for their fins, liver, cartilage and meat) and as an accidental catch of fisheries interested in other valuable species.
Since there is a plethora of definitions for “discards” and “by-catch”, for this study the following terms have been considered:
• By-catch: catch of species, which is not the targeted species;
• Discards: catch, both targeted species and by-catch, thrown back into the sea (EUMOFA, 2020).
The accidental capture of non-target species during fishing activity, or by-catch, is a source of mortality that inhibits the survival of several shark species all around the world. While by-catch may be sold, it may also be useless, and ultimately thrown back into the sea, most of the times dead, for a variety of regulatory and economic reasons (Davies et al., 2009). Italy is one of the world’s top consumers of shark meat and it positioned itself as third largest importer in the world by volume and second largest importer of sharks by value. The imports are represented mainly by larger shark species from European suppliers. Italy is not a great exporter of shark meat and since 1990s, domestic production of shark species declined significantly.
According to the State of the global market for shark products by FAO (2015): “from 2000 to 2011, Italy imported an average of 11526 tons of shark meat per year, equivalent to 11 percent of the world total volume. These imports were worth USD 34.8 million annually on average or 14 percent of the world total”. Why do people eat shark meat? Consumers’ demand for shark meat is growing and this is related to the fact that shark meat is a source of protein and, from an economic point of view, is a suitable product for several families.
8
3.1 General ecological and biological characteristics of sharks
Sharks are the so-called K-selected species, which means that they reach sexual maturity very late, have low reproductive rates, long gestation and produce few offspring. Their sensitive biological characteristics, combined with by-catch activity, limit the ability of these species to recover from heavy fishing pressure (Gallagher, 2011; Bargione et al., 2019) and make them one of the most threatened marine animals on Earth (Bonanomi et al., 2018). In the northern Adriatic Sea, most of the times, landings include Mustelus spp and Squalus spp and according to the International Union for the Conservation of Nature Red List (IUCN), at the fish market in Chioggia, 25 % of male and 50-75 % of female sharks are landed before reaching sexual maturity.
The spiny dogfish, Squalus acanthias (Linnaeus, 1758), is one of the most valuable commercial species consumed by humans and is globally listed as Vulnerable by the IUCN classification and as Endangered in the Mediterranean Sea (Bargione et al., 2019). The common smooth-hound, Mustelus mustelus (Linnaeus, 1758), is globally classified as Vulnerable and as Endangered in the Mediterranean Sea. It has been estimated that 70 % of male individuals and 90% of female individuals are sexually immature. Numerous studies show sharks decline in Adriatic Sea. The Northern Adriatic has faced a great decrease of shark populations and unfortunately, there is still a lack of information about by-catch data regarding sharks (Bonanomi et al., 2018). As stated by Ferretti et al., (2013), is not easy to explain, evaluating the effects of fishing, how fish communities change in marine ecosystems.
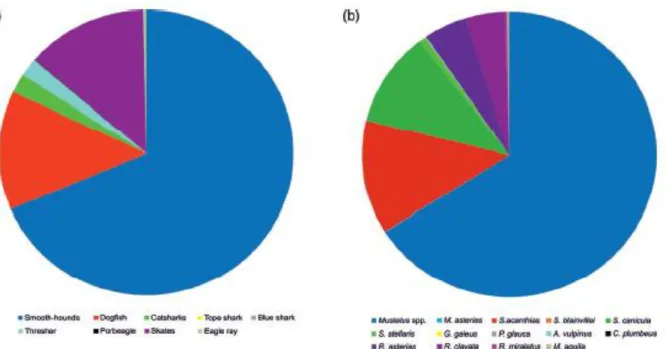
Several experiments at large scale are needed, such as the study of gradual variation of natural and anthropogenic events. A study by Barausse et al., (2014) analyses landings records of the years 1997-2012 in the Adriatic Sea, in order to estimate spatial and temporal changes in elasmobranchs community. Fishery data from fish market of Chioggia were collected to examine the impact of fishing pressure and other factors on elasmobranchs in the northern Adriatic Sea. The results represented in Figure 1 confirm elasmobranchs decrement, caused by high fishing effort. Landings of elasmobranchs conducted during the years are mostly represented by Mustelus spp. (colored in dark blue), which presence goes from 61.4 % to 68.8 % of the total landings. Shark conservation is neither easy nor cheap and better enforcement, assessment and conservations policy in fishery management is necessary.
9
Figure 1. (a) Official fish market statistics, biomass data regarding the composition of elasmobranchs landings
10
4. Ecosystem services
Ecosystems can provide different benefits, both consumptive and non-consumptive, that human kind can enjoy. The concept of ecosystem services (ESs), described for the first time by the Millennium Ecosystem Assessment (2005), has gone through different definitions. They constitute direct and indirect welfare to human kind, improving the quality of life. Ecosystems function as a result of amazing and complex relationships among species that are a very important ingredient concerning ecosystem valuation. Ecosystem services can be classified into four categories.
4.1 Classification of the Millennium Ecosystem Assessment
Supporting, such as primary production, soil formation and nutrient cycling;
Provisioning, including all the products deriving from nature, such as food, fresh water, fiber and genetic resources;
Regulating, including ecosystemic functions as climate regulation, water regulation, disease regulation and pollination;
Culture, which includes all the non-materials goods, such as ecotourism, recreation, spiritual activities.
4.2 Anthropocentrism and Biocentrism
The disappearance of multiple species leads to a domino collapse of all the benefits humans can gain from them. One of the main difficulties that governments, scientists, researchers and non-profit organizations are facing is to raise awareness regarding ecosystem services and long-term conservation to society. Giving monetary value to ecosystem services allows species to have an economic value, too. It is not easy to confer to species an economic value, because they play distinct roles in different ecosystems. Hence, species are treated with different degrees of value, based on their purpose. Those differences may create multiple concerns. One is that species, for the fact that they exist, have an intrinsic, priceless value and contribute to the flourishing of biodiversity.Nature and ecosystems are considered a treasure to preserve simply because they exist (Schröter et al., 2014; Gascon et al., 2015).
11
Anthropocentrism, associated to environmental ethics, assumes that everything is related only to human kind and that all other living beings are means to satisfy human needs (Kopnina et al., 2018). There are different perspectives for what concerns conservation and ecosystem services. On one hand, several critiques have been associated to ecosystem services; in fact, they have been highly discussed for their anthropocentric connotation that is opposed to the concept of the intrinsic value of nature. On the other hand, ecosystem services are not meant to undermine the biocentric concept of nature, but rather to help protect and preserve nature and biodiversity adding an economic value. There is this belief that nature has other properties, aside provision, to make people feel good, mentally and physically. This concept is considered anthropocentric, even if it contains this shade of pure and intrinsic value of nature.
4.3 Sharks and ecotourism
Fish are both important and valuable as food supply and for tourism. Sharks are mainly consumed for their fins and meat, but many people travel the world to go cage diving with great white sharks, Carcharodon carcharias (Linnaeus, 1758) in South Africa or snorkeling with the whale shark, Rhincodon typus (Smith, 1828) in Egypt. The industry of ecotourism improved the growth of economic value and the collaboration among stakeholders (Mazzoldi et al., 2019). Ecotourism activity gives people the opportunity, paying an amount of money, to be in contact with nature (Gallagher et al., 2011). Fishing for sport also has a relevant dimension that brings 33.1 million dollars in the U.S. and 25 million in Europe. Fishing activity employs 40 million people globally and fish represent one of the main sources of protein (Gascon et al., 2015). As stated by Clua et al., (2011): “When a live shark is involved in ecotourism, it has a higher value than a shark that is caught”. The results of their study show that the economic revenue generated by the shark-feeding ecotourism activity in Moorea Island (French Polynesia) brings US$ 5.4 million per year. They also state that giving an economic value to each shark individual is more convincing than conferring only an ecological value. While fisheries focus on the economic value on the direct consumption of sharks, the production of ecotourism activities regarding sharks is included in the principles of non-consumer direct use (Clua, 2011). Ecotourism brought to a change in marine ecosystems through conservation of species, such as “flag species”. This change from a destructive to non-destructive use of marine resources helps the growth of local economy and animal preservation. Still, non-destructive use needs management, considering that there may be negative consequences on marine wildlife.
12
4.4 Negative perception regarding sharks
Do people believe sharks are worth being protected? Unfortunately, many people around the world know of the existence of sharks because of their “bad reputation”. The movie Jaws, directed by Steven Spielberg in 1975, developed among people a great fear of sharks. After that, a myriad of movies (Sharknado, The Shallows, The Meg, etc.) and documentaries without any scientific base have been released, classifying sharks as “fearless men-eaters”. Therefore, mass media allowed the dissemination of information regarding shark attacks, thus influencing this animal's public perspective (Mazzoldi et al., 2019). Sharks have been on Earth for 400 million of years. There are approximately 500 different species of sharks living in our seas and oceans, from the smallest shark in the Mediterranean Sea, Etmopterus spinax(Linnaeus, 1758), 11 cm of length at birth, to the whale shark, R. typus, the length of which can reach up to 20 meters (De Maddalena et al., 2008). Nevertheless, sharks should be valuated as an ecosystem service that can be included under the cultural category of the Millennium Ecosystem Assessment.It is a real battle to raise people’s awareness about sharks, explaining that they are not all dangerous species, but rather misunderstood creatures.
4.5 Multifuncionality in fisheries
As established by the World Trade Organization (WTO), the term “multifuncionality” is mostly used in agriculture and relates generally to two types of goods: “material” goods, such as food and edible products and “non-material” goods, as the level of employment around the agricultural sector or the importance of landscapes as environment. In agriculture, there is a higher chance to conserve lands, for example, old patches of natural habitats deriving from agriculture activity can create non-material goods, preserving biodiversity. Fish products are typically considered as a resource of common property. The assignment of property rights over fish stocks and Non-Commodity Outputs (NCOs) is mostly linked to individual quotas for commercial stocks. NCOs are typical non-material and non-commercial goods. For fisheries, healthy ecosystems, biodiversity externalities, cultural heritage, safety of food, coastal employment are examples of NCOs. Payment for ecosystem services and creation of marine protected areas are necessary to improve social-economic welfare. The healthy use of seas appears to be an essential obligation to reduce poverty, improve food security, healthy livelihoods and decent work development. Management measures must be taken in order to control by-catch and harmful activities must be eliminated.
13
Even though overfishing should not be underestimated or encouraged, fishery incentives, that mostly cause overexploitation of the seas, are legitimized when they allow a positive improvement of social benefits (Mulazzani et al., 2019). As suggested by Mazzoldi et al., (2019) fishers and other stakeholders should benefit from ecotourism activities and incentives have to be provided.
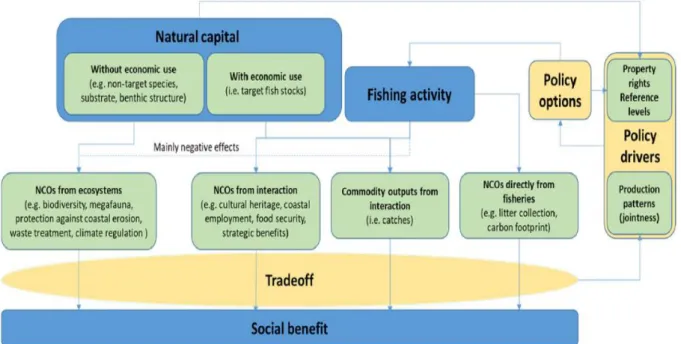
Figure 2 shows a core representation of the framework that considers aggregation of commodity outputs and NCOs that could generate social welfare, deriving from the relation between natural capital and fishing activity. Based on the economic use of natural capital, different outputs are generated to improve social welfare.
14
5. Eco-labels
In 1992, the United Nations Conference on Environment and Development (UNCED) in Rio de Janeiro, established, for the first time, eco-labelling. The principal aim of this label was to inform consumers about environmental and ecological issues, giving them the chance to evaluate their purchase choice (Gardiner et al., 2004). As stated by Galarraga (2002) eco-labels are used for plenty of merchandises. They have the aim to educate consumers to choose sustainable, eco-friendly products, providing them with information regarding production methods, from sea to fork. Consumers should be informed about environmental impacts due to their consumption, in order to spring an interest towards eco-friendly purchase.
Srinivasa Gopal et al., (2013) divide three categories of eco-labels according to the OECD (2001):
Type I is related to the quality of the product, from an environmental point of view. They are voluntary, non-discriminatory and the goal is to inspire the consumer to purchase responsibly. This kind of eco-label belongs to a group of certifications supported by third parties, generally governments. The purpose of this eco-label is to certify not only the product, but also the processes behind production (e.g. EU eco-labels).
Type II is set by the organization (importers or manufacturers) itself and is related to some characteristic of the product (e.g. “plastic-free” or “BPA-free”).
Type III follows a pre-set scheme that shows valuated information calculated independently by the organization. Eco-labels differ from ordinary products because they confer less negative impacts on environment.
5.1 Knowledge of eco-labels
As described by Song et al., (2018) nowadays there are a myriad of eco-certifications available for many products. As there are wide numbers of different eco-labels, to educate consumers to choose eco-friendly products is challenging. Those who use eco-labels may not really know their purpose and the actual success of eco-labels in advising consumers is still unclear (statement supported also byThøgersen, 2009).
15
The existence of so many eco-labels could misinform and confuse consumers during their purchase activity, making them discouraged and less interested. It is important to understand the power of eco-labels in the purchase decision of consumers. The study conducted by Song et al., (2018) evaluated the efficacy of eco-labels through the collection of data gathered from the purchase activity of 156 consumers using eye-tracking glasses test. Their results showed that consumers did not consider eco-labelled products enough and most of the products were purchased by habit. Therefore, actual data regarding how those eco-labels are used during the purchase are needed. Another important aspect is to hang a lantern on the several information regarding the product, such as price or calories table to shed light on eco-labels.
Fish markets are adopting eco-certifications, too. Many fisheries have improved their fishing methods, becoming more sustainable. MSC, Dolphin safe and Friends of the Sea are some of the most known third party eco-label (Gopal et al., 2013). The main objective of an eco-labeling system is to implement a market-based incentive in order to develop a better management of fisheries by growing consumer demand for seafood products from well-managed stocks (FAO, 2001). Informing consumers, sales managers and fishers about the existence and importance of eco-labels in order to confer to eco-labeled commodities a greater value compared to ordinary products is crucial. One of the main eco-label used in fisheries is the Marine Stewardship Council (MSC).
5.2 The eco-labels considered for the survey
Protected Designation of Origin (DOP)
Italy is the European country with the highest number of agri-food products with a designation of origin and a geographical indication recognized by the European Union. The system of the Geographical Indications of the EU favors the productive system, the economy of the territory, protects the environment and supports the social cohesion of the whole community. At the same time, consumers are given greater guarantees with a higher level of traceability and food safety than other products. The Protected Designation of Origin is a name that identifies a product originating from a place, a region or a specific country, whose quality or characteristics are essentially or exclusively due to a particular geographical environment and its intrinsic natural and human factors and whose production phases take place in the defined geographical area (MIPAAF, n.d.).
16 Biological product (BIO)
Organic farming is an agricultural method aimed at producing food with natural substances and processes. This means that it tends to have limited environmental impacts. It encourages using energy and natural resources responsibly, maintain biodiversity, preserve regional ecological balances, improve soil fertility and maintain water quality.In addition, organic farming rules encourage animal welfare and require farmers to meet the specific behavioral needs of animals. The European Union (EU) regulations on organic farming are designed to provide a clear framework for the production of organic products across the EU.The intent is to meet consumer demand for reliable organic products while creating a fair market for producers, distributors and retailers.The BIO logo provides a visual identity consistent with organic products sold in the EU. It helps EU consumers to identify organic products more easily and farmers to market them in all EU countries. The logo can only be used on products that have been certified as organic by an authorized inspection body or agency (European Union, n.d.).
Marine Stewardship Council (MSC)
The international non-profit organization, established in 1997 (independent body in 1999), aims to preserve oceans and marine resources. Giving oceanic fish resources the chance to grow, respecting ecosystems and biodiversity, makes sure that present and future generations will be able to consume fish. Eco-labels are used in order to help safeguard oceans, by improving sustainable fishing activities and guiding consumers to purchase respectfully. Independent, third-party certifiers carry out certifications by the MSC standard; this means that MSC does not directly confer certifications to fisheries. Fishery science and management experts redact the fishery assessments and are independent from MSC and fisheries. Conformity Assessment Bodies (CABs) are an independent organization, which supervises the certification process of eco-labels. MSC and stakeholders follow multiple Standards to ensure sustainable fisheries and improve the supply chains (MSC, n.d.). The following labels in Figure 3 are those showed during the consumers’ survey.
17
6. Contingent Valuation Method
The main purpose of the Contingent Valuation Method is to determine the economic approximation regarding non-market goods (health, environment, culture, etc.) through direct surveys addressed to people in order to estimate their opinions, thoughts and preferences. The Contingent Valuation Method focuses on the extra price that the consumer would pay for a certain product, which is not yet on the market (Owusu et al., 2013). Several studies used this approach for different products such as safety of food or products from organic origin (Dìaz et al., 2012).
The scenario consists of a simulation of a hypothetical (or contingent) market the purpose of which is to estimate the “willingness to pay” (WTP) or the “willingness to accept” (WTA) of the consumers with an eye to improve the well-being. Since the 1960, a vast number of economists referred to this methodology, including environmental filed, to measure the non-use value estimation, in particular the value of option and value of existence (Notaro, 2011). The willingness to pay is the amount of money that represents how much consumers are prone to pay. As stated by Bezzi 2010, this technique is used in cost-benefit analysis, for the evaluation of alternative options. Questionnaires are commonly used for this type of survey. The questions for this survey are developed in order to appraise the “willingness to pay” (WTP). As described by Bezzi (2010) the WTP may be distinguished in:
WTP with indirect knowledge of the good: The knowledge derives from the description given during the interview;
WTP with direct knowledge of the good: The interviewed have been able to inspect the good;
Hypothetic WTP: The interviewed expresses an intention of behavior with no payments involved;
18
6.1 Contingent Valuation Method surveys typologies
Open-ended questions require the maximum willingness to pay for a good (or minimum willingness to accept a compensation for its absence) without any hint or advice. This type of questions present difficulties for the interviewed to estimate, therefore poorly used;
Close-ended questions as dichotomous choice to avoid bestowing upon the interviewed the burden of knowledge of the economic nuances of the good through pre-selected answers;
Guided open-ended questions where the interviewed choice is limited by payment card with decreasing groups of monetary imports;
Payment ladder, with increasing monthly and annual imports where the interviewed signs the values, from the lower ones, that would be willing to pay, and with an X, from above, the ones not willing to pay;
Bidding, after defining an initial price suggested by the interviewer, the price itself is modified based on the acceptance or refusal of the interviewer, up to establishing the maximum price that the latter is willing to pay to win the good (Notaro, 2011).
6.2
Negative aspects of the Contingent Valuation Method
Several concerns regarding this model exist and are mainly related to two key aspects: validity or precision and reliability or coherence of the results of the estimation. The application of this method leads to multiple bias (Notaro, 2011).
They are analysed one by one as follows:
Embedding effect is the first source of error. Indeed, some studies have validated that the estimation of the value of a good may vary according to whether it is assessed individually or as part of a complex set of goods;
19
Question order bias is another source of error. This effect takes place when the value of the good depends on the order in which the questions are arranged in the questionnaire. The validity of the estimate results depends mainly on the actual nature of the information provided by the description of the hypothetical scenarios to the participants. The way the information is provided can have a positive and negative effect on the results;
Strategic error: when the respondents conclude that they can receive personal benefits based on their responses. This could induce them to respond in a "strategic" way, in order to obtain the highest result. This problem usually arises when the questionnaire presents high imports choices compared to the average. There are two types of strategic errors:
o Free riding: an individual declares a low WTP for a public good because he expects others to pay for it too.
o Over-pledging: when a person believes that the proclaimed value will affect the price, quality and quantity of the good, therefore tends to overestimate or underestimate the good.
Hypothetical error: the scenario may be not very close to reality. The interviewed considers the scenario unrealistic, which consequently leads to declare untrue WTP or WTA values (Notaro, 2011).
20
7. Materials and methods
The data collected for this study derives from a contingent valuation survey conducted among consumers. It consists in the administration of a personal, anonymous questionnaire to the consumer, who needs to answer questions containing hypothetical decisions in a hypothetical fishmonger and supermarket situation. This method is often used to understand the preferences of the consumers, their willingness to pay or accept an extra price for a certified product and the personal knowledge regarding eco-labels (Song et al., 2018). Two hundred questionnaires have been administrated, randomly, face-to-face, to fishery products consumers in two towns, Ravenna and Pavullo nel Frignano (Emilia Romagna, IT), in a fish market and a supermarket each. Owusu (2013) and Nandi (2017) indicate that this direct “interviewer-interviewed” approach is more valid for the contingent valuation method. Specifically, this survey asks how much money consumers would spend to buy a shark-free eco-labelled product. The interview took about from 3 to 5 minutes per interviewed. The investigation has been carried out from September to November 2019. Besides the consumer surveys, in November, there has been administrated a questionnaire to a wholesaler and in January, there have been administrated questionnaires to the sales manager of the two fishmongers and two supermarkets per town.
7.1 Consumer questionnaire design
The questions presented in the survey for this study are both an open-ended (max price) and a closed-ended binary (accept or not accept the price proposed). The survey can be divided into two versions of the same survey, each divided in 6 parts and accounting for 100 interviews. The difference between those surveys lies in the order of the question number 9:” Did you know that different species of sharks in the Adriatic Sea, such as the common smooth-hound shark and the blue shark, have experienced a drastic decline because of fishing activity? a. Yes, b. No”. This division was made in order to see if knowing this information, would have conditioned or not the acceptation of the price proposed and the maximum price.
The six parts are described as follows:
Part 1 contains questions about the frequency purchase of fresh fish products. The interviewed has to choose among 5 possible answers:” (0) never, (1) rarely, (2) 1-2 times per month, (3) once a week and (4) several times a week”. Afterwards, the interviewed declares, always using the 5 possible answers above, the frequency of purchase of specific fish products that have been classified in
21
“crustaceans, pelagic fish, sharks, other fish, shellfish and cephalopods”. The interviewed chooses 3 main shopping places among supermarket, fishmonger, market, fisher and ambulant.
Part 2 contains questions that aims to understand the personal awareness and knowledge of eco-labelled products. The focus is to understand whether the consumer is aware of the eco-labels meaning, besides having seen them on a product. Three main eco-labels (Figure 2) were shown to consumers: DOP (Designation of Protected Origin), BIO (Biological Product) and MSC (Marine Stewardship Council).
Part 3 aims to comprehend 3 main aspects the consumer considers for what concern fish products. The options are:” (a) origin of the catch (Italian or from abroad), (b) origin of the Adriatic Sea, (c) method of production (fished or farmed), (d) freshness (external appearance), (e) nutritional properties (calories), (f) ease of preparation, (g) habit of buying products that one knows and likes, (h) price and (i) eco-sustainable certifications.
Part 4 aims to see whether the consumer is aware that fishing activity is causing sharks decline in the Adriatic Sea and if, consequently, people would be interested in shark-free eco-labelled products of small pelagics. Five different prices have been chosen for this survey:”6.30 €, 6.60 €, 6.90 €, 7.20 € and 7.50 €”. Each price was proposed 20 times per each of the two versions, meaning 10 per version per town, meaning 5 per version, per town per shop. Eventually, consumers indicate the maximum price they would pay for a shark-free product, compared to the average market price (for this survey the average market price established is 6 €/Kg).
Part 5 where consumers were asked to assign a value from 1 to 5 to the 4 options, where 1 = false; 2 = rarely true; 3 = sometimes true, 4 = most of the times true and 5 = always true. The possible choices chosen for this phase serve to establish the propension of the buyer in purchasing responsibly on behalf of the environment, using the Ethically Minded Consumer Behavior (EMBC) scale. The
22
scale has gone through multiple rearrangements and modifications over the years (Sudbury-Riley et al., 2016). Table 1 shows the EMBC scale answer choices. For this study answers 1, 4, 5 and 9 have been used for the questionnaires.
Part 6 concludes the survey and contains questions in order to obtain some socio-economic information, such as age, sex, school qualification, number of family members and net monthly family income.
Table 1. EMBC scale (Sudbury-Riley et al., 2016).
1. When there is a choice, I always choose the product that contributes to the least amount of environmental damage.
2. I have switched products for environmental reasons.
3. If I understand the potential damage to the environment that some products can cause, I do not purchase those products.
4. I do not buy household products that harm the environment.
5. Whenever possible, I buy products packaged in reusable or recyclable containers.
6. I make every effort to buy paper products (toilet paper, tissues, etc.) made from recycled paper. 7. I will not buy a product if I know that the company that sells it is socially irresponsible.
8. I do not buy products from companies that I know use sweatshop labor, child labor, or other poor working conditions.
9. I have paid more for environmentally friendly products when there is a cheaper alternative. 10. I have paid more for socially responsible products when there is a cheaper alternative.
7.2 Fishmonger and supermarket questionnaire design
The questions presented for this survey are divided into two parts as follows:
Part 1 contains information regarding commercial channels, in which the sales managers are asked to indicate how many kilograms of anchovies and sardines they sell in one year and from whom do they buy pelagic fish and in which proportion. If the sales managers supply pelagic fish from vessels or wholesalers, it is important to indicate the number. The provenance of pelagic fish represents another important slice of the survey and the managers have to indicate, in proportion, from which vessels do they supply (Italian, Croatian or other vessels). The managers have to point out how the selling price is decided (if a specific agreement with the wholesalers has been stipulated) and if it depends on the
23
quality of the pelagic fish. In this case, the managers have to indicate the minimum and maximum price based on the physical appearance (size, compactness and integrity) of the fish.
Part 2 contains information about commercial strategies. The sales managers are asked to give personal opinions regarding MSC eco-labels knowledge, specifying if labels could improve market conditions. It is relevant to understand if eco-labelled pelagic fish products would valorize the product itself and improving the market. If the answer is positive, then, on a scale of 1 to 5, the manager has to indicate from 1 = no efficacy to 5 = great efficacy, different labels: (a.) geographical origin labels, (b) private labels, (c) supermarkets labels, (d) specific fishing tool labels and (e) sustainable labels effectiveness. The managers are asked to choose two negative and two positive aspects, using a scale from 1 to 5 (1= total disagreement, 5=total agreement), whether pelagic fish would have a specific eco-label, in this case, a shark-free eco-label.
7.3 Wholesaler questionnaire design
The wholesaler was asked to describe the principal activity, answering where the commercial chain is distributed, in which geographical scale occurs the activity and what kind of buyers and wholesalers interacts with. The wholesaler was asked to indicate the number of vessels that supply, in which port those vessels land and, in proportion, how many anchovies and sardines are bought. Important was to know whether the price of the small pelagics remains constant during the year and or not, and what kind of factors influence the possible variation. The wholesaler was asked whether there are specific deals with the fishers.
The last part of the questionnaire contains questions regarding the shark-free eco-labelling, and the wholesaler is asked whether the buyers would be interested or not in a more sustainable product of small pelagic and how much would be the difference in price to sell this product.
7.4 Consumers survey elaboration
The open-ended questions from the 200 questionnaires have been analysed through cross section linear regressions with ordinary least squares (OLS), using software Gretl (Gretl, 2019d). In these regressions the focus has been on the Difference in Price (DiffPrice) as the dependent variable, deriving from the difference between the Maximum Price (MaxPrice)
24
proposed by the consumers and the market price for the pelagic fish (anchovy) chosen for the survey (6 €/kg). The aim of this analysis was to study how the DiffPrice is influenced by the independent variables.
A boxplot has been created in order to see how DiffPrice values is distributed. A boxplot is a graphical representation used to describe the distribution of a sample through simple dispersion (standard error, standard deviation and deviance) and position (mode, mean and median) indices. This type of graphical representation is used to see whether outlier values are present or not. Four outlier values have been omitted to be able to work with a more consistent dataset. Several attempts have been made to explain the relations among the DiffPrice and the independent variables hypothesized.
The independent variables can be summarized in:
Frequency purchase of fresh fish products (Frequency); Frequency purchase of pelagic fish (FreqPelagic); Frequency purchase of sharks (FreqShark); Shop preferences (Shop);
Town of administration of questionnaires (Town); Position of question number 9 (Information);
Knowledge of eco-labels (KnowDOP, KnowBIO, KnowMSC);
Main aspects considered for what concern fish products (Origin, Adriatic, Method, Freshness, Calories, EasyPrep, Habit, Price_aaa, Certified);
Awareness regarding sharks decline due to fishing activity (SharkDecline); Interest in a shark-free eco-label (Sharkfree);
Responsible purchase (LessImpact, HouseProducts, Recycle, EnvGood); Socio-economic features (Sex, Age, SchoolTitle, Family and Economic).
The following 2 models constitute the background steps in a broader reasoning process that led to the formulation of a final model:
Model 1: OLS, observations 1-200, dependent variable: DiffPrice.
In this model, a shotgun cross section analysis on 200 questionnaires on the independent variables has been made, followed by the tests of White and Breusch-Pagan for heteroskedasticity. A sample of random variables is defined heteroskedastic if there are sub-populations within it that have different variances.
25
These test aims to establish whether the variance of the errors in a regression model is constant or not (White, 1980). A test to calculate the normality of residuals, to see how the error is distributed, has been made.
Model 2: OLS, observations 1-200, dependent variable: DiffPrice. Robust standard errors compared to the Heteroskedasticity, variant HC1.
In this model, the same shotgun cross section analysis on 200 questionnaires on the same independent variables has been made. The heteroskedasticity tests and the normality of residuals have not been effectuated, while the residuals of regression of the DiffPrice have been calculated.
The following 10 models, executed on the 196 observations, the ones without outliers, constitute steps in a broader reasoning process that led to the formulation of a final model:
Model 1: OLS, observations 1-196, dependent variable: DiffPrice.
For this model, the same analysis made on the first 1-200 observation has been made, as in Model 1.
Model 2: OLS, observations 1-196, dependent variable: DiffPrice. Robust standard errors compared to the Heteroskedasticity, variant HC1.
For this model, the same analysis made on the first 1-196 observation has been made, as in the previous Model 2.
Model 3: OLS, observations 1-196, dependent variable: DiffPrice, independent variable: group of Town, Shop and Information. Robust standard errors compared to the Heteroskedasticity, variant HC1.
Model 4: OLS, observations 1-196, dependent variable: DiffPrice, independent variable: group of Frequency, FreqPelagic and FreqShark. Robust standard errors compared to the Heteroskedasticity, variant HC1.
Model 5: OLS, observations 1-196, dependent variable: DiffPrice, independent variable: group of KnowDOP, KnowBIO and KnowMSC. Robust standard errors compared to the Heteroskedasticity, variant HC1.
26
Model 6: OLS, observations 1-196, dependent variable: DiffPrice, independent variable: group of Origin, Adriatic, Method, Freshness, Calories, EasyPrep, Habit, Price_aaa and Certified. Robust standard errors compared to the Heteroskedasticity, variant HC1.
Model 7: OLS, observations 1-196, dependent variable: DiffPrice, independent variable: group of SharkDecline and Sharkfree. Robust standard errors compared to the Heteroskedasticity, variant HC1.
Model 8: OLS, observations 1-196, dependent variable: DiffPrice, independent variable: group of LessImpact, HouseProducts, Recycle and EnvGood. Robust standard errors compared to the Heteroskedasticity, variant HC1.
Model 9: OLS, observations 1-196, dependent variable: DiffPrice, independent variable: group of Sex, Age, SchoolTitle, Family and Economic. Robust standard errors compared to the Heteroskedasticity, variant HC1.
Model 10: OLS, observations 1-196, dependent variable: DiffPrice, independent variables: Town, Shop, Information, Frequency, FreqPelagic, KnowBIO, SharkDecline, Sharkfree, EnvGood, Age, Economic. Robust standard errors compared to the Heteroskedasticity, variant HC1. A test for the omitted variables (Town, Shop and Information) has been made.
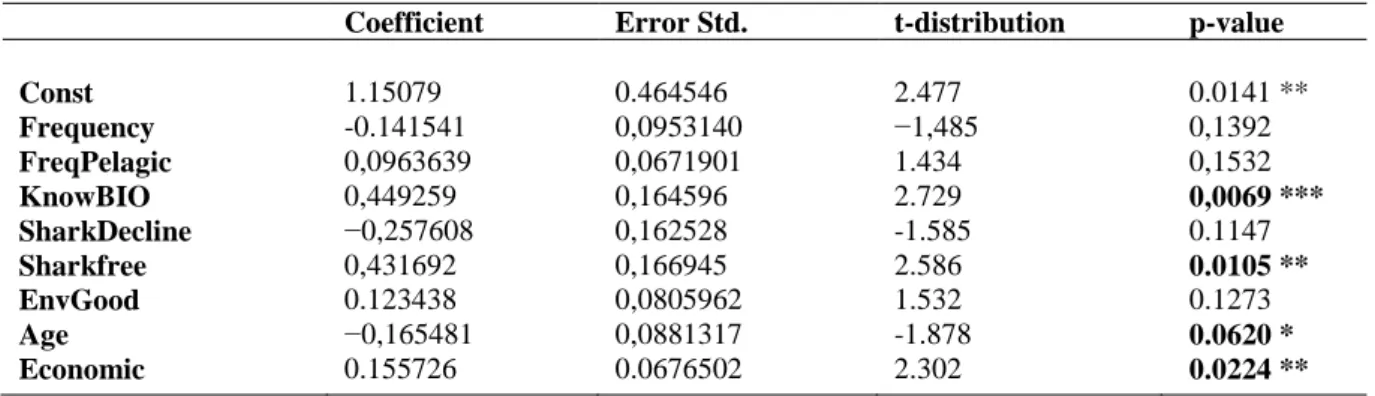
Model 11: OLS, observations 1-196, dependent variable: DiffPrice, independent variables: Frequency, FreqPelagic, KnowBIO, SharkDecline, Sharkfree, EnvGood, Age, Economic. Robust standard errors compared to the Heteroskedasticity, variant HC1. This model represents the final analysis for which results have been discussed.
7.5 Qualitative analyses
A qualitative analyses on the close-ended questions of the 200 questionnaires have been done using Excel 15.0, 2013 (Microsoft, 2013). For each question, graphs and histograms have been made in order to get a general overview of the information given by the consumers. Since several inconsistencies for questions where consumers were asked if they would be willing to
27
pay for a shark-free eco-labelled product have been found, ulterior adjustments and analysis have been made. There have been created two variables: “Accept” and “Accept Bis”. Accept indicates which consumer accepted the proposed price, while Accept Bis is corrected taking into account consistency with “maximum price” answer. For all consumers who accepted the proposed price, but later indicated a maximum price, lower than the price accepted before, the Accept Bis was considered null. In other words, the question was evaluated as if the consumers did not accepted the proposed price.
Farther, qualitative comments semi-structured interviews to introduce and evaluate the opinion regarding shark eco-labelling stated by the sales managers of the fishmongers and supermarkets and the wholesaler have been made.
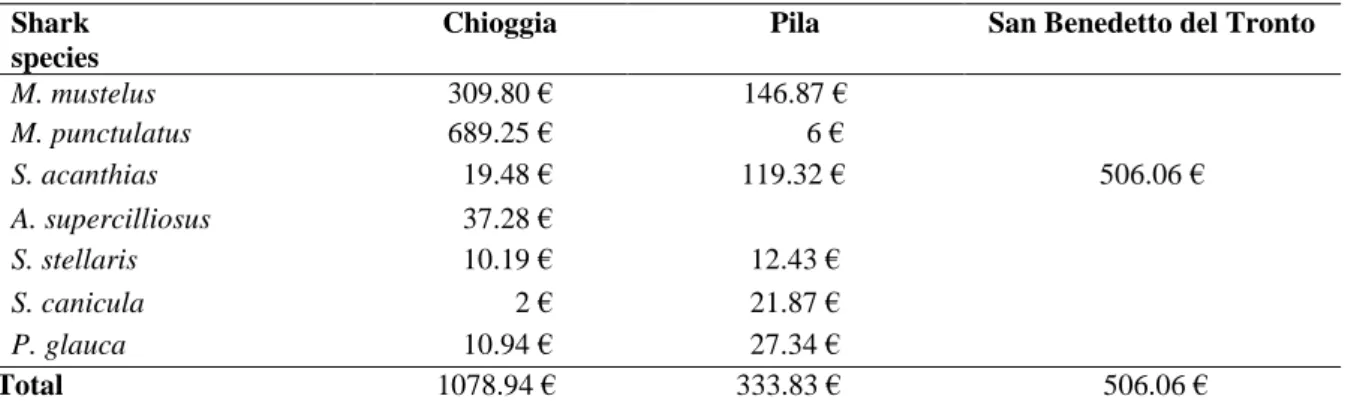
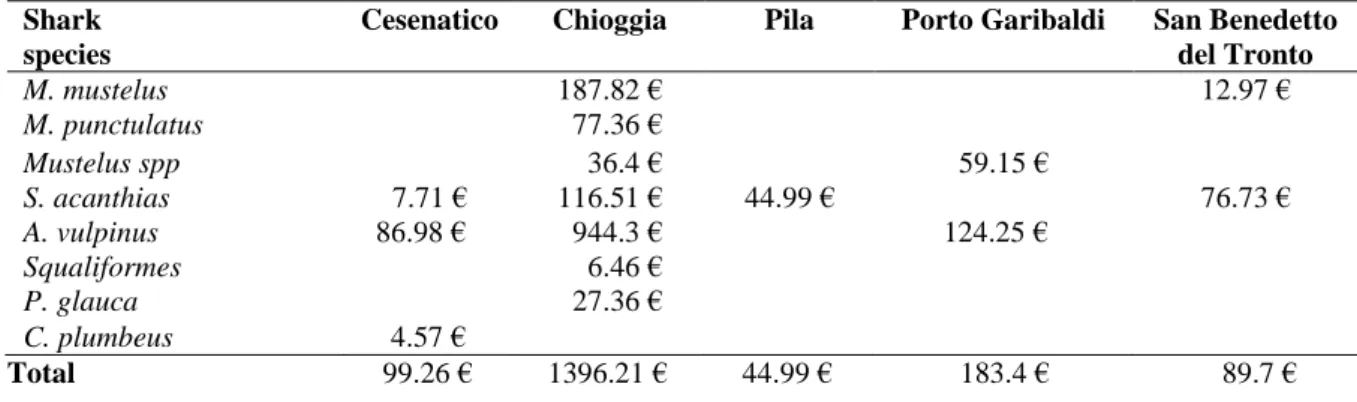
7.6 Sharks by-catch data collection
The Experimental Centre for Habitat Conservation (CESTHA), headquartered in Marina di Ravenna, provided pelagic trawlers by-catch data for the years 2018-2019, already aggregated by port of landing.Qualified observers worked on board ofpelagic trawlers in the northern and central Adriatic Sea and monitored fishing operations. By-catch data of species of conservation concern (e.g., elasmobranchs) were collected. For the year 2018, the port of Chioggia cooperated with 2 pairs of vessels, that means 4 vessels in total, while Pila and San Benedetto del Tronto with 1 pair of vessels, which means 2 vessels total, each. For the year 2019, the port of Cesenatico cooperated with 2 pairs of vessels, that means 4 vessels in total, while Chioggia, Pila, San Benedetto del Tronto and Porto Garibaldi with 1 pair of vessels, that means 2 vessels total, each. The aggregated data contain the date, the quantity, the weight (kg), the port of landing of the shark species and the total boarding per port, which refers to the presence on board of the observers.
For the study it has been estimated the amount of money that the pair of vessels gains per year with the by-catch of sharks. In order to create a shark-free eco-label, it is essential to make an economic assessment of the amount of money that the pair of vessels would lose if they would decide to adopt the label, meaning, throwing the sharks back in the sea.
The positive attitude of fishers towards a better management of fisheries is indispensable and the greatest challenge is to encourage them to release sharks in the sea, rather than sell them. The price applied to calculate the annual profit/kg for the years 2018-2019 by-catch of sharks was retrieved from the ISMEA markets 2017 dataset (the only one available during the drafting of this study).
28
The annual average price per kg of Chioggia 2017 has been calculated summing the maximum price/kg to the minimum price/kg, divided per 2. Afterwards, the resulting price has been applied for both ports of Emilia-Romagna and Veneto (that is to say Pila, Chioggia, Cesenatico and Porto Garibaldi provided by CESTHA). The average annual price per kg of San Benedetto del Tronto 2017 has been applied for the Marche region (that is to say San Benedetto del Tronto provided by CESTHA). It was subsequently calculated the economic value of the by-catch of sharks per pair of vessels.
More specifically, part of this study aims to assess the economic importance of the landed by-catch of sharks to the pelagic trawling fisheries in the Northern and Central Adriatic Sea. This is in terms of the annual value of by-catch for pair of vessels. Afterwards, analyses accounting for each species of sharks have been made. For the species for which ISEMA did not provide a price, the price of 4.97 has been used.
By-catch shark species from CESTHA dataset are: M. mustelus;
Mustelus punctulatus (Risso, 1827); Mustelus spp;
Alopias supercillosus (Lowe, 1840); Alopias vulpinus (Bonnaterre, 1788); Scyliorhinus stellaris (Linnaeus, 1758); Scyliorhinus canicula (Linnaeus, 1758); S. acanthias;
Prionace glauca (Linnaeus, 1758); Carcharhinus plumbeus (Nardo, 1827) ND Squaliformes.
7.7 Economic advantage per vessel
Theoretical advantages of a shark-free eco-label for the vessels have been thus calculated as follows:
1. Estimation of the mean DiffPrice;
2. Calculation of the percentage of mean DiffPrice (mean DiffPrice/average market price)*100;
29
3. Application of the percentage to the mean revenues of a, for instance, Veneto pelagic trawl vessel using NISEA 2017 dataset;
4. The theoretical revenue for a pelagic trawl in the event that it would have sold the small pelagics in the reference year at the higher price guaranteed by the label; 5. The lack of revenues of a vessel of Chioggia given by the value of the by-catch is
assumed as the amount of money for the application of the label;
6. The lack of revenues given by the unsold sharks have been compared to the increased revenues from the higher price of small pelagics, assuming that the label is given freely.
Since NISEA data were aggregated for the entire Veneto fleet (36 vessels) and, for the present work, were divided by 36 to obtain an average per vessel, the total values for the years 2018-2019 of Chioggia reported in Tables 8 and 10 have been calculated per vessel, too.
30
8. Results and discussions
8.1 Qualitative analyses results: Frequency purchase of fresh fish products
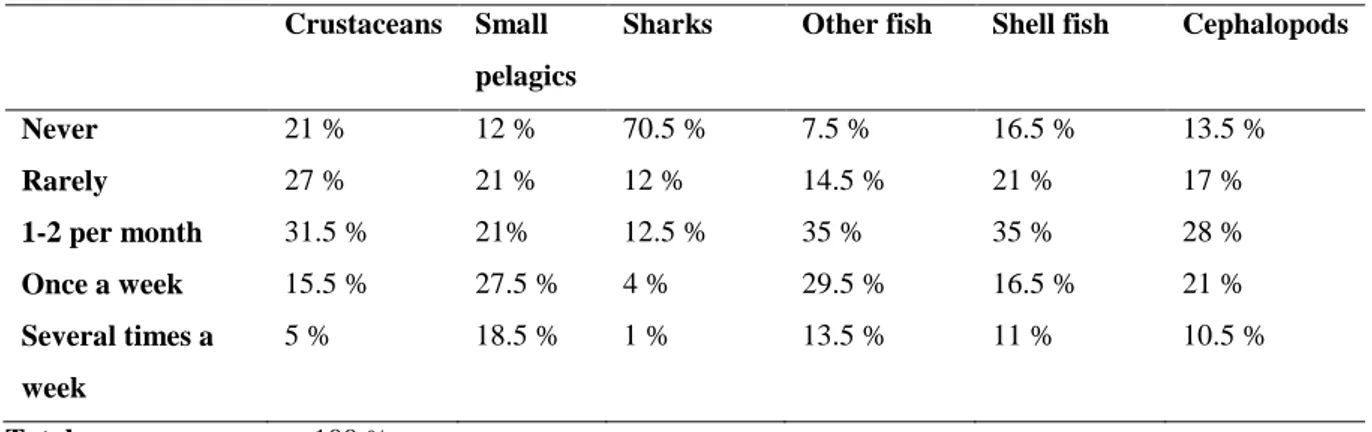
On 200 consumers, 37 % buy fresh fish products once a week and 39 % several times a week. The 8 % of consumers purchase fresh fish rarely and 16 % 1 or 2 times per month. One of the main purposes was to find out how many consumers purchase small pelagics and how frequently. The results showed in Table 2 reveal that 27.5 % of the interviewed purchase sardines and anchovies once a week and that consumers have major interest in purchasing “cephalopods”, “shellfish”, “crustaceans” and “other fish”. The qualitative results indicate also that 70.5 % of consumers never buy shark meat. During the survey, some examples of shark species have been given as examples, since several consumers thought that sharks included the swordfish or even tuna, which are bony fish. Therefore, the high number of consumers that do not consume shark meat could contain bias due to the likely misidentification of sharks as other species.
Table 2. Percentage of consumers and frequency purchase of fresh fish products.
Crustaceans Small pelagics
Sharks Other fish Shell fish Cephalopods
Never 21 % 12 % 70.5 % 7.5 % 16.5 % 13.5 % Rarely 27 % 21 % 12 % 14.5 % 21 % 17 % 1-2 per month 31.5 % 21% 12.5 % 35 % 35 % 28 % Once a week 15.5 % 27.5 % 4 % 29.5 % 16.5 % 21 % Several times a week 5 % 18.5 % 1 % 13.5 % 11 % 10.5 % Total 100 %
8.2 Socio-demographic variables
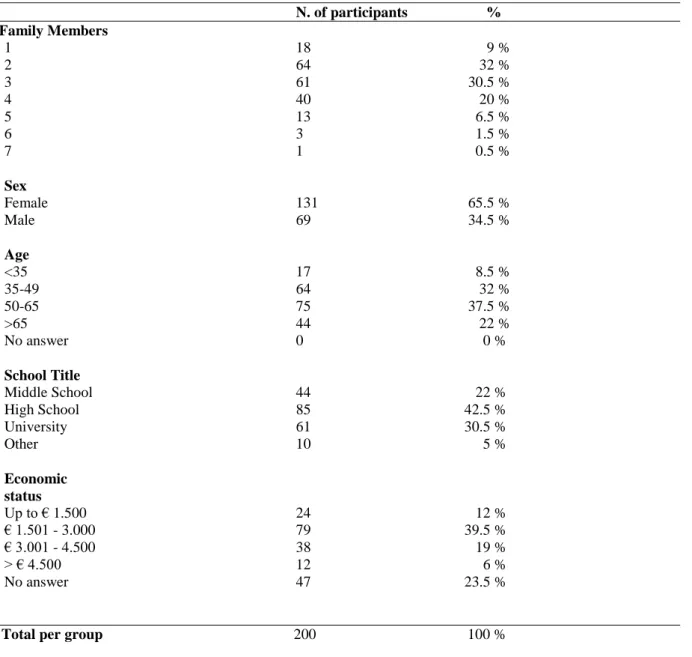
The results of the descriptive analyses of consumers socio-demographic variables indicated in Table 3revealed that on 200 consumers, 65.5 % were female and 34.5 % were male. This result was predictable since females are usually in charge of the family’s expenses regarding groceries (Nandi et al., 2017). Respondents with the age between 50-65 (37.5 %) and 35-49 (32 %), as well as highly educated consumers (42.5 % went to high school and 30.5 % went to university) are overrepresented in this study. On 200 consumers, 39.5 % claimed that the monthly family net income ranged from 1501 to 3000€. On the other hand, 23.5 % of consumers preferred not to answer the question, as considered too personal.
31
Table 3. Socio-demographic information of the participants.
N. of participants % Family Members 1 2 3 4 5 6 7 Sex Female Male Age <35 35-49 50-65 >65 No answer School Title Middle School High School University Other Economic status Up to € 1.500 € 1.501 - 3.000 € 3.001 - 4.500 > € 4.500 No answer 18 9 % 64 32 % 61 30.5 % 40 20 % 13 6.5 % 3 1.5 % 1 0.5 % 131 65.5 % 69 34.5 % 17 8.5 % 64 32 % 75 37.5 % 44 22 % 0 0 % 44 22 % 85 42.5 % 61 30.5 % 10 5 % 24 12 % 79 39.5 % 38 19 % 12 6 % 47 23.5 %
Total per group 200 100 %
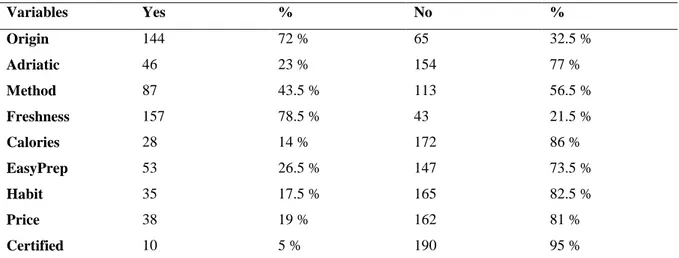
8.3 Main fish aspects
Table 4 provides the main characteristic considered by consumers. Freshness (78.5 %), origin (72 %) and method of production (43.5 %) are the main aspects considered mostly. Contrary to what was expected, few consumers are interested in the origin from the Adriatic Sea (23 %). Surprisingly, the price was not one of the three main aspects chosen by the consumers. Indeed, only the 19 % of shoppers considered the price as an important factor.
This result could mean that consumers would be willing to pay an extra price for a more sustainable fish product but, according to the results, 95 % of consumers did not consider the sustainable eco-certification as one of the three aspects while purchasing fresh fish.
32
Table 4. Table indicating the main aspects chosen by the consumers regarding fish products.
Variables Yes % No % Origin 144 72 % 65 32.5 % Adriatic 46 23 % 154 77 % Method 87 43.5 % 113 56.5 % Freshness 157 78.5 % 43 21.5 % Calories 28 14 % 172 86 % EasyPrep 53 26.5 % 147 73.5 % Habit 35 17.5 % 165 82.5 % Price 38 19 % 162 81 % Certified 10 5 % 190 95 %
Note: the answers under column Yes and No indicate the number of consumers on 200 total and the relative
percentage.
8.4 The awareness of labels significance
Although eco-labels are increasingly being used for various products, their usefulness in educating customers to purchase environmentally-friendly goods is still uncertain (Song et al., 2018). Most consumers are poorly aware of the existance of MSC, BIO and DOP labels. As it was important to understand whether the consumers know the label besides having seen it. Table 5 shows the number of consumers that have seen the labels and how much they know about them. When consumer were asked to explain what the meaning of the labels was, very few of them could describe in short words what they represented or on which product were present. Despite the lack of knowledge of labels, 70.5 % of consumers would pay for a shark-free product, even though only 5 % of consumers indicated the certification of the product as one of the 3 priorities when purchasing fresh fish products.This result could confirm that not all good intentions and interest into eco-labelled products can translate into a practical reality. Table 5. The awareness of consumers regarding the 3 labels selected for the survey.
Variables Knowledge of DOP Knowledge of BIO Knowledge of MSC Have not seen and do not
know
61.5 % 48.5 % 64 %
Have not seen and know in part
0 % 1 % 1 %
Saw and do not know 21.5 % 35 % 18.5 %
Saw and know in part 12 % 13.5 % 10 %
Saw and know well 5 % 2 % 6.5 %
33
8.5 EMBC scale results
Table 6 contains the number of consumers who answered the questions of the survey according to the EMBC scale. With the assumption of having the possibility to choose, 35 % of consumers, most of the time, decide to purchase products that have the least impact on the environment and 37.5 % of consumers, whenever possible, choose products with recyclable packaging or that can be reused. Indeed, when consumers can choose, most of the time, they are attentive to the environment, with 45.5 % stating that they would spend an extra price on more sustainable products than the cheaper ones.
Table 6. EMBC scale results to measure the buyer's propensity to make environmentally responsible purchases.
Less Impact House Products Recycle Env Good
False 4 % 12 % 8 % 6.5 %
Rarely 9 % 18 % 10.5 % 7.5 %
Sometimes 19.5 % 22 % 18.5 % 24.5 %
Most of the times 35 % 28 % 37.5 % 45.5 %
Always 32.5 % 20 % 25.5 % 16 %
Total 100 %
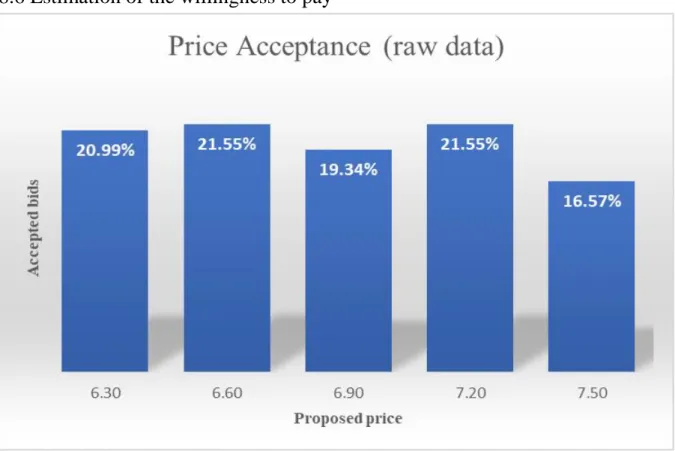
8.6 Estimation of the willingness to pay
34
Figure 4 portrays the results in percentage of 181 consumers’ willingness to pay for a shark-free product. This analysis has been made in order to visualize the rate of acceptance of the proposed prices. The results that include the raw data (without Accept Bis) show that the price acceptance is constant for each price proposed. The raw data have been subsequently adjusted, as several cases of inconsistencies were identified during the analysis.
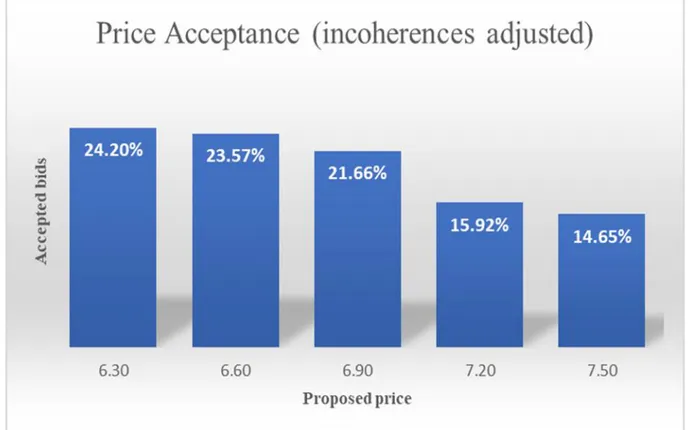
Figure 5. Rate of acceptance including the incoherent answers.
Twenty-four consumers out of 200 have been individuated and classified under the “Incoherent” category and 3 under the “X cases” category. The “Incoherent” category include those consumers who during the survey indicated a maximum price that they were willing to pay which was though inferior to the offered price that they had already accepted (e.g. price proposed during the survey that has been accepted: 7.50 € and maximum price proposed by the consumer: 6.00 €). Vice versa, the “X cases” are those consumers who did not accept the proposed price, but offered a higher maximum price (e.g. price proposed during the survey that has not been accepted: 6.30 € and maximum price proposed by the consumer: 8.00 €). Figure 5 considers the category “Accept Bis” and show how the presence of the “Incoherent” and “X cases” adjustment influences the results. As the price proposed grow, the acceptance by the consumers decline.
35
8.7 Sales managers questionnaires results
8.7.1 Supermarket of Pavullo nel Frignano
An external cooperative society decides commercial channels and strategies for the supermarket in Pavullo nel Frignano, including all decisions about fish products, species preferences, prices and even suppliers. The supermarket sells annually about 1500 kg of anchovies and up to 1800/2000 kg of the less expensive sardines. A pricelist is provided by the cooperative society to the supermarket and can be negotiated based on the market trend, the fish catches rate, and partially on the demand of the consumer. This cooperative society provides mainly 2 wholesalers from which the supermarket supplies itself 100 % of the fish products.
As well as for other food products, sustainable labels on fresh pelagic fish products could improve market conditions and increase the value of anchovies and sardines. The sales manager is aware of the existence of MSC label and believes that labels of geographical origin (Mediterranean and Adriatic Sea) are deemed as very successful, considering that consumers prefer products caught by the Italian fleet. In addition, labels that carry the supermarket logo, labels indicating the use of specific fishing tools or techniques and sustainable labels could valorize the product. The least efficacy was attributed to private labels.
If the fishers adopted the shark-free eco-label, the supermarket would also be prone to do the same, always according to the decisions of the cooperative society. The consumer would be willing to pay an extra price, after being informed regarding the certification and sustainability topic. Considering that Pavullo nel Frignano is an inland town, fish is not the main product consumed and consumers mostly seek for fresh products in discount, which include sharks, such as the common smooth-hound or mako shark.
8.7.2 Supermarket of Ravenna
The purchase of fish products, species preferences, prices and wholesalers for the supermarket in Ravenna is managed by a fish market that has not been indicated in the survey. The supermarket sells annually about 1500 kg of anchovies and 1700 kg of sardines, which supplies itself 100 % from the fish market. While 85 % of the pelagic fish comes from the Adriatic Sea (Italian fleets), 15 % comes from other seas. Prices are negotiated based on the market trend, catches rate and consumers’ demand. The price can change according to the physical characteristics of the fish (size, freshness, etc.). No minimum or maximum price has been indicated.
36
Sustainable labels on fresh pelagic fish products could improve market conditions, the value of the fish and the reputation of the supermarket, creating competitive advantage compared to other supermarkets and fishmongers. Labels of geographical origin (Mediterranean and Adriatic Sea) could have a quite high efficacy, as well as private labels, fishing sustainability labels and labels that would include the logo of the supermarket.An almost null efficacy was attributed to labels based on specific fishing tools.
The interviewed is not aware of the existence of the MSC and claims that there could be difficulties in keeping separate the certified products from the uncertified ones, with higher costs. The sales manager is not sure that a shark-free eco-label could improve market condition of anchovies and sardines, but claims that consumers could be interested in a shark-free eco-labels product after being informed about the topic.
8.7.3 Fishmonger of Pavullo nel Frignano
The fishmonger of Pavullo nel Frignano sells annually about 1000 kg of anchovies per year and 700 kg sardines per year and supplies itself 100 % by 2 wholesalers that restock from the market of Chioggia. In proportion, 90 % of the pelagic fish comes from Italian fleets operating in the Adriatic Sea, 5 % from Croatian fleets operating in the Adriatic Sea and 5 % from other seas. The price is decided by the wholesalers based on the trends of the market of Chioggia and can depend on the physical characteristics of the fish, such as size and freshness. No minimum nor maximum price has been indicated. The selling price of the day is updated based on the price negotiated with the wholesaler.
The sales manager is not aware of the MSC label and believes that consumers would probably not be willing to pay an extra price for the pelagic fish, but at the same time, could be interested in paying for a shark-free product, after being informed about the topic.
8.7.4 Fishmonger of Ravenna
The fishmonger in Ravenna sells annually about 4500 kg of anchovies per year and 4500 kg sardines per year. This can be explained as the fishmonger run a second fishmonger in Lido Adriano. They are supplied of 30 % of the products by the market of Rimini and 70 % by 3 wholesalers. In proportion, 80 % of the anchovies come from Italian fleets operating in the Adriatic Sea, 10 % from Croatian fleets operating in the Adriatic Sea and 10 % from other seas. The price is decided by the wholesalers and is negotiated at each market trade. It depends on the catches rate and the consumers’ demand. The price may depend on the physical condition