Materials and Structures
Non Destructive Assessment of In-situ Concrete Strength: comparison of approaches
through an international benchmark
--Manuscript
Draft--Manuscript Number: MAAS-D-16-00727
Full Title: Non Destructive Assessment of In-situ Concrete Strength: comparison of approaches through an international benchmark
Article Type: Original Research
Keywords: benchmark, concrete strength, engineering practice, non destructive techniques, rebound hammer, ultrasonic velocity
Corresponding Author: denys breysse University of Bordeaux Talence cedex, FRANCE Corresponding Author Secondary
Information:
Corresponding Author's Institution: University of Bordeaux Corresponding Author's Secondary
Institution:
First Author: denys breysse
First Author Secondary Information:
Order of Authors: denys breysse
Jean Paul BALAYSSAC Samuele Biondi Adorjan Borosnyói Elena Candigliota Leonardo Chiauzzi Vincent Garnier Michael Grantham Oguz GUNES Vincenza Luprano Angelo MASI Valerio Pfister Zoubir Mehdi Sbartai Katalin Szilagyi Maxime Fontan Order of Authors Secondary Information:
Funding Information:
Abstract: Strength assessment of concrete in existing structures is a key issue. Many non destructive techniques (NDT) are available which can provide information about the material condition and several approaches can be used to derive strength estimates from NDT test results. However, common practice suffer from many drawbacks: (a) it is difficult to ascertain the level of accuracy/confidence of concrete strength estimates, (b) one lacks established guidelines for estimating the concrete strength variability, (c) the
problems. A benchmark was carried out in order to compare (a) how experts define and can carry out an NDT investigation program and (b) how experts derive strength values from the NDT measurements. The benchmark was based on synthetic simulations which reproduced a synthetic data set corresponding to a grid of twenty 3m-high columns defining a single-storey building structure. The comparison of the various strategies and the analysis of results enabled identification of the most influential parameters that define an investigation approach and influence its efficiency and accuracy. A special emphasis was placed on the magnitude of the measurement error. A model of the investigation strategy is proposed, that will be detailed in future guidelines. A companion paper, based on more extensive Monte-Carlo simulations, will analyze and quantify the efficiency of the investigation strategies with respect to both average strength and strength variability assessment
Additional Information:
Question Response
Provide the total number of words in the manuscript (excluding figure caption and table caption)?
The paper contains 9379 including all.
It is submitted as the first part (not specified) with a second part which has been submitted yesterday by Maitham Al WAsh.
The secon paper is shorter and the total length of both papers is OK with journal requirements.
Provide total number of FIGURES? 11 Provide total number of TABLES? 4
Non Destructive Assessment of In-situ Concrete
Strength: comparison of approaches through an
international benchmark
D. Breysse1, J.P. Balayssac2, S. Biondi3, A. Borosnyói4, E. Candigliota5, L.
Chiauzzi6, V. Garnier7, M. Grantham8, O. Gunes9, V. Luprano10, A. Masi6, V.
Pfister10, Z.M. Sbartai1, K. Szilagyi4, , M. Fontan11
1 University of Bordeaux, CNRS UMR 5295, 33400 Talence, France,
2 INSA-University Paul Sabatier, LMDC, Toulouse, France,
3 University Gabriele d’Annunzio, Chieti, Pescara, Italy, [email protected] 4 Budapest University of Technology and Economics, Hungary,
5 ENEA, SSPT-MET-ISPREV, Bologna, Italy, [email protected] 6 University of Basilicata, Potenza, Italy, [email protected]
7 Université de la Méditerranée, Aix en Provence, France,
8 Concrete Solutions, Margate, Kent, U.K.,
9 Istanbul Technical University, Istanbul, Turkey, [email protected] 10 ENEA, SSPT-PROMAS-MATAS-NDT Lab, Brindisi, Italy,
11 Oxand France, Avon, France, [email protected] Abstract
Strength assessment of concrete in existing structures is a key issue. Many non destructive techniques (NDT) are available which can provide information about the material condition and several approaches can be used to derive strength estimates from NDT test results. However, common practice suffer from many drawbacks: (a) it is difficult to ascertain the level of accuracy/confidence of concrete strength estimates, (b) one lacks established guidelines for estimating the concrete strength variability, (c) the best way to combine NDT methods and coring remains an open issue. The RILEM TC 249 “Non destructive in situ strength assessment of concrete” is addressing these problems. A benchmark was carried out in order to compare (a) how experts define and can carry out an NDT investigation program and (b) how experts derive strength values from the NDT measurements. The benchmark was based on synthetic simulations which reproduced a synthetic data set corresponding to a grid of twenty 3m-high columns defining a single-storey building structure. The comparison of the various strategies and the analysis of results enabled identification of the most influential parameters that define an investigation approach and influence its efficiency and accuracy. A special emphasis was placed on the magnitude of the measurement error. A model of the investigation strategy is proposed, that will be detailed in future guidelines. A companion paper, based on more extensive Monte-Carlo simulations, will analyze and quantify the efficiency of the investigation strategies with respect to both average strength and strength variability assessment, in order to draw conclusions based on rational analyses rather than on the element of chance.
Keywords
Manuscript Click here to download Manuscript Benchmark-first
paper-MatStruct-final text.pdf Click here to view linked References
1 2 3 4 5 6 7 8 9 10 11 12 13 14 15 16 17 18 19 20 21 22 23 24 25 26 27 28 29 30 31 32 33 34 35 36 37 38 39 40 41 42 43 44 45 46 47 48 49 50 51 52 53 54 55 56 57 58 59 60 61
benchmark, concrete strength, engineering practice, non destructive techniques, rebound hammer, ultrasonic velocity
1. Introduction
Strength assessment of concrete in existing structures is a key issue, significance of which has been highlighted by the increasing concern for seismic vulnerability and/or ageing of buildings. Many non destructive testing (NDT) techniques can provide information about the material condition ((IAEA, 2002), (Breysse, 2012a)). Many possibilities also exist for deriving material properties from the NDT test results. A European Standard (EN13791, 2007) as well as some studies in the technical literature (Masi and Chiauzzi, 2013) explains how to combine NDT results and core strength measurements in order to estimate characteristic strength. However, not only the minimum number of core samples required by this standard remains much larger than that commonly available in engineering practice, but also the following three main drawbacks hinder common and efficient use of NDT:
- the NDT measurements are influenced by many factors other than concrete
strength, the most common being carbonation and moisture content, and there is no universal conversion model that accounts for these parameters when estimating strength from NDT test results,
- although there are guidelines or standards that describe how an individual
measurement with a given technique must be carried out, there is no guideline explaining how to define and carry out the investigation programme,
-‐ no rules exist establishing the relationships between (a) the quantity of NDT information made available after tests, (b) the methodology for processing NDT results and (c) the level of accuracy/confidence on concrete strength estimates. In other words, nobody can be sure that a pre-defined investigation programme will guarantee the quality of concrete strength estimates.
This last issue has reached a particularly high importance with the development of the “Knowledge Level” (KL) concept ((Biondi, 2008), (Romao, 2012)). This concept was developed in the framework of seismic evaluation for existing buildings ((FEMA310, 1998), (CEN, 2005), (OPCM3274, 2003)). While carrying out a seismic evaluation of an as-built structure three knowledge levels, from KL1 Limited Knowledge to KL3 Full Knowledge, are defined which correspond to a more or less extensive knowledge, regarding building geometry, member details and material properties. Based on the defined KL, the appropriate confidence factor (CF) can be adopted in the evaluation process. CF applies to the mean strength obtained from in situ tests and from the additional sources of information to determine the design strength to be used in the calculation of the structural capacity. Thus, investing some time and monetary resources to increase the knowledge level may result in future savings in future possible strengthening interventions. One main limitation is that, regarding material properties, these KLs are only defined in terms of quantity of tests to be performed (number of tests or percentage of components to be tested within a certain area of the structure under examination) and they do not really address the issue of knowledge provided by additional non destructive tests.
The issue of material variability is highlighted in existing structures, especially older ones, since additional variability due to the effects of loading history and 1 2 3 4 5 6 7 8 9 10 11 12 13 14 15 16 17 18 19 20 21 22 23 24 25 26 27 28 29 30 31 32 33 34 35 36 37 38 39 40 41 42 43 44 45 46 47 48 49 50 51 52 53 54 55 56 57 58 59 60 61 62
environment may be superimposed to the as-built variability resulting from the building process. Ability to correctly assess this variability is a real challenge, because of its significance from safety viewpoint and for correct identification of “homogeneous domains” (i.e. areas or set of components for which the concrete can be considered to have the same characteristics) in an existing structure. NDT has proved its ability to identify concrete variability (Masi and Chiauzzi, 2013; Nguyen et al, 2013), but the issue remains very complex because of both measurement errors and repeatability of in-situ measuremements. Since any NDT test results contain some uncertainty (reduced for high quality tests, but always present), the variability in test results is generally larger than the real concrete variability, and it is very difficult to identify what really comes from the material, and what is only an artifact. As it has been clearly identified (Breysse, 2012b; Breysse and Martinez-Fernandez, 2013), the measurement uncertainties also influence the quality of the conversion model (i.e. of laws used to derive strength from NDT results) and therefore the efficiency of the NDT investigation program. A by-side consequence is that there is no consensus among experts about the usefulness of combining several NDT techniques, in order to improve the knowledge and reduce uncertainties on strength estimates: while results from certain studies seem to show that combining several NDT methods (like rebound measurements and ultrasonic pulse velocity in the well-known SonReb approach) is effective, results from other studies lead to opposite conclusions (Alwash et al, 2015). These controversial statements remain to be clearly explained.
In the past, RILEM Technical Committee had already addressed the issue of in situ concrete strength estimates (Facaoaru, 1983, Facaoaru, 1993), but their recommendations do not cover these new challenges. It is the reason why TC-249 ISC (Non destructive in situ strength assessment of concrete) was created. It aims at preparing guidelines that can be used in common engineering practice and works in close collaboration with CEN Committee in charge of updating the existing EN13791 standard. It more specifically addresses the issues of (a) existing “old” structures, (b) real mean strength values, that are used in the evaluation of existing structures, as opposed to characteristic values that are used in design rules, (c) spatial variability of concrete strength in the structure, (d) quality/confidence of estimation, (e) effectiveness of combining several NDT methods.
The TC members have decided to carry out a benchmark in order to compare their approaches and to build a collective knowledge about the main factors which contribute to the efficiency of the investigation approach. This covers: (a) the definition of the NDT measurement strategy (where? How? How many?), (b) the measurement analysis and processing, (c) the development and use of a conversion model in order to derive strength estimates. In the following, “NDT investigation approach” is considered as all means, methods and models implemented in order to estimate concrete properties. This paper presents the main elements of this benchmark while a companion paper will simulate the strategies proposed by some experts in order to evaluate their efficiency regarding concrete strength assessment and to further analyze the role of most influential factors. 1 2 3 4 5 6 7 8 9 10 11 12 13 14 15 16 17 18 19 20 21 22 23 24 25 26 27 28 29 30 31 32 33 34 35 36 37 38 39 40 41 42 43 44 45 46 47 48 49 50 51 52 53 54 55 56 57 58 59 60 61
2. NDT investigation methodologies for concrete
strength assessment
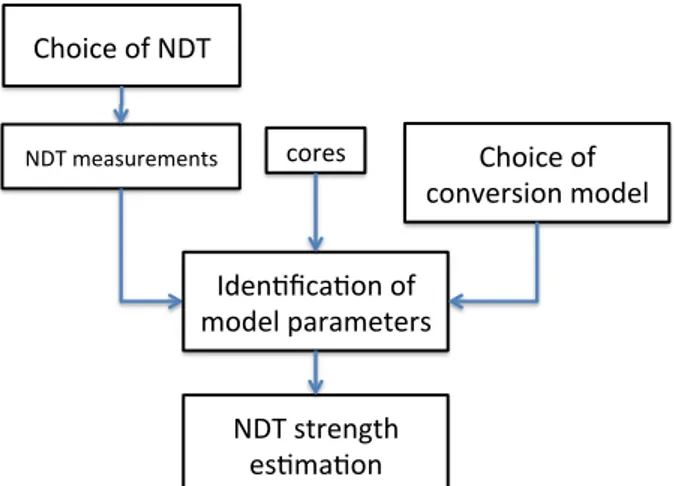
The NDT investigation approach covers a series of steps which are summarized in Figure 1. These steps include the selection of methods, the measurements, the analysis and processing of results, and the derivation of strength estimates. At each step, the expert has many options, each of which may influence the final quality of the estimate and no guidelines are provided regarding what option may be preferable. It must be added that the NDT investigation program is complementary to destructive tests like those on concrete cores.
The first step is the selection of NDT methods. It is not simply a choice between rebound hammer, ultrasonic pulse velocity, or pull out tests, to cite only the most common ones. The expert must, first of all, define what part of the total resource (in time and/or monetary resource) will be devoted to NDT against that devoted to drilling and core strength tests. He must also define how many tests will be carried out, where, and in what sequence. A possibility, as it will be seen later, could be to use NDT for a preliminary screening, in order to get data for a more adequate definition of core location (Masi and Chiauzzi, 2013; Pfister et al, 2014). According to the complementarity between NDT and cores, once the NDT test results and core strength data are available, the experts must then identify the parameters of a conversion model which will be used to derive strength estimates at locations where only NDT results are available. The quality of this model is a key-issue, since a main advantage of NDT is that it makes possible to cover the entire structure to get a more representative picture of the strength profile in the structure. Many options also exist at this step, since the expert can choose among many different mathematical models (Breysse and Martinez-Fernandez, 2013) and many ways to calibrate the model parameters (EN13791, 2007) or develop a custom methodology by combining data from different NDT methods. However, there still are no guidelines that provide the advantages and limitations of each of these options.
Figure 1. Model describing the man steps of an investigation strategy
We decided to investigate these issues, in order to gain new knowledge, and to develop useful guidelines. Experimental learning proved to be a good way for a better understanding, but it was also challenging since each case has specific differences regarding some of its features (type of structure, type of materials,
NDT$measurements$ Choice$of$NDT$ cores$ Choice$of$ conversion$model$ Iden7fica7on$of$ model$parameters$ NDT$strength$ es7ma7on$ 1 2 3 4 5 6 7 8 9 10 11 12 13 14 15 16 17 18 19 20 21 22 23 24 25 26 27 28 29 30 31 32 33 34 35 36 37 38 39 40 41 42 43 44 45 46 47 48 49 50 51 52 53 54 55 56 57 58 59 60 61 62
environment, building age, loading and damage history…). It is the reason why we have chosen, in parallel with discussion from detailed real case-studies (Luprano et al, 2008; Masi and Vona, 2009; Biondi and Candigliota, 2008a and 2008b), to develop a benchmark approach.
3. Benchmarking the investigation methodologies
through a synthetic case-study
The objective of the benchmark study was to compare the practice of several experts regarding the overall investigation outlined in Figure 1, in order to identify the pros and cons of each option and to derive information about the best practices. One main difficulty stems from the availability of extensive datasets and their consistent comparison (for instance, how to do if the case study does not contain any ultrasonic pulse velocity measurement ? of if the concrete is carbonated ?).
The second limitation is even more challenging: even when an extensive data set is available, the “true” strength always remain unknown. It is impossible to find a case where the “true core strength” is known everywhere, because the number of cores is always limited and because the core strength measurement process itself introduces some measurement uncertainties. Since one of our aims is to quantify the efficiency of each option, the “deviation” between true strength values and strength estimates must be known. It is the reason why we used synthetic simulations.
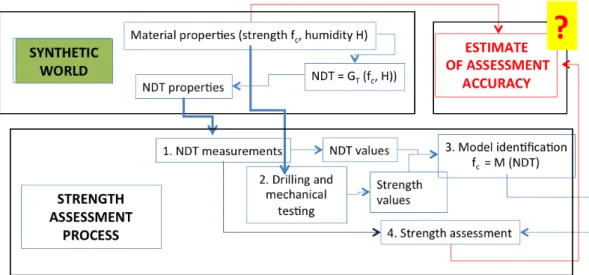
The idea of synthetic simulations has been advocated (Breysse and Martinez-Fernandez, 2013) to be very efficient for a better understanding of the NDT investigation approach. It consists of developing in-silico a “synthetic world” (fig. 2) reproducing as closely as possible the main features of the real world, including: (a) material physical properties, (b) NDT properties and measurement process, (c) implementation of the NDT investigation approaches. In the synthetic
world, GT is the set of functions which express how the NDT properties depends
on strength and other influential factors. In the strength assessment process, M is the conversion model identified from measurements in order to describe how strength depends on NDT measured properties.
The main advantage of synthetic simulations is twofold. First, the “true values”, unknown to the expert who assesses strength, can be revealed and the quality of the assessment can be evaluated by comparing “true” and estimated strength. The second advantage is that simulations can be repeated many times, for instance through a Monte-Carlo process, in order to perform statistical analysis, reducing the influence of chance. The conclusions will thus be more solid than a conclusion drawn on a single case-study, even a real one.
1 2 3 4 5 6 7 8 9 10 11 12 13 14 15 16 17 18 19 20 21 22 23 24 25 26 27 28 29 30 31 32 33 34 35 36 37 38 39 40 41 42 43 44 45 46 47 48 49 50 51 52 53 54 55 56 57 58 59 60 61
Figure 2. Illustration of the use of synthetic simulation for strength assessment
For details of the synthetic simulator process, the reader is referred to previous specific publications ((Breysse and Martinez-Fernandez, 2013), (Alwash et al, 2015)). The main features of the simulator will however be summarized in the companion paper. The next section provides the details of how the simulator is used in the particular case of this benchmark.
3.2. Presentation of the case-study: assessment of a single-stoprey building structure
3.2.1. Description of the structure and target of the assessment
The benchmark is based on synthetic simulations. The synthetic structure is a single-storey frame structure in which only columns are considered. The building plan is rectangular, with 20 columns in five rows (from A to E) of four columns (from 1 to 4), with a uniform spacing of 6 meters and a height of 3 meters. The
cross-section dimensions of the columns are 35x35 cm2. The building is un-heated
in a temperate climate. From visual inspection, a vertical gradient of properties may be expected in the columns as a result of concrete casting and compaction and a humidity gradient may be suspected between the extreme areas of the structure. The carbonation effect is neglected.
Each contributor can choose among taking cores and/or performing NDT measurements, using ultrasonic pulse velocity, rebound hammer or pull-out tests. The location of cores can be either predefined before the starting the investigation or can be conditional, i.e. defined only after a first series of NDT measurements, based on the analysis of test results. In this case, the player must explicit tell how the core sampling location is chosen (what column, what elevation). It is also possible to perform non destructive tests on cores in conjunction with the mechanical tests. In this case, the cost and quality of techniques is identical to that on site. All data (i.e. synthetic measurement results) are affected by some measurement uncertainties, reproducing on site conditions. An important choice concerns the quality level of the measurement (low / average / high), based on the fact that a lower quality implies a lower cost but larger measurement errors. Formulation of the investigation plan thus involves an appropriate combination of the number, type and quality of measurements to the extent allowed by the 1 2 3 4 5 6 7 8 9 10 11 12 13 14 15 16 17 18 19 20 21 22 23 24 25 26 27 28 29 30 31 32 33 34 35 36 37 38 39 40 41 42 43 44 45 46 47 48 49 50 51 52 53 54 55 56 57 58 59 60 61 62
available resources. Once a contributor receives a dataset of measurement results, he is free to use any method for deriving strength estimates (average, variability, extreme values). The available techniques are (the device is fixed):
-‐ UPV measurements (direct transmission measured by placing the two
transducers on opposite sides), which provides a velocity in m/s,
-‐ rebound hammer measurements (that can be performed on any of the four
sides of a column), which provides a rebound number,
-‐ pull-out test (Capo), which provides a load in kN,
-‐ coring and mechanical tests (the cost covers both drilling, storage and
mechanical compression tests), provide a compressive strength in MPa. 3.2.2. Implementation of the benchmark
The synthetic data set was generated once and was common for all participants, as if they had to work on the same building for a real case-study. All synthetic data are unknown to benchmark contributors who were asked to: (a) define their investigation strategy, (b) derive strength estimates from the data that they receive. The investigation and evaluation process were iterated three times, using an increasing amount of monetary resources, in relation with the concept of knowledge levels (KL) described in the introduction. Each contributor was asked, at each step, to estimate both the average concrete strength and the standard deviation, before addressing his/her request for data for the next step.
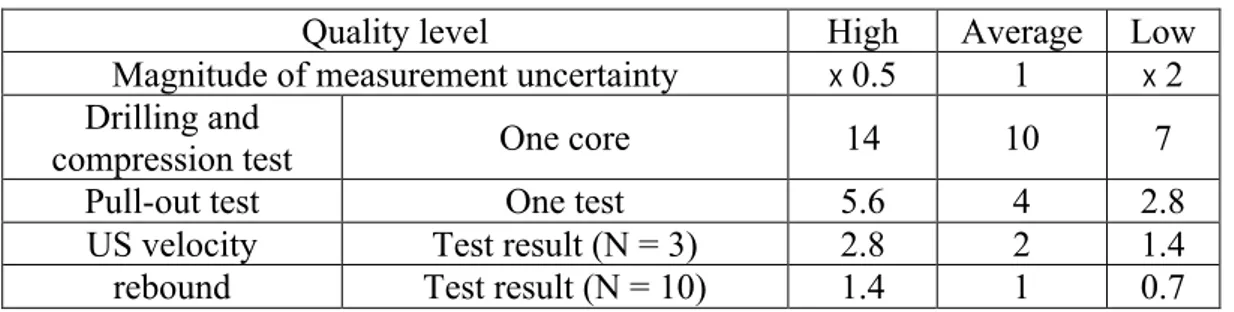
All investigation costs were defined in Cost Units (CU). The total amount of resource available varied with the KL value, which was 20 CU for KL1, 40 CU for KL2 and 60 for KL3. The unit cost of a test depends on the test type and on the quality of the test (Table 1). The test result is the average value of N individual test readings performed at the same location, with N = 10 for rebound and N = 3 for ultrasonic velocity. The costs were chosen considering, for each KL, the number of tests consistent with what is commonly specified by standards (CEN, 2005) or by practice (Biondi, 2008).
Table 1 . Unit costs and uncertainty level for all tests
Quality level High Average Low
Magnitude of measurement uncertainty X 0.5 1 X 2
Drilling and
compression test One core 14 10 7
Pull-out test One test 5.6 4 2.8
US velocity Test result (N = 3) 2.8 2 1.4
rebound Test result (N = 10) 1.4 1 0.7
3.3. Synthetic data set generation process
3.3.1. Simulated features
This section briefly describes how synthetic data were generated. It was assumed that only one concrete mix was used for all columns but it is known that, due to the casting process, three types of variability can exist (Bartlett and McGregor, 1994): 1 2 3 4 5 6 7 8 9 10 11 12 13 14 15 16 17 18 19 20 21 22 23 24 25 26 27 28 29 30 31 32 33 34 35 36 37 38 39 40 41 42 43 44 45 46 47 48 49 50 51 52 53 54 55 56 57 58 59 60 61
-‐ a batch-to-batch variability corresponding to a difference between various series of columns.
-‐ a within-batch variability, corresponding to differences between columns of the same batch,
-‐ a within column variability, with a degree of compaction that can vary according to the elevation. Literature has documented the fact that the casting process usually results in a denser and stronger concrete in the lower third of the column height and a lower density and strength for the concrete in the upper third.
All these elements remained unknown to contributors who relied only on their own knowledge, from real field practice or literature. The respective magnitudes of the three sources of variability were chosen in agreement with information from the literature (Bartlett and McGregor, 1994), and it was checked that the resulting concrete strength patterns were consistent with reality. In a given batch,
the concrete strength f! is generated by assuming a Gaussian distribution
N(f!", s(f!)). Moisture content was assumed to vary between columns while remaining uniform in each column.
At each possible test location (at 20cm vertical spacing on each column), synthetic values for the ultrasonic velocity V, rebound number R and pull-put force F are produced using non linear relationships established after an in-depth literature review on the physics involved (Alwash et al, 2015). In these relationships, velocity and rebound depend on both concrete strength and humidity.
As in the real world, measurement errors are added to the true synthetic values of V, R and F whose magnitudes depend on the quality of measurements. These errors are assumed to have Gaussian distribution N(0, s(R) or s(V) or s(F)). The standard deviation is respectively 100 m/s, 2 units and 1 kN for US, R and F for average quality measurements and changed according to Table 1 for low quality or high quality measurements. These values are consistent with estimations drawn from a variety of extensive investigation programs (Balayssac et al, 2015). The same happens for compressive strength measured in the laboratory with s(fc) = 1.5 MPa for average quality measurements.
Finally, the “true” synthetic dataset is a series of NT 4-uplets (V, R, F, f!), with
NT = 620 corresponding to thirty-one 10cm-spaced test locations on each of the 20 columns. The “measured” synthetic dataset is simply derived from this initial dataset by adding random errors. For deriving compression strength results, it is assumed that coring induces no bias or noise, and that changes in strength are only due to storage conditions, with three options since the compression test can be carried out in different specimen saturation degrees: saturated, as close as possible as on site, or air-dried.
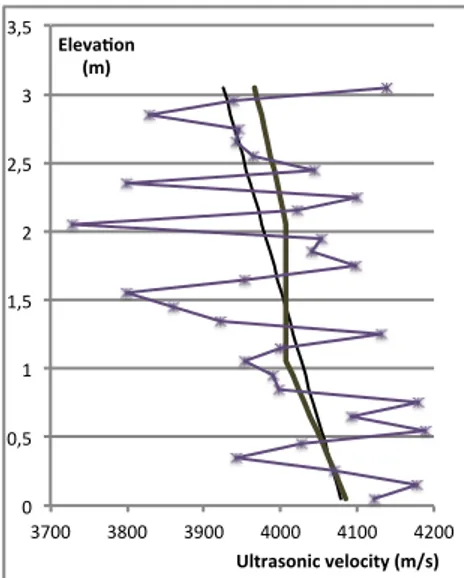
Figure 3 illustrates what is finally obtained in the case of velocity for a specific column. While the true velocity reflects the vertical variation in strength from about 26 MPa at the bottom end to 24 MPa at the top, with about 100 m/s difference between the two ends, the measurement errors induce a high noise level. It must be reminded that 100 m/s is the value of the standard deviation of velocity measurements for average quality measurements. In this case, the vertical trend (thin line) could probably be captured through a regression analysis on the 1 2 3 4 5 6 7 8 9 10 11 12 13 14 15 16 17 18 19 20 21 22 23 24 25 26 27 28 29 30 31 32 33 34 35 36 37 38 39 40 41 42 43 44 45 46 47 48 49 50 51 52 53 54 55 56 57 58 59 60 61 62
full data set (31 test results) but in practice, the expert will probably get only one or two measurements on this column, and the noise to signal ratio will surely have some consequences. One must of course keep in mind that the situation is similar to what happens on real structures and that, in this case, the true profile is unknown.
Figure 3. Profile of true velocity (thick continuous line), measured velocities (points) along a column and linear regression from full dataset (thin line)
3.3.2. Illustration of variability and uncertainty
The synthetic process has been designed in order to capture and reproduce two main features: variability and uncertainty. Variability refers to the fact that true material properties, due to intrinsic reasons or to the influence of the environment (here the moisture content), are not uniform. As explained in the previous section, three levels of material variability were considered in this simulation. Uncertainty refers to the fact that true values can never be known, since the measurement process, once the measuring device has been properly calibrated, has some random errors. Variability is one target of the investigation program, while uncertainty may prevent us from reaching this target.
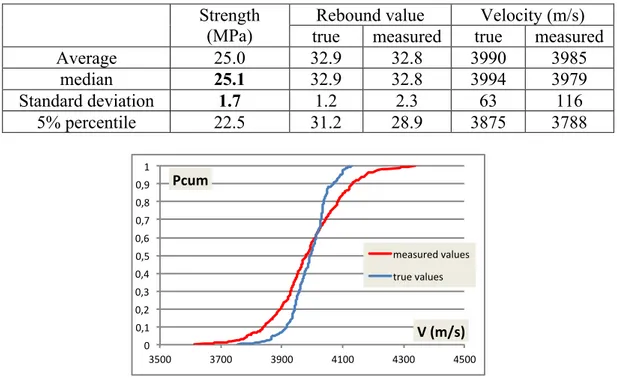
In fact, referring back to Figure 1, the measurement uncertainties arising from any test will influence the values of the conversion model parameter during the model identification stage (it is why the identified values will differ from true ones, even if the model mathematical model is correct). When the conversion model will be used, these uncertainties will propagate and result in the final error on strength estimate. Our main challenge is to understand how these uncertainties propagate all through this process, in order to master them. Table 2 and Table 3 synthesize some information about the variability and uncertainty. Table 2 quantifies the statistical distributions of strength, rebound index and velocity, both for true NDT properties and measured NDT properties. It is easy to see that the effect of measurement uncertainties is to increase the standard deviations for both NDT techniques, since they are approximately doubled in the case of average quality measurements. This effect would be stronger for low quality measurements. Figure 4 plots the cumulated distribution of true and measured velocities and leads to similar statements. 0" 0,5" 1" 1,5" 2" 2,5" 3" 3,5" 3700" 3800" 3900" 4000" 4100" 4200" Eleva&on) (m)) Ultrasonic)velocity)(m/s)) 1 2 3 4 5 6 7 8 9 10 11 12 13 14 15 16 17 18 19 20 21 22 23 24 25 26 27 28 29 30 31 32 33 34 35 36 37 38 39 40 41 42 43 44 45 46 47 48 49 50 51 52 53 54 55 56 57 58 59 60 61
Table 3 compares the variabilities (through coefficient of variation cv) at three levels: that of a component (average cv on all columns), that of a batch (average cv between all columns of a same batch), that of the whole structure. The real relative contribution of these three levels can be seen in the first column: the within component variability, which comes from the elevation effect (see Figure 3) amounts to about 50% of the total variability, while the between batch variability accounts for the difference between 5.8 and 6.8 (i.e. about 15% of the total variability). These ratios remain practically identical for true values of rebound and velocity, but they are completely different for measured values. In this case, the effect of measurement errors results in a drastic increase in the apparent variability at the lowest level. As a consequence, the contribution of the two other levels (within-batch and batch-to-batch variability) is much less visible. The respective contribution of the three variability levels cannot be correctly appreciated from the measurement results. Another consequence is that, while the variability over the structure is overestimated by a factor about 2 (for instance 2.9 against 1.6 for velocity), the local variability, at the component level is much more overestimated (for instance 2.6 against 0.7 for velocity). This is consistent with Figure 3.
Table 2. Statistical parameters for strength, rebound and velocity (true and measured values, with average quality measurements)
Figure 4. Cumulative distribution of true and measured velocities
Table 3. Coefficient of variation (in %) for true and measured values of strength, rebound number and velocity at three different levels.
True values Measured values
Strength Rebound Velocity Rebound Velocity
component 3.2 1.6 0.7 6.2 2.6 batch 5.8 3.2 1.2 6.8 2.8 structure 6.8 3.8 1.6 7.1 2.9 0" 0,1" 0,2" 0,3" 0,4" 0,5" 0,6" 0,7" 0,8" 0,9" 1" 3500" 3700" 3900" 4100" 4300" 4500" Pcum% V%(m/s)% measured"values" true"values" Strength (MPa)
Rebound value Velocity (m/s)
true measured true measured
Average 25.0 32.9 32.8 3990 3985 median 25.1 32.9 32.8 3994 3979 Standard deviation 1.7 1.2 2.3 63 116 5% percentile 22.5 31.2 28.9 3875 3788 1 2 3 4 5 6 7 8 9 10 11 12 13 14 15 16 17 18 19 20 21 22 23 24 25 26 27 28 29 30 31 32 33 34 35 36 37 38 39 40 41 42 43 44 45 46 47 48 49 50 51 52 53 54 55 56 57 58 59 60 61 62
These statements are useful to understand the two main difficulties (that one also encounters on real case study, even if it is not possible to see them so clearly in real life):
-‐ local measurement errors will alter the quality of conversion model,
-‐ local measurement errors will contribute to a global overestimation of the material true variability.
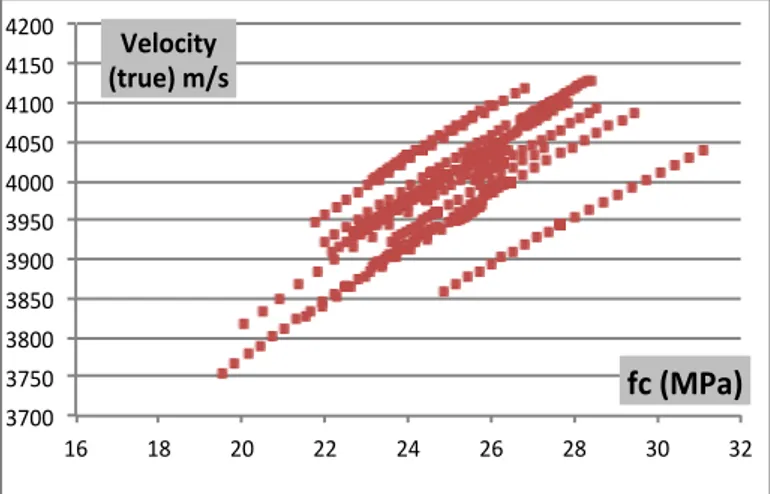
The first statement is illustrated in figures 5 and 6. Both figures plot the existing correlation between velocity measurement and local strength, for true properties (figure 5) and for measured values (figure 6).
Figure 5. Generated data set of true values: correlation between strength and velocity
Figure 6. Generated data set of measured values for strength and velocity (average quality of measurements).
Figure 5 clearly shows the existing correlations which have been used in the synthetic simulator. Each curve on this figure corresponds to a column and illustrates the vertical variation in the component. The variety of curves comes from a difference in moisture, since, for a given concrete strength, the velocity varies with the moisture content. This effect, also existing in real structures (note that the moisture effect can be replaced by or combined with that of carbonation, cracking…), acts as an additional noise: if the moisture content is not identified and corrected, the conversion model will be less efficient. Figure 6 exhibits a very different pattern: because of measurement errors, the correlation between the two
3700$ 3750$ 3800$ 3850$ 3900$ 3950$ 4000$ 4050$ 4100$ 4150$ 4200$ 16$ 18$ 20$ 22$ 24$ 26$ 28$ 30$ 32$ Velocity) (true))m/s) fc)(MPa)) 3500$ 3600$ 3700$ 3800$ 3900$ 4000$ 4100$ 4200$ 4300$ 4400$ 4500$ 16$ 18$ 20$ 22$ 24$ 26$ 28$ 30$ 32$ Velocity) (meas))m/s) fc()MPa)) 1 2 3 4 5 6 7 8 9 10 11 12 13 14 15 16 17 18 19 20 21 22 23 24 25 26 27 28 29 30 31 32 33 34 35 36 37 38 39 40 41 42 43 44 45 46 47 48 49 50 51 52 53 54 55 56 57 58 59 60 61
properties is much less visible. Comparison of the standard deviations (sd) of rebound values and velocities for different qualities of measurements leads to :
-‐ for rebound: sd = 1.2 for true values and 1.6, 2.3 and 4.1 for high, average and low quality of measurements, respectively,
-‐ for velocity: sd = 63m/s for true values and 79m/s, 116m/s and 207m/s for high, average and low quality of measurements, respectively.
Since the conversion models are identified and calibrated from a limited set of data taken from the full data set, these uncertainties will propagate with a higher impact as the measurement quality decreases.
One must consider one last issue. In the benchmark, the dataset generated by the random process has been fixed (corresponding to a unique simulation), in order to provide the same database to all contributors. However, test results available for each contributor will differ for two main reasons: (a) the choice of different techniques, locations, quality and number of measurements, (b) effect of chance, which may generate very different random measurement errors at two close test locations. Because of this element of chance, it will be formally impossible to derive definitive conclusions about the absolute or relative efficiency of any investigation approach in this benchmark. Such conclusion would require a large number of repetitions of the same process. This issue is analyzed into more details in a complementary study (AlWash et al, 2016).
4. Analysis of benchmark results
4.1. Possible investigation approaches
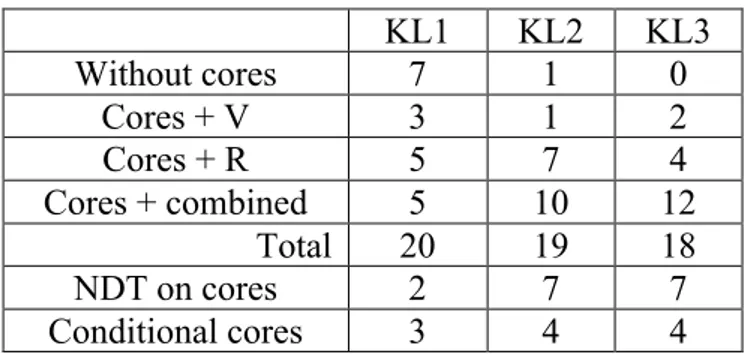
A total of thirteen RILEM ISC-TC members have been involved in this benchmark. In a second stage we had the opportunity to involve six engineers from one consultant engineering company. All contributions were analyzed in the same way. Some contributors have proposed variants in their approaches. The resulting number of contributions was respectively 20, 19 and 18 variants for KL1, KL2 and KL3 levels. Table 4 compiles how contributors have combined destructive and non-destructive tests at the three KL.
Table 4. Number of variants for each type of approach
KL1 KL2 KL3 Without cores 7 1 0 Cores + V 3 1 2 Cores + R 5 7 4 Cores + combined 5 10 12 Total 20 19 18 NDT on cores 2 7 7 Conditional cores 3 4 4
While 7 contributions out of 20 use no cores (only NDT) at KL2, because of the limited amount of resource, all investigations approaches combine cores (destructive tests DT) and NDT at KL3. At this same level, 6 contributors out of 18 use a single NDT (V or R) while the others combine several techniques (V and/or R and/or pull-out). Besides, in average, about 55% of the investigation cost is paid for cores, with an average number of 3 cores. The number of cores varies from 1 to 6 but is between 2 and 5 for 16 cases. The relative amount of resources 1 2 3 4 5 6 7 8 9 10 11 12 13 14 15 16 17 18 19 20 21 22 23 24 25 26 27 28 29 30 31 32 33 34 35 36 37 38 39 40 41 42 43 44 45 46 47 48 49 50 51 52 53 54 55 56 57 58 59 60 61 62
paid for NDT varies from a minimum value of 28% to a maximum value of 80% Of course, increasing this ratio corresponds to a lower number of cores. There is a balance between increasing the number of cores (in order to improve the quality of the conversion model) and increasing the number of NDT measurements (in order to get a better coverage of the structure) and each contribution corresponds to a specific objective and conclusion. A second compromise must be done between quality and quantity of measurements. Because of cost rules (Table 1), higher quality measurements are expensive, which reduces the number of tests. Once again, the choice belongs to who defines the investigation program. At KL3 level, four contributors favored quantity and opted for low quality of measurements. The two last rows in Table 4 indicate when NDT was carried out on cores (as a control of drilling process, before strength measurement) and when core location was determined from a previous series of NDT measurements (conditional coring).
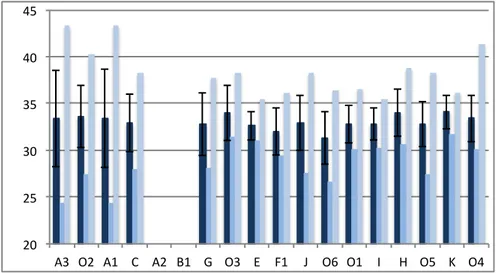
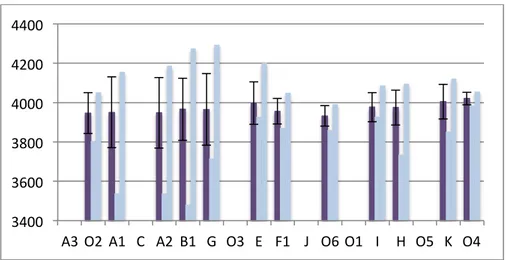
For keeping anonymity, all contributions were coded with letters, from A to K for TC members, and from O1 to O6 for engineers who joined the benchmark. In figures 6 and 7, all contributions are ranked from left to right according to the relative weight of NDT in the investigation program (the contributors on the right part of the figure are those who have privileged NDT in their investigation). Figure 7 and 8 provide the plots for rebound index and velocity measurements respectively, and the statistical properties of test results made available to the contributors (i.e. NDT test results they have paid for). These results can first be compared to those given in Table 2 for the average rebound and velocity values, which are about 32.9 and 3990 m/s, for both true values and measured values. This illustrates that all contributors have received statistically similar datasets.
Figure 7. Statistical properties of rebound index measurements for 16 contributions (A2 and B1 did not measured rebound): average value, minimum and maximum values – error bar corresponds to standard deviation.
Figure 8. Statistical properties of velocity measurements for 13 contributions (others did not measured velocity): average value, minimum and maximum values – error bar corresponds to standard deviation. 20# 25# 30# 35# 40# 45#
A3# O2# A1# C# A2# B1# G# O3# E# F1# J# O6# O1# I# H# O5# K# O4# 1 2 3 4 5 6 7 8 9 10 11 12 13 14 15 16 17 18 19 20 21 22 23 24 25 26 27 28 29 30 31 32 33 34 35 36 37 38 39 40 41 42 43 44 45 46 47 48 49 50 51 52 53 54 55 56 57 58 59 60 61
If more attention is paid to these figures, one can see that there is a common trend toward smaller variations (smaller error bars, smaller variation range between minimum and maximum) when one moves to the right side of the figure. This corresponds to the fact that those who have favored low quality measurements have obtained, in return, a noisier data set. It is however possible (it is the effect of chance discussed above) that, even with average quality measurements, on a small series of measurements, some measurements significantly depart from the true values, as it happens in the form of outliers in real on site case studies.
4.3. Main results
Details of individual approaches are not detailed here. Some of them will be more extensively described and analyzed in (AlWAsh et al, 2016). We will focus here on few important results obtained during the benchmark. The main issue of the benchmark was about the ability of each investigation program to correctly assess the average concrete strength and the strength variability.
Figure 9 plots the estimates provided by the contributors at KL3. The true values, (average strength = 25.1 MPa and standard deviation = 1.7 MPa) are marked in red. The two main results are that:
-‐ the average strength is estimated with at most a ± 10% error by all contributors. This result on its own very significant, since it proves that NDT, when correctly combined with cores, is an efficient way to assess the average strength of concrete. Even the distribution of individual predictions is within the ± 10% interval.
-‐ the standard deviation tends to be overestimated. Although few contributions are close to the true value, the average prediction is about 3.5 MPa which is twice the true value, and some individual predictions are wrong with a 300% relative error. This result is also very interesting. It first shows that the estimation of the concrete strength variability appears much more challenging than that of average strength. The gross overestimation of the variability is mainly due to the propagation of uncertainties during the investigation and assessment process, as discussed previously.
Figure 9. Estimation of average strength and standard deviation for 16 contributions at KL3.
3400 3600 3800 4000 4200 4400
A3 O2 A1 C A2 B1 G O3 E F1 J O6 O1 I H O5 K O4 1 2 3 4 5 6 7 8 9 10 11 12 13 14 15 16 17 18 19 20 21 22 23 24 25 26 27 28 29 30 31 32 33 34 35 36 37 38 39 40 41 42 43 44 45 46 47 48 49 50 51 52 53 54 55 56 57 58 59 60 61 62
We also have specified on the figure three sets of points:
-‐ an open square mark is used for contributors A, B, C and G. These contributors have opted for low quality measurements since this enabled them to get a larger number of measurements. It seems that this resulted in a reduced ability to estimate the concrete strength (large error bars on figures 7 and 8 for these contributions have the same origin). This seems to indicate that increasing the quality of measurements should be a priority against increasing their quantity. Three out of four cases provided average strengths larger than the true value, thus being on the unsafe side when dealing with mean values (e.g. seismic safety verifications complying with EC8-3). It is not useful to further analyze this issue from the result of a unique simulation and it will be discussed in the companion paper, once the simulation will have been repeated a large number of times.
-‐ a black star mark is used for all engineers working for the same consultant company. While they suffer from the same limitation regarding standard deviation assessment, it is remarkable that all average strength assessments are on the conservative side. One possible explanation is that, because of their daily practice, they have a conservative approach when they process the data. This can be illustrated by the specific case of contributor (O6) who has chosen to take all cores and most of NDT measurements in the upper part of columns, arguing that there would be the weaker part of the components. He was clearly right, and captured the average strength of the upper part, which is slightly lower than the average strength for the structure.
4.4. Choice of NDT methods, conversion model and their influence
4.4.1. Influence of the NDT method
The contributors could choose between rebound measurements, velocity measurements, pull-out measurements, and they could combine them. This resulted in a large variety of combinations. It appears that the choice of a specific technique instead of another had no significant influence in the case-study under examination. As a result, it is not possible to say that one technique should be favored or, reversely, avoided.
The validity of this statement obviously depends on the influence of the measurement errors for each method, as they were given at Section 3.3.1 and
TRUE% O1% O2% O3% O4% O5% O6% A% B% C% E% F% G% H% I% J% K% 0% 1% 2% 3% 4% 5% 6% 20% 21% 22% 23% 24% 25% 26% 27% 28% standard' devia+on' (MPa)' average'strength'(MPa)' 1 2 3 4 5 6 7 8 9 10 11 12 13 14 15 16 17 18 19 20 21 22 23 24 25 26 27 28 29 30 31 32 33 34 35 36 37 38 39 40 41 42 43 44 45 46 47 48 49 50 51 52 53 54 55 56 57 58 59 60 61
Table 1, i.e. a standard deviation of the measurement error which is respectively 100 m/s, 2 units and 1 kN for US, R and F for average quality measurements and multiplied by 0.7 or 1.4 for high quality and low quality measurements, respectively. However, these quantities had been carefully chosen after a discussion between TC members, in order to be representative of what can be expected in real practice, and to minimize bias between NDT methods. They are also consistent with what can be estimated when this issue is specifically addressed during investigation.
The choice of the specific NDT method therefore appears to be of secondary importance when compared with the measurement error magnitude.
4.4.2. Influence of the conversion model
In the scientific and technical literature, there is no consensus about the way strength estimates can be derived from NDT measurements. Generally speaking, three types of general approaches can be used in order to assess strength values from NDT measurements :
(a) use a pre-defined model (prior model), without any calibration, (b) use a pre-defined model after calibration,
(c) build a specific model.
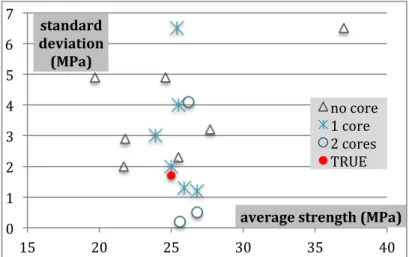
The first option corresponds to the use of a predefined relationship or chart (like that provided with a commercial device or like the SonReb diagram which was promoted by RILEM (Facaoaru, 1983)). This option is of course the only possible option when one has no core. Figure 10 plots, in the same diagram, the estimations of average strength and standard deviation provided at KL1. Only 16 contributions are visible since some contributors reached inconclusive results. At KL1, the maximum number of cores is two, and 7 contributors used no core. When compared to Figure 9, Figure 10 appears as being much more scattered on both axes (the scales are different, for practical reasons). This confirms the interest of having more tests, as could be expected. Besides, it can be seen that when no cores are available, the error on the average strength may be very large. Using one core tends to reduce this uncertainty, even if the assessment of strength variability is totally wrong. The results are not improved with two cores, but a reason is that these contributions also correspond to the choice of the low quality of measurements, due to the cost of tests.
Figure 10. Estimation of average strength and standard deviation for 16 contributions at KL1.
0 1 2 3 4 5 6 7 15 20 25 30 35 40 standard deviation (MPa)
average strength (MPa)
no core 1 core 2 cores TRUE 1 2 3 4 5 6 7 8 9 10 11 12 13 14 15 16 17 18 19 20 21 22 23 24 25 26 27 28 29 30 31 32 33 34 35 36 37 38 39 40 41 42 43 44 45 46 47 48 49 50 51 52 53 54 55 56 57 58 59 60 61 62
Therefore it appears absolutely mandatory to use at least one core. This enables the second option (calibration of a prior model). The last option (development of a specific model) requires a minimum number of cores equal to the number of parameters of the model. These two options have been approximately equally chosen by the contributors at KL3, but five out of the six engineers have preferred a calibration approach, as it is proposed in EN13791 standards. In all cases, the model error, which mainly stems from the uncertainty in the model parameters influences the quality of assessment.
When using a calibration approach, one requires a prior model M(NDT), from
which fc est i is derived at each point where a test results is available. The prior
model can be a chart or a law taken from literature or it can be derived from expert knowledge. Two common types of calibration are drift calibration and multiplying factor calibration. The mean estimated value is calculated from the N estimated local values:
fc est m = 1/ N Σ fc est i
For drift calibration, the calibration factor Δ is calculated as: Δ = fc m - fc est m
where fc m is the average of strength values obtained on cores. Finally, the model
is calibrated as:
M’(NDT) = M(NDT) + Δ
For multiplying factor calibration, the calibration factor k is calculated : k = fc m / fc est m
where fc m is the average of strength values obtained on cores. Finally, the model
is calibrated as:
M’(NDT) = k x M(NDT)
The alternative is to identify a specific model. A variety of models can be used, according to: (a) the number and type of NDT parameters used, (b) the mathematical expression of the model. The specific features of each model are not analyzed here, as we prefer to focus on more transverse statements:
(a) since model parameters are identified by minimizing the error between estimated and measured strength on a limited set of cores, at least two cores are
required for a monovariate conversion model (i.e. f c = a Rb or fc = a’ exp
(b’V)) while a bivariate model needs at least three parameters (i.e. f c = a Rb
Vc) and thus three cores;
(b) the quality of fit tells nothing about the predictive ability of the model for estimating strength where only NDT results are available. Here, the role played by the number of cores and the measurement error is of prime importance; (c) conditional coring, used for instance to take cores where NDT results reveal extreme values may be beneficial, since it can increase the range of variation of strength covered by the regression and have stabilizing effects on the model. 4.4.3. Innovative approaches
Some experts have developed interesting variants, which are briefly discussed below. The results obtained by these experts may not be the best ones since, due 1 2 3 4 5 6 7 8 9 10 11 12 13 14 15 16 17 18 19 20 21 22 23 24 25 26 27 28 29 30 31 32 33 34 35 36 37 38 39 40 41 42 43 44 45 46 47 48 49 50 51 52 53 54 55 56 57 58 59 60 61
to the random nature of the benchmark (in particular regarding measurement errors), the repetition of a large number of simulations is required before drawing relevant conclusions. This issue will be detailed in the companion paper.
Contributor B used conditional coring, on the basis of an extensive series of NDT measurements (US velocities), the choice of core location being made in order to cover the range of variation of material properties as revealed by NDT results. Another interesting option was to compute the strength estimation with a weighted average between direct strength values (on cores) and strength estimates (through NDT and conversion models) while considering that these two sources of information have a different level of confidence/reliability.
Contributor K used data fusion (Ploix et al., 2011) to analyze strength estimates derived from different types of NDT measurements, by considering their overall consistency. The principle of data fusion is to simultaneously calibrate all the different conversion models (for the different NDT used), on all measurement points, by maximizing the consistency between the assessment obtained by all techniques independently.
Contributor I developed a specific approach combining the three possible NDT (R, V and pull-out) and cores (1 core at KL2 and 2 cores at KL3). The small number of cores prevents the identification of any relevant regression model, but it however provides some estimate of the expected average which can be used for calibration at KL2 and KL3, while pull-out is considered as a possible reference test (1 pull out at KL1, 3 pull out at KL3) which can provide an alternative « reference strength », by using a prior model, derived from literature. At test locations where R and V measurements were available, a bi-variate model was calibrated against reference strength value (on cores or, if no core is available on pull out values). At points where only R was available a specified linear model
fc(R) was fitted and used for estimating strength. At the end of the process, at KL2
and KL3 levels, one got four types of strength values : direct ones on cores (respectively 0, 1 and 2 at the three KLs), from pull out (resp. 1, 1, 3), from R and V combined (resp. 4, 4, 5), from R only (resp. 4, 5, 6). This approach benefited from available information.
Contributor O4 also developed a composite approach, in which he used Bayesian updating. The idea is that, while more information progressively becomes available from KL1 to KL3, this information can progressively be used to update and refine the assessment. At KL1, he had only a prior model (curve from the manufacturer for rebound hammer). At KL2, he carried out some additional velocity measurement and used the prior SonReb model of RILEM. At KL3, he got some cores. At each step, the new information is used in order to modify and enrich the prior estimate, in the Bayesian framework.
Due to the very wide variety of approaches, it was not possible, on the basis of the benchmark of the result analysis, to derive definite conclusion about the relative merits of these approaches. It is however important to keep them in mind as potentially interesting refinements of the investigation approach.
1 2 3 4 5 6 7 8 9 10 11 12 13 14 15 16 17 18 19 20 21 22 23 24 25 26 27 28 29 30 31 32 33 34 35 36 37 38 39 40 41 42 43 44 45 46 47 48 49 50 51 52 53 54 55 56 57 58 59 60 61 62
4.5. Identification of a NDT investigation approach model
The analysis of all contributions was used in order to update the former investigation model of Figure 1. The result is a more detailed flowchart, illustrated on Figure 11. When compared to the previous one, two main differences appear: (a) the possibility of opting for conditional coring, which implies the definition of core location only after a preliminary NDT investigation, (b) the possibility of keeping a control sample, with additional cores and NDT test results not used during the model identification set. This control sample can be used at the last step of the process, in order to estimate the quality of the strength assessment. Considering these two options changes the way experts can use NDT measurements. The whole NDT measurement part of the investigation program into three stages:
-‐ a somehow extensive NDT series of measurements can be carried out at the beginning, in order to cover the structure and to identify adequate location for cores. At this stage, it would probably be preferable to use a quick and low cost technique, in order to get a better spatial coverage; -‐ additional NDT measurements can be done to extend the NDT
measurements data set, NT being the number of test results and NC being the number of cores. NC is much smaller than NT;
-‐ the conversion model is identified by using NC’ cores (NC’ < NC), in order to keep (NC – NC’) cores as a control set. Then the estimated strength on these (NC – NC’) samples can be compared to that measured on the control cores. Other possibilities exist for checking the consistency of the identified conversion model, using cross-validation procedures and avoiding to formally keep a control set.
This progressive approach will be promoted in the future RILEM TC guidelines and could be considered as a first result of this benchmark..
Figure 11. Revised investigation approach flowchart
1 2 3 4 5 6 7 8 9 10 11 12 13 14 15 16 17 18 19 20 21 22 23 24 25 26 27 28 29 30 31 32 33 34 35 36 37 38 39 40 41 42 43 44 45 46 47 48 49 50 51 52 53 54 55 56 57 58 59 60 61
Conclusions and perspectives
The objective of the benchmark carried out by the RILEM TC was above all to develop and share knowledge about all possible approaches for addressing the issue of in situ assessment of concrete strength mainly based on nondestuctive tests. Another objective was to compare different approaches in order to highlight their merits/drawbacks and justify the promotion of certain options. The use of synthetic simulations offered the possibility of quantifying the quality of all assessments, which remains impossible in real case-studies.
This benchmark has led to very important conclusions. The first two very practical conclusions were that:
-‐ NDT, when efficiently combined with cores can, with sufficient resources for an investigation at KL3 level as defined by Codes, provide a very good estimate of average concrete strength, with a range of error within ± 10%, -‐ the same type of investigation seems to lead naturally to a gross
overestimation of the concrete variability (standard deviation of concrete strength) at the scale of the structure. Thus estimation of concrete variability remains an open challenge for common approaches.
Because of the importance of estimating variability, the RILEM TC has chosen to focus on this issue in its efforts. While many factors are known to contribute to the uncertainties in the strength assessment (number of cores, type of conversion model, method for identifying the conversion model, type of NDT method, etc.), we came to recognize the dominant influence of the measurement uncertainties. These uncertainties are the main reason for conversion model uncertainty and they propagate when the model is used for assessing strength. Controlling their magnitude seems therefore very useful. In practice, it is easy to do so, by simply repeating a certain number of times the same measurement process. At a given
Choice'of'' conversion'model' Choice'of'NDT' Condi3onal' coring?' NDT'measurements' cores' NDT'measurements' YES' NO' Iden3fica3on'of'' model'parameters' cores' NC'cores'with'both'NDT'and''
strength'measurements' NTBNC'test'loca3ons'with'only'NDT'measurements'
Parameter'iden3fica3on'
set'(NC’'cores)' (NC'B'NC’'cores)'Control'set''
NDT'strength'es3ma3on' Model'quality'es3ma3on' 1 2 3 4 5 6 7 8 9 10 11 12 13 14 15 16 17 18 19 20 21 22 23 24 25 26 27 28 29 30 31 32 33 34 35 36 37 38 39 40 41 42 43 44 45 46 47 48 49 50 51 52 53 54 55 56 57 58 59 60 61 62
test location, while the true value is unique (and unknown), the variability of test results determines the measurement uncertainty. Repeating the process at a few test locations over the structure make it possible to average the estimate of measurement uncertainty. Even if this measurement uncertainty is not reduced by improving the measurement process, its knowledge will be useful, since it will directly condition the quality of the final strength assessment. This issue will be addressed into details in the RILEM guidelines.
The benchmark also highlighted the benefit of conditional coring, which involves determination of core locations only after a preliminary series of NDT measurements, in order to take cores at locations which enable a representative coverage of the concrete variability. While Codes prescribe to use NDT in substitution of cores, our recommandation will be to coordinate cores with a previous NDT campaign. This can be done at no additional cost, since the investigation program can be set up accordingly. The benefit of conditional coring is probably much larger when the number of cores is small (less than 8 to 10), which is common in engineering practice. This issue will also be addressed in detail in the future RILEM guidelines.
Many questions remain unanswered at this stage and it would be hazardous to draw general conclusions on the basis of a single case of a unique synthetic simulation. Analyzing the efficiency of each variant of investigation approach (shown on Figure 11 including how the strength estimates are derived) requires an in-depth analysis of all contributing factors. One option will be to define other case-studies, either real ones (based on real dataset) or synthetic ones. A second benchmark is in progress in which the key issues of carbonation and of zoning of a structure (i.e. identifying possible defective areas) are specifically addressed. A second option is to remove the “effect of chance” which always exists when the investigation is carried out just once by repeating the process many times. This approach will be developed in the companion paper. Few investigation approaches will be selected among those proposed by the benchmark contributors and they will be reproduced in silico. The only modification will be the fact that the building will be generated N times and that, on each building, the investigation approach will be carried out once, following exactly the same rules (type of techniques and models, number of test locations, etc.). The statistical analysis of results will bring precious information about the efficiency of each approach and of its robustness. It will be then possible to derive practical information that will be used in future RILEM guidelines.
Acknowledgements
This work was carried out by the RILEM Technical Committee TC-249 ISC which aims at preparing guidelines for more efficient and reliable NDT strength assessment of concrete.
Compliance with Ethical Standards: The authors declare that they have no conflict of interest.
References
Alwash M., Breysse D., Sbartai Z.M., Non destructive strength evaluation of concrete : analysis of some key factors using synthetic simulations, Constr. Build. Mat., 99, 235-245, 2015.
1 2 3 4 5 6 7 8 9 10 11 12 13 14 15 16 17 18 19 20 21 22 23 24 25 26 27 28 29 30 31 32 33 34 35 36 37 38 39 40 41 42 43 44 45 46 47 48 49 50 51 52 53 54 55 56 57 58 59 60 61
Alwash M., Breysse D., Sbartai Z.M., Using Monte-Carlo simulations to evaluate the efficiency of different strategies for non destructuve assessment of concrete strength, 2016, subm. to Materials and Structures.
Balayssac J.P., Garnier V., Villain G., Sbartai Z.M., Derobert X., Piwakowski B., Breysse D., Salin J., An overview of 14 years of French collaborative projects for the characterization of concrete properties by combining NDT methods, Int. Symp. NDT-CE, Berlin, Sept. 15-17, 2015.
Bartlett F.M., MacGregor J.G., Assessment of concrete strength in existing structures, Structural Engineering Report 198, May 1994
Biondi, S., Candigliota, E., Non destructive tests for existing r.c. structures assessment, Proc., fib 2008 Symp.: Tailor Made Concrete Structures: New Solutions for Our Society, Amsterdam, May 19-22, 2008, pp. 1037-1039, Taylor & Francis.
Biondi, S., Candigliota, E., In situ tests for seismic assessment of r.c. structures, 14th World Conf. Earthquake Eng., Beijing, China, October 12-17, 2008, CAEE Chinese Ass. Earthquake Eng., IAEE Int. Ass. Earthquake Eng., Digital Paper ID 05-01-0447, Mira Digital Publishing. Biondi, S., The Knowledge Level in existing buildings assessment, 14th World Conf. Earthquake
Eng., Beijing, China, October 12-17, 2008, CAEE Chinese Ass. Earthquake Eng., IAEE Int. Ass. Earthquake Eng., Digital Paper ID 05-01-0447, Mira Digital Publishing.
Breysse D., Martinez-Fernandez J., Assessing concrete strength with rebound hammer: review of key issues and ideas for more reliable conclusions, Materials and Structures, online ISSN 1871-6873, n° 139, 2013, 16ps.
Breysse D., Non-Destructive Assessment of Concrete Structures: Reliability and Limits of Single and Combined Techniques, State-of-th-Art Report of the RILEM Technical Committet 207-INR, Springer, 374 p., 2012.
Breysse D., Nondestructive evaluation of concrete strength: an historical review and new perspective by combining NDT methods Const. Build. Mat., vol. 33, n° 21, 2012, p. 139-163. CEN Comité Européen de Normalisation Ed. (2005). Eurocode 8: Design of structures for
earthquake resistance -Part 3: Assessment and retrofitting of buildings. EN 1998-3: 2005 E, Brussels
D.M. 14.01.2008 (2008). Norme tecniche per le costruzioni. Gazzetta Ufficiale 29: S.O. 30, (in Italian)
EN 13791, Assessment of in situ compressive strength in structures and precast concrete, CEN, Brussels, 2007.
Facaoaru I. Recommandations for testing concrete by hardness methods (from RILEM TC 43 CND), Mat. Str. 16, 95, p. 368-376.
Facaoaru I. Draft recommendation for in situ concrete strength determinationby combined non-destructive methods. RILEM Draft Recommendation, MatStr 1993; 26:43–9 (chairman). FEMA (1998) Handbook for the seismic evaluation of existing buildings. A Prestandard. Fema
310. Building Seismic Safety Council. Washington, D.C., 1998
IAEA International Atomic Energy Agency, Guidebook on non-destructive testing of concrete structures, testing training course series n° 17, 2002.
Luprano V., Caretto F., Labia N., Ciniglio G., Tatì A., Tundo A., Pfister V., Nondestructive Test Methods for evaluation of concrete: the case study of Punta Perotti (Italy), International Conference on Durability of Building Materials and Components ISTANBUL, Turkey 11-14 May 2008.
Masi A., Vona M. La Stima della Resistenza del Calcestruzzo In-Situ: Impostazione delle Indagini ed Elaborazione dei Risultati, Progettazione Sismica, n° 1/2009, IUSS Press, ISSN 1973-7432, 2009.
Masi A., Chiauzzi L.,. An experimental study on the within-member variability of in-situ concrete strength in RC building structures, Construction and Building Materials, Vol. 47, October 2013, pp. 951-961, 2013.
Masi A,. Manfredi V., Chiauzzi L.. Criteria for identifying concrete homogeneous areas for the estimation of in-situ strength in RC buildings, Construction and Building Materials, 2016 (under second review).
Nguyen N.T., Sbartai Z.M., Lataste J.F., Breysse D., Bos F., Assessing the spatial variability of concrete structures using NDT techniques – Laboratory tests and case study, Constr. Build. Mat., Vol 49, 240-250, 2013.
OPCM 3274 (2003). Primi elementi in materia di criteri generali per la classificazione sismica del territorio nazionale e di normative tecniche per le costruzioni in zona sismica. Gazzetta Ufficiale 105: S.O. 72, (in Italian)
Pfister V., Tundo A., Luprano VAM., Evaluation of concrete strength by means of ultrasonic waves: A method for the selection of coring position, Constr. Build. Mat., 61, 278–284, 2014.
1 2 3 4 5 6 7 8 9 10 11 12 13 14 15 16 17 18 19 20 21 22 23 24 25 26 27 28 29 30 31 32 33 34 35 36 37 38 39 40 41 42 43 44 45 46 47 48 49 50 51 52 53 54 55 56 57 58 59 60 61 62