High
‐Resolution Field Mapping and Analysis of the
August
–October 2016 Coseismic Surface Faulting
(Central Italy Earthquakes): Slip Distribution,
Parameterization, and Comparison With
Global Earthquakes
F. Brozzetti1 , P. Boncio1 , D. Cirillo1 , F. Ferrarini1 , R. de Nardis1,2 , A. Testa1, F. Liberi3, and G. Lavecchia1
1CRUST‐DiSPUTer, University “G. d'Annunzio”of Chieti‐Pescara, Chieti, Italy,2Italian Department for Civil Protection, Rome, Italy,3Regione Abruzzo, Pescara, Italy
Abstract
We focus on the coseismic surface faulting exposed along the Mt. Vettore‐Mt. Bove fault system (VBF, central Italy), that activated during the 24 August 2016, Amatrice earthquake (Mw6.0) and soon afterreactivated during the 26 October Visso (Mw5.9) and 30 October Norcia events (Mw6.5 mainshock). We
systematically recognized the coseismic surface ruptures of the aforesaid earthquakes, which document the repeated surface faulting on the same seismogenic structure in close temporal succession. We surveyed 1,747 evidence of coseismic ruptures, 325 fault plane attitudes along the Vettoretto‐Redentore segment, and over 4,000 data along the entire VBF that were organized in a GIS‐database. This data set allowed us to estimate the coseismic surface rupture length (SRL), maximum (MD) and average (AD) displacement associated with the Mw6.0 and Mw6.5 events. We found that the SRL and MD associated with the former are
respectively 5.8 km and 28.5 cm and AD reaches 12.7 cm. For the mainshock, the values of SRL≥ 22 km and MD = 222 cm were measured. The cumulative, post‐30 October parameters are SRL = 30 km, MD = 240 cm, AD = 36 cm. Despite that the MD of the Mw6.0 event differs by ~1 order of magnitude respect to the
mainshock MD, the two slip profiles display a similar multiscale sinuosity showing a significant control of the long‐term fault segmentation on the coseismic rupturing. Comparing the obtained coseismic
parameters with literature global earthquakes data highlights some peculiarities of the 2016 central Italy surface rupture pattern, which suggest caution in applying empirical relationships to highly segmented seismogenic faults.
1. Introduction
On 30 October 2016 (06:40 UTC), a Mw6.5 (Chiaraluce et al., 2017) normal fault earthquake struck the
central Apennines of Italy (5 in Figure 1a). The earthquake was sourced by one of the longest active fault of central Italy, the ~30‐km‐long Mt. Vettore‐Mt. Bove fault (VBF). In the previous 3 months, it was preceded by a strong seismic sequence (5.0≤ M ≤ 6.0). The 24 August (Mw6.0, 1 in Figure 1a) and 26 October (Mw5.9,
4 in Figure 1a) shocks were the most energetic events of this sequence preceding the 30 October event (Chiaraluce et al., 2017; Michele et al., 2016). A well‐evident quiescence that extended throughout a broad region north of the 24 August epicenter preceded the sequence (Gentili et al., 2017). The three major earth-quakes caused the death of almost 300 people, the destruction of 50 villages, and an epicentral intensity of 11 MCS (Galli et al., 2017).
Seismological and geological data show that the three major earthquakes originated by ruptures nucleated on different segments of the same fault, the VBF (Chiaraluce et al., 2017; Lavecchia et al., 2016; Mildon et al., 2017).
Strong evidence for static and dynamic triggering of seismicity following the 24 August was provided by Coulomb stress‐transfer modeling along the seismogenic fault (Convertito et al., 2017; Papadopoulos et al., 2017).
Coseismic surface slip on the same fault planes, during both the 24 August and 30 October events is shown by the“double‐slip free faces” well exposed along the southern segment of the VBF, named here Vettoretto‐
©2019. The Authors.
This is an open access article under the terms of the Creative Commons Attribution‐NonCommercial‐NoDerivs License, which permits use and distri-bution in any medium, provided the original work is properly cited, the use is non‐commercial and no modifica-tions or adaptamodifica-tions are made.
RESEARCH ARTICLE
10.1029/2018TC005305
Special Section:
The 2016 Central Italy Seismic Sequence: Insights, implica-tions and lessons learned
Key Points:
• Large data sets of coseismic ruptures, collected along the Mt. Vettore‐Bove fault after the 24 August and 30 October 2016 earthquakes, allow a comparison of the associate surface faulting • Coseismic slip distribution reveals
the segmentation pattern and hierarchical organization of a regional fault system in the Apennines
• Coseismic parameters of the surface rupture of Mt. Vettore‐Bove fault suggest caution in applying empirical regressions to segmented faults Supporting Information: • Supporting Information S1 • Data Set S1 • Data Set S2 Correspondence to: F. Brozzetti, [email protected] Citation:
Brozzetti, F., Boncio, P., Cirillo, D., Ferrarini, F., de Nardis, R., Testa, A., et al. (2019). High‐resolution field mapping and analysis of the August– October 2016 coseismic surface faulting (central Italy earthquakes): Slip distri-bution, parameterization, and compar-ison with global earthquakes. Tectonics, 38. https://doi.org/10.1029/
2018TC005305 Received 26 AUG 2018 Accepted 22 DEC 2018
Redentore segment (VRS, Figure 1c). Such a feature is de facto, the outcropping geological expression of the 24 August‐30 October earthquakes which both ruptured the VRS. It is a peculiar feature that had never been observed in past extensional earthquakes in Italy. Reconstructing the deformational pattern associated to these two events and comparing the spatial distribution of coseismic slip with their deep sources might help in understanding the causes of this double activation and the control played by structural complexities on rupture nucleation and propagation.
In this paper, we describe and analyze the results from a very detailed mapping of the coseismic ground rup-tures generated by the 24 August and 30 October events along the VRS and provide the overall related data-bases as supporting information S1 and Figure S1. Ourfield mapping contributed to realize the map and data set of the 30 October 2016 surface ruptures published by Civico et al. (2018); Villani, Civico, et al. (2018); and Villani, Pucci, et al. (2018), therefore part of the data presented here, concurred to the aforementioned papers. Nevertheless, this work contains an original contribution that consists of a higher number of high‐quality geologic observations and structural analyses, which are not contained in the cited papers. In particular, we have added severalfield measurements of tectonic coseismic slip of the 24 August event and of the 30 October mainshock, measured along the VRS.
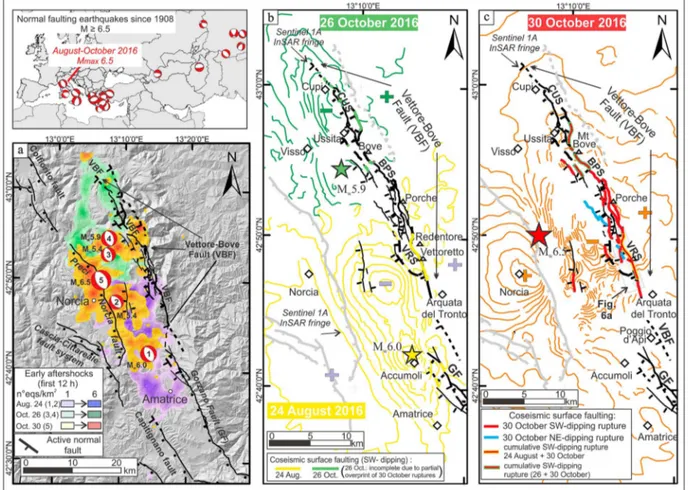
Figure 1. Location map of the Central Italy seismic sequence of 2016 and overall extent of the Mt. Vettore‐Mt. Bove fault (VBF) with the main recognized segments (VRS, Vettoretto‐Redentore; BPS, Bove‐Porche; and CUS, Cupi‐Ussita, segments, from south to north). (a) Quaternary fault pattern and density contours of the early aftershocks released in thefirst twelve hours after the 24 August, 26 October, and 30 October 2016 earthquakes; focal mechanisms (from time domain moment tensor catalogue, cnt.rm.ingv.it/en/tdmt) of the August–October 2016 events with Mw≥ 5.0 (1 = 24 August, 01:36 UTC, Mw6.0; 2 = 24 August, 02:33 UTC, Mw5.4; 3 = 26 October, 17:10 UTC, Mw5.4; 4 = 26 October, 19:18 UTC, Mw5.9; and 5 = 30 October, 06:40 UTC, Mw6.0). (b and c) Schematic distribution of the coseismic ruptures generated along the Quaternary fault pattern by the 24 August (b, yellow heavy lines), 26 October (b, green heavy lines), and 30 October (c, red heavy lines) earthquakes. In (c), the double color lines indicate overprint of the 30 October faulting on the previous 24 August (red lines on yellow heavy lines) and 26 October (red lines on green heavy lines) ruptures (source: this work integrated with data from Pizzi et al., 2017 and Emergeo Working Group, 2017). Colored contours in (b) and (c) depict the fringe patterns redrawn from coseismic interferograms (ascending Sentinel 1A InSAR images available at http://comet.nerc.ac.uk/ and http://insarap.org/) of the 24 August (b, yellow contours), 26 October (b, green contours), and 30 October (c, red contours) earthquakes; each fringe is 2.8 cm displacement in the line of sight; minus and plus symbols denote coseismic subsidence and uplift, respectively.
Moreover, we present here the results from a large number of originalfield data collected along the northern sections of the VBF, where the ruptures published by Civico et al. (2018); Villani, Civico, et al. (2018); and Villani, Pucci, et al. (2018) were largely incomplete of direct displacement measurements. A complete survey of the coseismic rupture is fundamental for constraining one of the most important coseismic para-meter, the average coseismic displacement (AD). We provide robust constrains of the coseismic parameters of the entire earthquake rupture, which are the surface rupture length (SRL), AD, and maximum displacement (MD).
This set of data is certainly useful for seismic source modeling aimed at jointly inverting ground deformation derived from satellite geodesy (InSAR and GPS) and directfield measuring of surface displacement. Further aims of our work are as follows:
1. demonstrate the primary origin of most of the surveyed surface ruptures (i.e., surface ruptures due to slip on the fault responsible for seismic energy release);
2. analyze the slip distribution of the 24 August and 30 October events and compare them with the long‐ term (Pleistocene to present) segmentation pattern and displacement, as obtained from structural geology and fault scarp profiling; and
3. discuss the coseismic parameters (SRL, AD, and MD) and slip profiles with those available in the litera-ture for global earthquakes (Mw> 6).
2. Seismotectonic Setting
The 24 August earthquake of Mw6.0 (Chiaraluce et al., 2017; Michele et al., 2016) initiated the reactivation of
the easterner Quaternary fault of the central Apennine extensional belt, the VBF (Galadini & Galli, 2003; Lavecchia et al., 2002; Lavecchia et al., 2017). The 26 October (Mw5.4 and Mw5.9) and 30 October (Mw
6.5) events completed the reactivation of the VBF. The area covered by the early aftershocks of the three major events of the August–October 2016 seismic sequence (first 12 hr after each event) extends for ~50 km along the NNW‐SSE direction (Figure 1a).
The focal mechanisms of thefive largest earthquakes (Mw≥ 5) indicate nearly pure dip‐slip motion on
normal faults striking N135° to N155° and dipping 45–55° to the SW (Figure 1a, Chiaraluce et al., 2017, Zhong et al., 2018). T‐axes trend from ENE to NE, consistently with long‐term fault slip data (Brozzetti & Lavecchia, 1994; Calamita et al., 1992).
The sequence occurred at upper crustal depths (<10–11 km) in the hanging‐wall of a SSW‐dipping normal fault system (Lavecchia et al., 2016, 2017), which includes, from north to south, the entire VBF and the northern portion of the Mt. Gorzano fault (GF). These two faults are separated by a right step over zone of nearly 2 km (Figure 1a). They are relatively long‐lived extensional structures with a lifetime of >1 Ma (Blumetti et al., 1993; Coltorti et al., 1989), along‐strike length of 30–35 km, long‐term MD ranging from ~1,500 m (VBF; Calamita et al., 1992) to ~2,300 m (GF; Boncio et al., 2004), and geological slip rate of 0.6–0.7 to ~1.3 mm/year. The VBF and the GF offset preexisting late Miocene fold‐and‐thrust structures (Lavecchia, 1985; Pizzi et al., 2017) and displace Quaternary continental deposits and Late Pleistocene‐ Holocene landforms (Blumetti et al., 1993; Boncio et al., 2004; Brozzetti & Lavecchia, 1994; Calamita et al., 1992; Galadini & Galli, 2000). Paleoseismic activity is documented along both faults (Galadini & Galli, 2003; Galli et al., 2019); conversely, historical and instrumental seismicity preceding the 2016 earthquakes is only known in association with GF, such as the 1639 Mw6.2 earthquake, that is thought to
have ruptured the northern half of the GF, or the April 9 Mw5.2 aftershock of the 2009 L'Aquila earthquake
sequence that activated the southern portion of the GF (Boncio et al., 2004; Lavecchia et al., 2011, 2012; Galli et al., 2016).
The 24 August Amatrice earthquake activated the southern portion of the VBF and the northern portion of the GF and nucleated at a depth of about 8 km, in the step over zone (Figure 1b, Lavecchia et al., 2016, 2017; Pucci et al., 2017); it is located nearly 20 km SSE of the 30 October mainshock (Chiaraluce et al., 2017).
The 26 October Mw5.9 Visso event activated the northern VBF (Figure 1b) at a depth of ~4 km; it was located
nearly 15 km NNE of the mainshock (Chiaraluce et al., 2017).
10.1029/2018TC005305
The 30 October mainshock activated the southern and central VBF (Figure 1c) and nucleated at a depth of ∼7.5 km. Its focal mechanism and aftershock distribution (Chiaraluce et al., 2017) suggest a rupture well compatible with the VBF geometry which dips∼50° to the SW at the hypocentral depth and steepens upward to reach a dip‐angle of ∼65° at the surface (Lavecchia et al., 2016, 2017, Figure 1a). The strict control played by the VBF on coseismic surface faulting is highlighted by the interruption along the trace of the fault scarp of interferometric fringes obtained from DInSAR data, which were available soon after the earth-quakes (http://insarap.org/, http://comet.nerc.ac.uk/, Figures 1b and 1c).
The three largest shocks caused coseismic ground ruptures along the three major segments of the VBF (Figures 1b and 1c).
Note that segment is used here as a purely descriptive term, without behavioral meaning. From north to south, these segments are as follows: (1) Cupi‐Ussita (CUS), (2) Mt. Bove‐Mt. Porche (BPS), (3) Mt. Vettoretto‐Mt. Redentore (VRS, Figures 1b and 1c). At several localities along the VBF, the 30 October event reactivated the surface ruptures of the two previous events (Figure 1c).
3. Methods and Phases of Work
3.1. Field Mapping of Coseismic Ground Ruptures
Soon after the 24 August earthquake, we started a detailedfieldwork along the preexisting fault scarp of the VRS, aimed at mapping in detail (1:1000) the long‐term fault trace and at surveying the associated coseismic ground ruptures. The survey was performed at a high resolution, with a sampling rate of at least one site per 50 m, and locally of three sites per meter (Figure S1); a GPS‐Compass integrated digital device was used (i.g., the GPS‐integrated Field Move Software Suite, Midland Valley). All the sampling sites with evidence of coseismic fracturing were characterized in terms of rupture type, attitude, kinematics, slip vector (obtained from coseismic slickenlines or piercing points), and displacement (throw, opening, and net displacement; Figure S1). An initial data set of 1,747 measurement and images were collected in a time span of nearly 2 months along a fault length of ~5.8 km.
After the 26 October earthquake, during the few days that preceded the 30 October mainshock, we executed field surveys along the northern VBF and we found evidence of primary surface faulting SE and NE of Ussita (Figure 1b), with throw in the range of 8–15 cm. However, the very short time to the mainshock hampered us to carry out a systematic survey of the 26 October ruptures.
From 31 October to December 2016 we surveyed in detail the 30 October ruptures, from the southern tip of the VBF to Mt. Porche. The ruptures north of Mt. Porche were surveyed in detail from Spring to Fall 2017. For this second set of data it was not possible to separate the 26 and 30 October components. The 30 October reactivation of the VBF might have overprinted some of the 26 October ruptures, with the consequence that the measured displacement might be the cumulative slip of the two events.
The survey of the 30 October ruptures was carried out with the same high‐resolution sampling procedure that we applied to the 24 August ones.
3.2. Types of coseismic ruptures
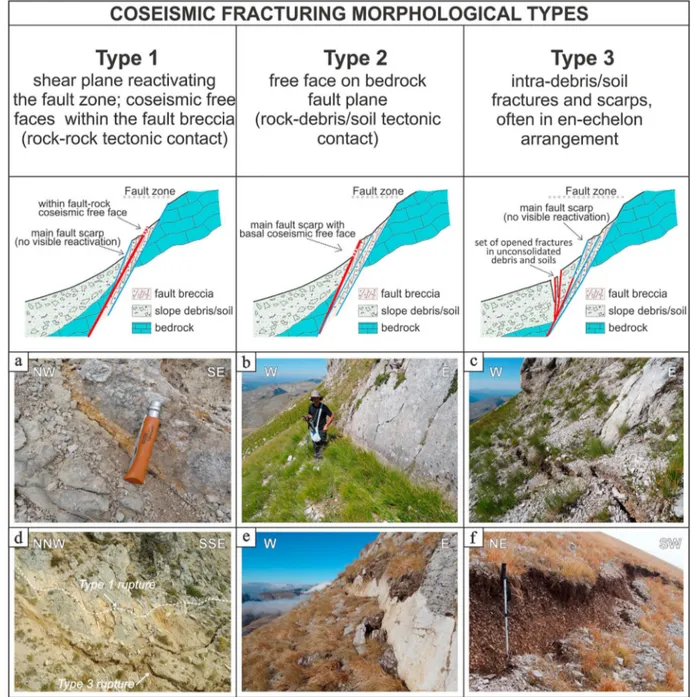
Based on their morphology and on the fault contact typology, we distinguished the ground ruptures in three types (Figure 2).
Type 1. Shear planes affecting the fault rock; they record coseismic shear occurred in lithoid materials, par-ticularly in cemented fault breccia; coseismic slickenlines are often evident on the long‐term fault plane (Figures 2a and 2d).
Type 2. Free face surfaces on bedrock fault planes at the contact with Late Pleistocene‐Holocene debris and colluvium at the base of preexisting fault scarps. In some cases, the free face is not associated to a well recognizable fault plane but occur at the contact between nonbrecciated bedrock and slope debris, often in close proximity to the buried portion of the fault plane, where the amount of the coseismic slip was not sufficient to cause its exhumation (Figures 2b and 2e).
Type 3. Simple scarps (Figures 2c and 2f) or sets of complex fractures (step and open fractures, rarely graben fractures; Figure 2c) affecting detrital cover and soils and, locally, also roads and walls; they are
often arranged in en echelon patterns, particularly in the transfer zones between well‐developed, noncoplanar fault scarps.
In case of fracture Types 1 and 2, we measured attitude (dip‐direction and dip‐angle), net displacement, opening (if any), and pitch angle of the coseismic slickenlines. In some cases, it was possible to observe a “double‐slip free face” recording the movements caused by both 24 August and 30 October earthquakes. This consists of two adjacent, subparallel, bands representing the portions of the scarp unearthed during the two subsequent shocks. The two bands display a different color shade due to the different duration of the exposure to weathering.
In case of fracture Type 3, we measured strike, maximum coseismic throw (CT) and opening perpendicular to strike, if any. Displacement values, on this type of fractures, were measured only where unambiguous piercing points were recognized in both the faulted blocks.
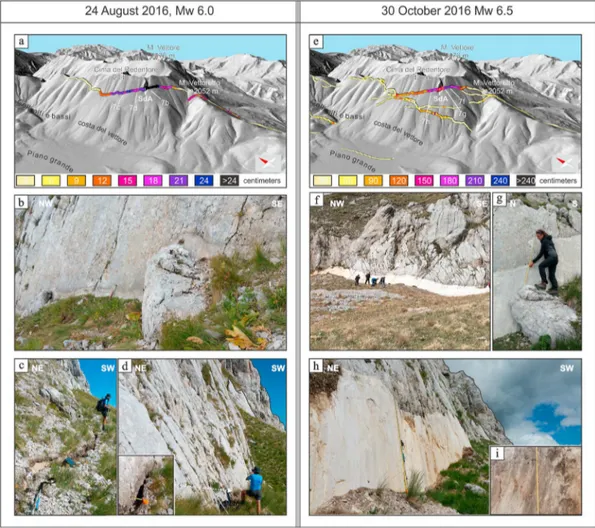
Figure 2. Sketches showing the three coseismic fracture types observed along the Vettoretto‐Redentore fault segment (VRS), with field examples of ruptures, related to the three types, caused by the 24 August, Mw6.0, (a–c) and the 30 October, Mw6.5, earthquakes (d–f).
10.1029/2018TC005305
3.3. Assessing the Long‐Term Geologic and Late Quaternary Displacement
We calculated both the geologic (i.e., long‐term) and topographic (i.e., Late Quaternary) displacement along the VRS of the VBF in order to compare obtained values and their along‐strike variation with the coseismic displacement of 2016 earthquake.
The geologic displacements were calculated by restoring the offset of the stratigraphic markers in a set of geological sections drawn according to the Geological Map by Pierantoni et al. (2013), modified after our fieldwork. Taking into account the thickness of the displaced formations and their bed attitudes along the sections, the obtained geologic displacements can be affected by errors evaluated in the range of 10–20 m maximum.
The topographic displacement was calculated through topographic profiles made across the Vettoretto‐ Redentore fault scarp. Elevation data were extracted from a 5‐m digital elevation model that was built from contour lines and sparse elevation points derived from topographic map at scale 1:5000 (http:// www.umbriageo.regione.umbria.it/pagina/distribuzione‐carta‐tecnica‐regionale‐vettoriale‐1‐000) and using a TIN (Triangular Irregular Network) interpolation technique in order to better preserves the original accuracy (according to Tarquini et al., 2007).
The elevation data were acquired prior to the 2016 seismic sequence, therefore the obtained throw values do not include the CT.
The offset of the far‐field topographic slope across the fault scarp was calculated and interpreted as displace-ment cumulated by several slip events (Galli et al., 2012) after the demise of the Last Glacial Maximum (LGM), that is after ~15 ± 3 Kyr ago (Giraudi & Frezzotti, 1997). The calculated vertical displacement recti-fied by adding to the current topographic offset, the thickness of colluvial materials accumulated above the hanging wall block, from the LGM to today, was used to estimate the post‐LGM throw rate.
3.4. Coseismic Data Managing and Analysis
The collected structural data sets were organized in a comprehensive database and managed in ESRI ArcMap ArcGIS® 10.1.
The data collected at the scale of the entire VBF are analyzed here in order to constrain the overall cumula-tive SRL, slip distribution and average (AD) and maximum (MD) net displacement of the entire earthquake sequence. The average net displacement was computed as both arithmetic and integral means, with the latter corresponding to the ratio of the area subtended by the displacement profile to the rupture length. The data collected along the VRS are analyzed in detail from a structural point of view in section 5 (see also Figures S1 to S5). The related coseismic database (supporting information S1) provides information, for each survey site, on the fracture type, attitude, kinematics, total (net) displacement, throw, and opening. The displacement data were represented as along‐strike throw diagrams for each section of the segment. We decided to plot the throw instead of the net displacement as the former was the most frequently measured parameter (about 85%, mostly from Type 3 ruptures). Where only measurements of net displacement are available (mostly Types 1 and 2 ruptures), the corresponding throw is calculated by trigonometry based on the fault dip‐angle.
The structural data are displayed and analyzed with strike rose diagrams and strike histograms, distin-guished as a function of fault sections and fracture typology (Figure S2). Coseismic slip measured on fault planes (Types 1 and 2) are projected on stereoplots and compared with long‐term fault‐slip data.
Additional statistical analysis of the fracture patterns has been achieved in order to calculate the percentage distribution of the different types of fractures with respect to the fault segmentation pattern and the disper-sion of the different fracture types from the long‐term trend.
4. The 24 August to 30 October Coseismic Rupture Length and Slip Distribution
The 24 August to 30 October earthquakes ruptured at the surface almost entirely the VBF (Figure 3). The pattern of coseismic ruptures indicate a common primary (i.e., tectonic) origin testified by the following geo-logical observations:
1. Most of the ruptures reactivated long‐term fault scarps or are arranged in alignments whose direction is independent of the orientation of the topographic surface; ruptures dipping downslope, counterslope, or obliquely with respect to slope, occur frequently along the same ruptures alignment (e.g., near Mt. Argentella or Mt. Vettoretto; cf. Figures 4–6);
2. the set of ruptures, which originated along the VRS after both the events, develops with continuity along its geological trace also where it crosses and displaces the Sibillini thrust (Figure 4a) with an associate long‐term offset of ~350 m (Figure 4b, geological section F‐F′), propagating also within the thrust foot-wall block;
3. coseismic slip of both the events shows locally oblique kinematics which are clearly unrelated to the local dip‐direction of the slope (cf. Figures 4 and 6a); and
4. some kilometer‐scale ruptures, due to the 30 October event, affect flat areas (e.g., the Prate Pala splay of the VRS, in the Piano Grande basin, Figure 4a) or foot‐slope debris (e.g., the Colli Alti e Bassi Fault) char-acterized by very low slope‐gradient allowing to exclude significant gravitational deformation.
For the above arguments, we think that any alternative (i.e., nonprimary) origin of the surveyed coseismic ruptures, which has been hypothesized by some authors (Bonini et al., 2016; Huang et al., 2017) is not
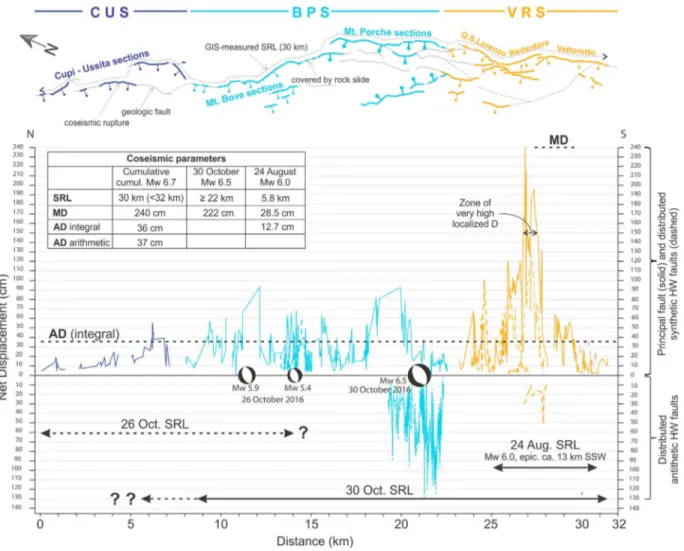
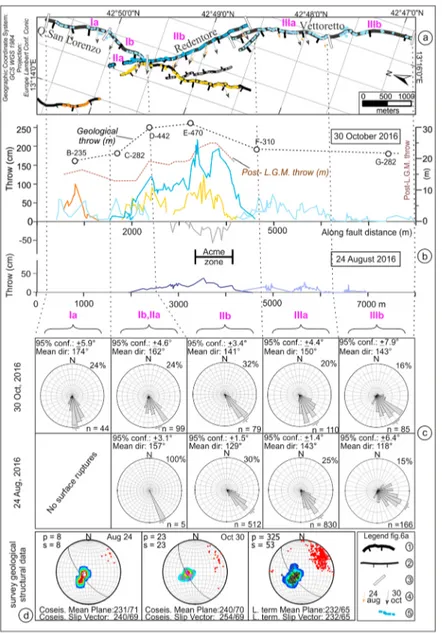
Figure 3. Cumulative (24 August to 30 October) net displacement of the 2016 earthquakes along‐strike the Mt. Vettore‐Mt. Bove normal fault (VBF) and coseismic parameters (top‐left table) of the rupture (SRL = surface rupture length; MD = maximum displacement; AD = average displacement). Coseismic data are from originalfieldwork (this paper); only the antithetic (NE‐dipping) hanging wall fault of the Mt. Porche sections is from Open EMERGEO database in Civico et al. (2018) and Villani, Civico, et al. (2018). Note that the distance in the diagram differs slightly from the GIS‐measured maximum SRL (30 km) due to the geometric method used in calculating the distance (sum of distances of adjacent survey points along each fault section). The dotted arrows (below) delimiting the rupture distribution after 26 October and 30 October earthquakes indicate the uncertainty in the effective length of the fault sections activated at surface during these two events.
10.1029/2018TC005305
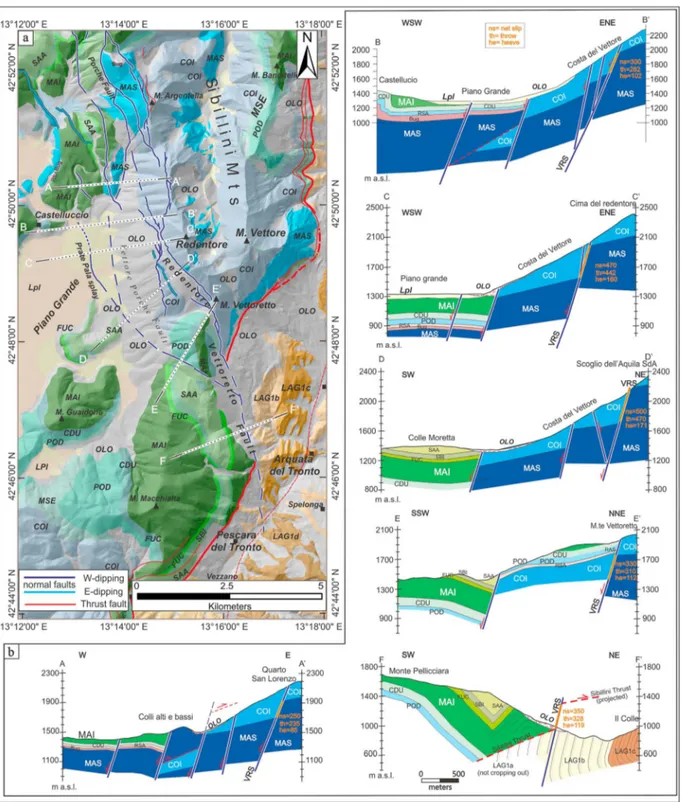
Figure 4. Geological scheme of Mt. Vettore‐Piano Grande area (a) and cross sections across the Vettoretto‐Redentore segment (VRS) of the VBF (b). Small orange numbers reported on the sections in the footwall of VRS give the associate long‐term net slip (ns), throw (th), and heave (he) in meters. Note that the
Vettoretto section of the VRS clearly displaces the Sibillini Mts thrust (heavy red line) causing its westward lowering of nearly 330 m (section F‐F′) and allowing to exclude its extensional reactivation. Key for geological units of map and sections, from the oldest to the youngest: MAS = Calcare Massiccio (Early Jurassic); BUG = Bugarone (Early‐Middle Jurassic); COI = Corniola (Early Jurassic); RSA = Rosso Ammonitico (Early‐Middle Jurassic); POD = Marne a Posidonia (Middle Jurassic); CDU = Calcari Dasprini (Middle‐Late Jurassic); MAI = Maiolica (Early Cretaceous); FUC = Marne a Fucoidi (Aptian‐Albian); SBI = Scaglia Bianca (Cenomanian–Turonian); SAA = Scaglia Rossa (Turonian‐Early Eocene); LAG = Laga Formation pre‐evaporitic member; (1a) arenaceous facies, (1b) arenaceous‐ pelitic facies, (1c and 1d) pelitic‐arenaceous facies (all Early Messinian); LPl = alluvial‐lacustrine sediments (Late Pleistocene‐Holocene); OLO = slope debris and colluvium (Holocene).
Figure 5. Topographic profiles from a 5‐m resolution DTM across the Vettoretto‐Redentore (VRS) fault scarp. Profile traces are reported in the top right corner. (a) Topographic profiles (1–14) with reported displacement (throw) in meters computed starting from the observed offsets in the regularized slope; note that the throw measurements include corrections which compensate the eroded portion of the fault scarp in the footwall and the buried portion of the post‐LGM slope in the hanging wall (explanation in bottom right inset); (b) throw variation versus along‐fault distance measured over the different topographic profiles (1–14), assuming as zero‐point the VRS northern tip. The elevation data used to elaborate the DEM were acquired prior to the 2016 seismic sequence; therefore, the obtained throw values do not include the coseismic throw.
10.1029/2018TC005305
Figure 6. Analysis of the 24 August and 30 October 2016 coseismic ground ruptures surveyed along the Vettoretto‐ Redentore segment (VRS) of the Vettore‐Bove fault (VBF). (a) VRS segmentation pattern, with location of the surveyed coseismic ground fractures, extracted from data set in supporting information S1; coseismic slip vectors measured along the fault trace are also schematically reported with arrows; location of Figure 6a along the VBF is reported in Figure 1c as gray rectangle; key for legend of map 6a (bottom‐right): (1) VRS fault trace, (2) trace of synthetic and antithetic sub-sidiary normal fault, (3) end of fault subsection, (4) coseismic slip vector of 24 August and 30 October earthquakes, and (5) location of survey site; (b) Coseismic throw (CT) profiles of the 24 August and 30 October earthquakes (lower and upper graphs, respectively), measured along the VRS and the associated minor synthetic and antithetic splays; the original data are given in supplementary information S1. The CT (y) values are plotted versus the along‐fault distance (x) from an origin located at the northern VRS tip point, assuming an average N150°E fault strike. The Pleistocene (long‐term) and Late Quaternary (after the Last Glacial Maximum = LGM) throw profiles, respectively, measured along a number of geological (Figure 4, A, B, C, D, E, and F) and topographic (Figure 5, 1–14) sections crossing the VRS approximately perpendicular to its attitude, are also reported above the upper graph (black and brown dotted lines, respectively). In Figure 6b, positive CT values refer to fractures measured on west‐dipping planes (VRS or synthetic faults), whereas negative ones refer to east‐dipping antithetic faults. (c) Azimuthal distribution of coseismic fractures, along the subsec-tions of the VRS segment; the T‐bar at the diagram boundary shows the average strike of the fault subsection; Mean Dir. = mean value of fracture direction obtained averaging all the data plotted on each diagram (whose number n is shown bottom right number); (d) Stereonet projection of coseismic (left plot = 24 August, central plot = 30 October) and long‐ term (right plot) fault slip data, measured along the VRS; p = number of measured fault planes, s = number of measured striae; the great circle traced on each plot represents the mean VRS attitude obtained from the collected fault planes (values reported below in dip‐notation that is dip‐direction/dip‐angle); the average coseismic (left and central stereoplots) and long‐term (right stereoplot) slip vectors are also expressed in dip notation; original data in supporting information S1.
credible, except for a few local cases, which we surveyed, classified as secondary nontectonic effects, and not considered in the analysis in this work.
In Figure 3 we show the distribution of the cumulative net displacement of the 24 August to 30 October earthquake sequence along the VBF, compared with the map pattern of the surveyed surface ruptures. The total cumulative SRL, calculated on GIS along the principal fault, is 30 km. Some aligned ruptures along the southern continuation of the VRS suggest that SRL can reach 32 km but the low frequency and the poor quality of the measurement sites convinced us to be conservative in our assessment.
Further, we could not solve the uncertainties about the SRL of the 26 and 30 October events separately. Certainly, the 26 October shocks ruptured (Figure 3; Civico et al., 2018; Emergeo Working Group, 2017; Pizzi et al., 2017) the Cupi‐Ussita segment (CUS, Figure 1b) and at least part of the M. Bove section of the Bove‐Porche segment (BPS, Figure 1b). Most of the surface displacement on the Cupi‐Ussita sections is due to 26 October shocks, but it is not clear if and how the 30 October event reactivated these sections. Ourfield measurements confirm that the 30 October event ruptured entirely the VRS and Bove‐Porche seg-ment, at least up to the latitude of Ussita, for a total SRL of at least 22 km. In the following, 22 km will be considered the total (minimum) rupture length of the 30 October Mw6.5 mainshock. The maximum
cumu-lative displacement (MD), recorded on the Redentore fault section of the VRS, is 240 cm, while the MD of the 30 October event is 222 cm. The latter was recorded close to, but not exactly on, the same point of the cumu-lative MD. The average cumucumu-lative displacement (AD) calculated as both integral and arithmetic means are 36 and 37 cm, respectively.
5. Detailed Structural Analysis of the VRS
5.1. Geology of the VRS
The VRS is the southeasternmost segment of the VBF; it extends along strike for a length of 10.5 km in direc-tion N160° (Figures 3 and 4) and is characterized by clear geomorphologic fault scarp (Figure 5). A number of synthetic and antithetic splays affect the hanging wall on the distance of ~2 km from the fault trace. The segment has a hierarchic organization in second‐order fault sections (FS) and third‐order subsections (Figure 6). The FS are identified, in map view, based on sharp strike‐deviations, along‐strike terminations, step over zones with spacing in the order of hundreds of meters. The subsections mainly correspond to minor‐order deviation in strike along the FS. In particular, the VRS has been subdivided into three FS (I, II, and III in Figures 6a and 6c), with lengths in the order of 3–4 km, and into six subsections (FSIa, FSIb, FSIIa, FSIIb, FSIIIa, and FSIIIb).
The three FS, arranged in right‐stepping en echelon pattern, show an average NNW–SSE strike with local variations, to NW‐SE and NS directions. FSI, referred to as Quarto San Lorenzo, extends for 2.3 km in aver-age direction N180°E; FSII, referred to as Redentore, extends for 3.1 km in averaver-age direction N145E°; FSIII, referred to as Vettoretto, extends for 6.5 km in average direction N160E°.
At surface, FSI and FSII dissect the Sibillini thrust sheet, the outermost structural unit of the Umbria‐ Marche thrust and fold belt, consisting of Early Jurassic‐Cretaceous carbonates (Figures 4a and 4b) overrid-ing the >3‐km‐thick foredeep Laga Flysch (Messinian). The oldest and most competent carbonatic unit of the stratigraphic succession (Calcare Massiccio Fm, Hettangian‐Sinemurian), consisting of ~700‐m‐thick massive, shallow‐water limestones, is exposed at the VRS footwall, near the Scoglio dell'Aquila cliff (SdA in Figure 4b, section D‐D').
FSIII clearly displaces the Sibillini Thrust fault, with a westward downthrow of ~300 m and continues southward, within the Messinian Laga succession (Figure 4b, section F‐F′).
All the three FS show an average surface dip‐angle of about 65°. They differ in the long‐term slip vector attitudes, which highlight a slight right‐lateral component on FSII and a left‐lateral component on FSI and FSIII (Figure 6a). The calculated long‐term average slip vector 232/65 is shown in Figure 6d (right stereoplot).
The geological and topographic displacement associated to the VRS, measured along the serial cross sections of Figures 4 and 5, respectively, are represented in Figure 6b upper graph as throw profiles (black and brown dotted lines, respectively).
10.1029/2018TC005305
The geological displacement reaches a maximum value of 500 m (throw = 470 m) across FSII (Figures 4b, section D‐D' and 6b); the topographic displacement, interpreted to be post‐LGM, ranges from 13 to 25 m along FSI and FSII, (Figures 5 a,b, 6b). The corresponding inferred post‐LGM (15 ± 3 Kyr) throw rate ranges from 0.9 ± 0.2 mm/year to 1.7 ± 0.3 mm/year.
5.2. Characteristics of the Surface Ruptures Along the VRS
The 24 August event ruptured almost completely the fault sections FSII and FSIII and only a short portion of the FSIb, for an along‐strike length (L) of 5.8 km, in an average N160° direction (Figure 6b). The length affected by vertical offset is ~4.8 km; only open fractures characterize the terminal portions of the rupture. The related CT profiles (Figure 6b) shows throw values in the 0‐ to 27‐cm range, with four relative maxima progressively decreasing southward. The highest value (27 cm, corresponding to a maximum net displace-ment MD = 28.5 cm) is measured in the central portion of FSII; the other three peaks are observed along FSIII and mark the median parts of corresponding fault subsections, in which FSIII is articulated. The mean integral throw of the 24 August rupture is ~12 cm (average net displacement, AD = 12.7 cm). The azimuthal distribution of the fractures shows a general good agreement with the fault strike. This is evi-dent from the comparison between the directions of the fault path (Figure 6a) and the rose diagrams of Figure 6c which cumulates, for each fault subsection, all the fractures of the different types. The only excep-tion is the FSIb diagram of the 24 August ruptures, which is poorly representative due to the low number of data. A rather high dispersion characterizes the fractures measured along the FSIIIb (lower‐right diagram in Figure 6c), that we interpret as due to a strong influence of the fracture type. In fact, along this section, we found exclusively Type 3 fractures, affecting unconsolidated debris orflysch deposits, arranged in en echelon sets that are generally oriented obliquely at a 10° to 20° from the main fault strike (Figure S2).
The 30 October mainshock ruptured at the surface the VRS for 7.6 km (Figure 1b). The ruptures mainly occurred along the main fault trace (blue dots in Figure 6a) but also along synthetic and antithetic splays out-cropping within a few kilometers from the main fault trace (other colored dots in Figure 6a). The CT profile (Figure 6b, upper graph) shows throw values which, for this event (i.e., subtracting the 24 August slip) varies in the 0‐ to 217‐cm range, with four relative maxima nearly coincident with the 24 August ones. Basically, for each fault section, the CT‐curve has one or more relative maxima tapering to zero toward the rupture ends (Figures 3 and 6).
In the northern part of FSII, the CT rapidly increases, up to ~100 cm and, in its middle part, its“Acme Zone” occurs, with the absolute maximum (217 cm, corresponding to a maximum net displacement of 222 cm). In detail, the“Acme zone” is characterized by two well distinct peaks separated by a narrow drop whose corresponding minimum is compensated by the slip occurred on a N‐S striking synthetic fault (Figure 6b, yellow curve), which contribute to maintain the westward downthrow definitely above 2 m.
It is noticeable that where CT values >150 cm are observed, they seem to be partly compensated by the sig-nificant slip occurred along a N‐S striking, 2‐km‐long and continuous, antithetic fault on which CT values up to ~60 cm, have been measured (gray line in Figure 6b, upper graph). Similar compensation effects can be hypothesized along the northern portion of the VRS (FSI), where a clear inverse correlation is observed between the throw associated to the major fault plane (light‐blue line) and the synthetic faults traces (orange curve).
The integral mean Throw Tmeanof the entire 30 October rupture, calculated over a rupture length of 22 km,
is 33 cm (AD = 36 cm). The Tmeanof the 30 October rupture on the VRS (7.6 km long) is 53 cm (AD = 58 cm).
The average coseismic slip vectors calculated along the VRS resulting respectively 240/69 (24 August) and 254/69 (30 October), show a slight deviation from the average 232/65 value obtained averaging long‐term kinematic indicators (Figure 6d).
5.3. Similarities and Differences Between the 24 August and the 30 October Displacement Pattern Along the VRS
The comparison between the displacement patterns characterizing the events of the 24 August and 30 October earthquakes along the VRS (Figures 6, supporting information S1, and Figure S2), has the main aims of verifying the possibility that the coseismic ruptures have been systematically controlled by the
long‐term and active faults, as well as by the fault lithology, earthquake magnitude and seismogenic displa-cementfield at depth.
The following results and considerations may be advanced.
1. The three types of coseismic fracturing described in section 3.2 have been identified in association with both events (Figure 6, supporting information S1, and Figure S2). Among the 24 August ruptures, Types 1, 2, and 3 represent 1%, 28%, and 71%, respectively, of the total data set; among the 30 October ruptures they represent 1%, 33%, and 66%, respectively (Figure S2). The fracturing typology appears to be strongly controlled by the near‐surface lithology outcropping along the fault walls. In fact, Type 1 and 2 highly prevails (up to ~95%) along FSIIb, which entirely develops across the carbonates; whereas Type 3 highly prevails (95%) within detrital deposits along FSIIa, as well as (100%) along FSIIIb. Conversely, the frac-turing typology does not appear to strongly depend on earthquake magnitude. In fact, comparing the 24 August with the 30 October data, Types 1 and 2 increases from 49% to 94% along FSIIb, whereas they decrease from 19% to 5% along FSIIIa.
2. In the 24 August data set, the statistical distribution of ground ruptures, analyzed in association with the different identified FS, appears unimodal, with exception of FSIII, and the average rupture trends are nearly coaxial with the corresponding mean FS trend (Figures 6c and S2). Nevertheless, different degrees of angular deviation characterize FSII and FSIII, as well as, fracture Types 1, 2, and 3 (Figure S2). The lowest deviations (Δ) characterizes Types 1 and 2 of the FSIIb (Δ = 15°); conversely, the largest Δ (42°) is observed for fracture Type III within section FSIIIa.
Also for the 30 October case, a good consistency is observed between the strike‐directions of the coseismic surface ruptures and the average trend of the single fault sections (Figure 6c). The lowestΔ (10°) charac-terizes Types 1 and 2 fractures of FS II and IIIa; conversely, the largestΔ (35°) is observed for fracture Type 3 on segment FSIIIb (Figure S2).
Summarizing, both in the 24 August and 30 October cases, the deviation of the fracture trend mode from the long‐term fault strike is very narrow (10° < Δ < 15°) for fracture Types 1 and 2 and quite larger (Δ up to 42°) for fracture Type 3, as observed along FSIIIb (supporting information S1).
This configuration points out the tectonic control played by the long‐term fault segmentation pattern on the coseismic ruptures and highlights the rheological control played by lithology on the coseismic fracture dispersion.
3. About 74% of the total coseismic displacement occurred on the main VRS trace, as measured in Figure 6. The remaining coseismic slip was accommodated off the main VRS rupture plane, within a 2‐km‐wide deformation zone, by synthetic and antithetic splays at the VRS hanging wall. This configuration is world‐wide common (e.g., Cappa et al., 2014, and references therein).
4. The 24 August and 30 October coseismic slip profiles, although very different in scale, with a ratio of about 1 to 8 (Figure 6b), show the same sinuosity pattern, with wavelengths of 3 orders, controlled by the long‐term segmentation. The first‐order wavelength is of 7–8 km, corresponding to the extent of the entire VRS. The second‐order wavelength is of 2–3 km and coincides with the extent of Fault Sections (FSI, FSII, and FSIII). The third wavelength is of 1–1.5 km and coincides with the extent of fault subsections (FSIa, FSIb, FSIIa, FSIIb, FSIIIa, and FSIIIb). A furtherfluctuation with even shorter wave-length occurs at subkilometer wave-length scale, but it does not appear to be controlled by well distinguished geological features and by the long‐term segmentation of the fault.
Despite the different magnitude and the distant hypocentral location of the 24 August and 30 October events, the associated slip profiles on the VRS (Figure 6b) show the same along‐fault position of the first‐, second‐, and third‐order peaks, but also the same location for the absolute maximum point, e.g., MD), with slip rapidly dropping close to 0, in both north and south direction. For both events, MD is located in the intermediate position of Redentore Section (i.e., FSII), near Scoglio dell'Aquila (SdA in Figures 7a and 7e), where also the observed double‐slip free faces show the highest values (28.5 cm of 24 August displacement 222 cm of 30 October displacement). Therefore, the loci of relative and/or absolute displacement peaks appears to be strictly controlled by the tectonic setting and are invariant to magnitude.
Evidence of 24 August and the 30 October surface faulting on VRS demonstrates that, despite the two earth-quakes nucleated on different segments of VBF (located at the southern VRS tip and on BPS, respectively),
10.1029/2018TC005305
the associated coseismic ruptures propagated along the southern VRS, without being hampered by its segmentation, as far as Arquata del Tronto (Figure 1c). This observation disagrees with the reconstruction proposed by Chiarabba et al. (2018), who suggest that the seismogenic sources of the two events are mechanically separated, and also by Suteanu et al. (2018), who hypothesize an active interaction between the Quaternary fault systems and the preexisting compressional structures, as the Sibillini Mts thrust (Figure 4a).
5. The 24 August and 30 October fractures planes are often associated with a variable amount of coseismic horizontal opening (CO). The histograms in Figure S3 (A, B) clearly documents that after both the events, poorly opened fractures (CO < 10 cm) strongly prevail and that the frequency of fractures showing the higher opening values decreases very quickly.
Nevertheless, in the different structural sites, no strict CT/coseismic opening (CT/CO) correlation was highlighted, as fractures with very‐high and very‐low CT/CO ratio were observed both in the 24 August and 30 October cases. In the 24 August case, with rare exceptions, CT results higher than CO, with a
Figure 7. Coseismic ground ruptures generated along the Vettoretto‐Redentore fault segment (VRS) during the 24 August event (left) and along the VRS and its conjugate set during 30 October event (right). The opposite sides of the figure show photographs taken in the same VRS outcrops, (Figures 7b, 7f, and 7g and Figures 7c, 7d, 7h, and 7i) allowing to compare the coseismic slips occurred after the two events. (a) Trace of the 24 August VRS rupture, on a 5‐m‐resolution DTM; measured CT values are given in centimeters as differently colored ribbons along the VRS; (b–d) outcrop view of ruptures due to the 24 August earthquake surveyed along the FSII Redentore section near Scoglio dell'Aquila (SdA) where the higher values of coseismic throw (up to 27 cm) were observed: (e) the 30 October ruptures, along the VRS and the conjugate fault set; measured CT values are given in centimeters as differently colored ribbons along the faults traces; note that the colors correspond to a X10 scale in comparison to the values of Figure 7a and that this scale ratio, between the CT values of 24 August and the 30 October ruptures characterizes almost the entire VRS.
CT/CO ratio generally varying in the ~1:1 to ~2:1 range. The maximum CT value of 27 cm corresponds to a CO value of 30 cm.
In the 30 October case, the maximum value of CO was ~48 cm, that is slightly higher than what observed after the Aug 24 event, but in relation to the maximum observed CT, which reaches 217 cm, it results lower. It is to be noted that ruptures of Type 1, characterized by the highest CT values in absolute, show in general, very low‐to‐null amount of CO (Figures 7g and 7h).
Lower values of CT/CO ratio (i.e., the maximum amount of CO) characterize Type 3 fractures, especially where they break soils or unconsolidated slope debris deposits. This is consistent with mechanisms of fault refraction under very low or no confinement conditions at very shallow depth (Figures 2c and 2f). 6. The coseismic slip vectors were obtained either from evident coseismic slickenlines on the free faces
(Figure 7i) or by correlating coseismic piercing points across the reactivated major fault scarp (Figure 7g). For most of the survey sites, the slip vectors of the 24 August earthquake result parallel to those of the 30 October mainshock (black arrows, along the VRS trace in Figure 6a and stereoplots in Figure 6d). In case of“double‐slip free‐face,” the parallelism between the 24 August and 30 October slip vectors is evident (Figures 7g and 7h). As well, at any place, the coseismic slip vectors are nearly parallel with the long‐term ones (Figure 6d), further supporting the evidence of a geological structural control on the coseismic pattern. In particular, along the VRS trace (Figure 6a), FSI results nearly dip‐slip, FSII shows a slight right‐lateral component (average pitch angle 75°W) and FSIII shows a minor left‐lateral component (average pitch angle 80°E).
7. To quantitatively compare the 24 August and 30 October displacementfields surveyed along VRS, we may express each of them in terms of total throw calculated as the area subtended by the throw profile (throw area, TA) and of maximum to mean throw ratio (Tmax/Tmean). The 24 August TA is equal to
~5.52 × 10⁻⁴km2, over an along‐strike length (L) of 5.8 km. The 30 October TA measured along the VRS is equal to ~4.01 × 10⁻³km2, over an along‐strike length (L) of ~7.6 km. The ratio TA24/TA30is
nearly 1:7; as well, the throw‐ratio between corresponding points, that is, having the same along‐strike position on the 24 August and 30 October slip profiles, ranges from ~1:5 to 1:10.
Tmax/Tmeanratios can be converted in the net displacement ratio MD/AD taking in account the average dip‐
angle values of the various sections of VRS.
MD/AD are equal to ~2.3 for 24 August ruptures and to ~4 for the 30 October ruptures. Therefore, they both differ from the value typical for most large M > 6 earthquakes (~2) when the length of the ruptured segments is L≤ 2Wseism(Wseismbeing the thickness of the seismogenic layer; Manighetti et al., 2005). This anomaly
almost disappears if we do not consider the overall VRS length, but if we take into account its partitioning in sections and subsections. In particular, MD~2 AD values are effectively obtained when considering the 3° order fault subsections (Figure S4).
8. In order to compare the 24 August and 30 October VRS displacementfields with similar worldwide cases, we normalized respect to the SRL the slip profiles obtained for the entire VRS, its fault sections and sub-sections. We expressed our data set in terms of D/AD versus Lnorm= L/Lmax(where Lmaxis the total SRL,
Figures S4a and S4b). In particular:
a For the 24 August event, we calculated the total normalized profile, corresponding to the entire ruptured VRS segment, three partial profiles for the FSI, FSII and FSIII sections and four profiles for the FSIb, FSIIb, FSIIIa and FSIIIb subsections (Figure S4a);
b For the 30 October event, we calculated the total VRS normalized profile, three partial profiles for FSI, FSII, and FSIII sections and six profiles for the FSIa, FSIb, FSIIa, FSIIb, FSIIIa, and FSIIIb subsections (Figure S4b).
In the 24 August total VRS normalized profile, the D/AD ratio is largely <2 and the intervals where it exceeds this value are very narrow. Reducing the observation scale, the fault sections profiles suggest that, along FSI and FSII, D/AD is constantly <2 whereas it exceeds this values at various intervals along FSIII and FSIIIa and FSIIIb, Figure S4a.
The 30 October total VRS profile shows an evident double peak where the D/AD ratio reaches the value of 4, in correspondence of the Scoglio dell'Aquila (SdA, Figure 7e), while remaining largely <2 elsewhere. Also in
10.1029/2018TC005305
this case the profiles reconstructed for the section and the subsections, indicates that FSIII is characterized by a more irregular trend of D/AD ratio and by repeated points with values >2 (Figure S4b).
6. Discussion
6.1. Local Tectonic Control of the Anomalously High MD
The Redentore fault section (FSII) of the VRS is characterized by a zone of very high MD localized in a ~700‐m‐long trace. Based on a detailed topographic survey made with terrestrial LiDAR in the hanging wall of the area affected by MD, we propose that at least part of MD (~16–18%) can be due to hanging wall back‐ tilting (Boncio et al., 2018; Di Donato et al., 2018). Back‐tilting can accommodate volumetric problems in the hanging wall due to up‐dip steepening of the fault. Considering that the fault is on limestone bedrock, the steepening is not due to refraction in unconsolidated deposits but should be due to dip variations of the bedrock fault surface. In the same area there is an antithetic hanging wall fault rupture located 400 to 650 m from the principal fault (Figure 6a). Both back‐tilting and antithetic faulting might result from volu-metric adjustment in the hanging wall due to fault dip variations at depth.
Interestingly, in the same trace of the Redentore fault section the slip vectors, both from long‐term slicken-sides (generated at depth and exhumed by repeated coseismic slip, as shown by Smeraglia et al., 2017) and coseismic smearing of hanging wall soil, deviate of 20–40° from the average (N230°) slip vector, while the fault strike is nearly constant (Figure 6a). The angular deviation increases northwestward.
The coexistence of all these features (slip vector variation, back‐tilting, antithetic faulting, and very high dis-placement) along the same short fault trace suggests that they can be explained by a common local cause. A possible explanation is a fault irregularity at depth, such as a down‐dip fault jog that decreases the fault dip. In order to explain the slip vector deviation, this jog should have a component of dip toward NW. This irre-gularity should be sufficiently deep to justify the formation of slickensides in the bedrock fault and suffi-ciently shallow to be compatible with the location of the antithetic fault. Taking into account the distance in the map between the VRS and its antithetic, and the dip‐angle at surface of both the faults, which deter-mines the position of their intersection, we suggest that the fault irregularity should be at depths on the order of 1 km.
In summary, part of the localized anomalously high MD can be due to local tectonic factors due to deep fault irregularity. This geometrical, and therefore persistent, irregularity could have produced recurring, very high, and localized displacements in the same narrow location, as indicated by both (a) the striking corre-spondence between the MD and the high maximum cumulative Late Quaternary and long‐term slip (Figure 6b) and (b) the exhumed bedrock slickensides with oblique slip vectors.
6.2. Comparison With Empirical Relationships and Displacement Profiles of Global Earthquakes
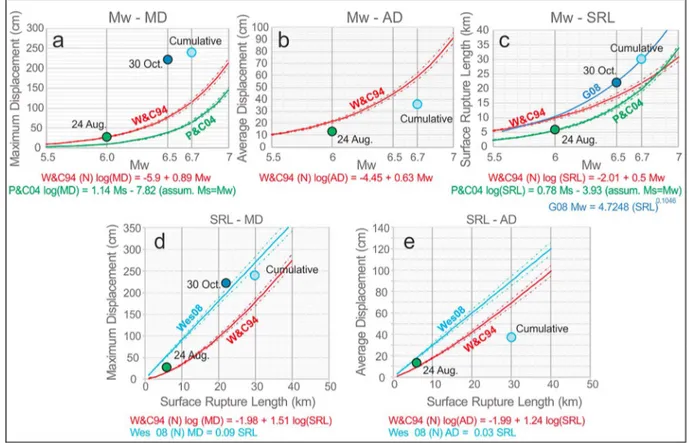
The coseismic parameters of the 24 August, 30 October, and cumulative 24 August to 30 October surface rup-tures are compared here with global coseismic data available in the literature in the form of empirical rela-tionships (Figure 8) and normalized displacement profiles (Figure 9 where all the profiles have been plotted in order to have the same asymmetric shape). In Figure 8 we compare the obtained SRL, AD, and MD data with empirical relationships among rupture parameters and magnitude published by Wells and Coppersmith (1994) and Wesnousky (2008) for global normal faulting earthquakes, by Pavlides and Caputo (2004) for Aegean earthquakes (mostly normal faulting) and by Galli et al. (2008) for Italian faults. For the 2016 cumulative rupture, we used a cumulative magnitude Mw= 6.7, obtained by summing the
seis-mic moment of the 24 August to 30 October M > 5.0 earthquakes on the VBF, which is in good agreement with the Mw= 6.64 value obtained by Galli et al. (2016). In particular, we used the average of the resulting
cumulative seismic moment gathered from different agencies (TDMT INGV at http://cnt.rm.ingv.it/en/ tdmt; RCMT at http://autorcmt.bo.ingv.it/quicks.html; USGS at https://earthquake.usgs.gov/; and GFZ at http://geofon.gfz‐potsdam.de). The comparison with empirical relationships shows that the 24 August rupture parameters are well within the values predicted by the empirical regressions. Instead, the para-meters for the 30 October and cumulative ruptures divert significantly from the empirical regressions for Mw versus rupture parameter (Figures 8a–8c). The MD is much higher than the expected values
(Figure 8a), whereas AD is significantly lower (Figure 8b). SRL approaches the empirical regressions better than MD and AD, andfits well the Galli et al. (2008) regression (Figure 8c). Also, the SRL versus MD
regressions agrees with the 30 October and cumulative data (Figure 8d), mostly because the observed values locate between two different regressions (Wells & Coppersmith, 1994; Wesnousky, 2008). Nevertheless, the observed MD is again higher than, or close to the upper bound (i.e., the Wesnousky, 2008, regression) of the empirical regressions.
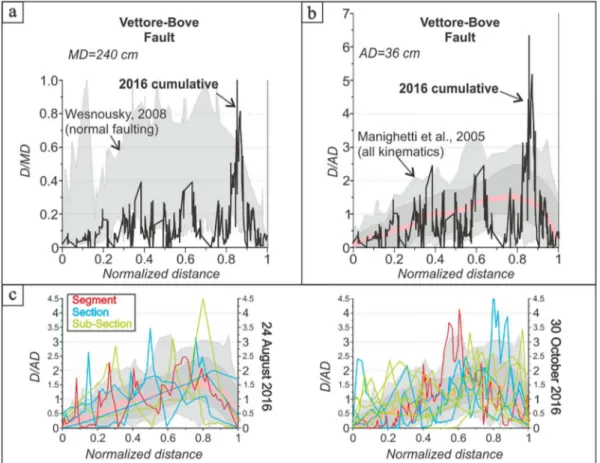
In Figure 9a the displacement profile, normalized by the MD, D/MD, plotted against the normalized fault length, L/SRL, is compared with a compilation of normalized displacement profiles for normal faulting earthquakes published by Wesnousky (2008). The 2016 profile locates close to the lower boundary of global normal faulting displacement profiles. This is clearly an effect of the very high 2016 MD. In Figure 9b, the displacement profile, normalized by the AD, D/AD (integral mean), is compared with the compilation of D/AD profiles published by Manighetti et al. (2005, their Figure 2c), which includes events of all kinematics. The 2016 D/AD profile is much closer to the global mean than the D/MD profile does, suggesting that the AD can better represent the average characteristics of the displacementfield. In Figure 9c we performed the same comparison (D/AD vs. normalized distance) for the single fault segments, sections and subsections, for both the 24 August (VRS, left diagram) and cumulative, post‐30 October ruptures (entire VBF, right dia-gram), using data elaborated and shown in Figures S4 and S5. At the scale of the single segments and, even more, of sections and subsections, the displacement distribution normalized by AD seems to follow the glo-bal average better than the entire system. This might suggest that divergences from gloglo-bal averages can be due to the segmented nature of the VBF.
As aforesaid, the anomalously high MD can be explained by the occurrence of localized tectonic phenom-ena, due to volumetric accommodation of fault irregularities at depth, which increase abruptly the amount of slip. Also the segmentation of the VRS, characterized in correspondence of the FSII and FSIII sections by sharp fault bends, has been invoked by Iezzi et al. (2018), as the possible cause of the abrupt increases of the CT along the fault strike.
Figure 8. Comparison of the 2016 coseismic parameters with global empirical relationships among magnitude and rupture parameters MD (a), AD (b), and SRL (c), and between SRL and MD (d) and SRL and AD (e) from Wells and Coppersmith (1994, W&C94), Wesnousky (2008, Wes08), Pavlides and Caputo (2004, P&C04), and Galli et al. (2008, G08). For P&C04, in the range of magnitudes considered (6.0–6.7), we assumed that Msapproximates Mw.
10.1029/2018TC005305
Anyway, whatever the cause of this anomalous value of MD, it raises a question on how reliable the regres-sions between magnitude and MD are. Infact other past large earthquakes, used for constructing the empirical regressions, could have suffered similar problems. The problem arising from possible local exag-gerated response to faulting, due to graben formation or back‐tilting, and the implications for estimating the magnitude from MD are discussed since many years in the paleoseismological literature (e.g., McCalpin, 2009).
Though AD seems to represent the overall displacement of the 2016 earthquakes better than MD, it is signif-icantly lower than the empirically predictable values. This difference deserves to be discussed. A possible explanation lies in the highly segmented nature of the VBF that is formed by several fault segments and sections, accompanied by secondary synthetic and antithetic faults (Figure 3). Most of them reactivated in 2016. This very high segmentation pattern might have distributed and attenuated the coseismic displace-ment toward the Earth surface during the propagation of the coseismic slip from the deep seismogenic source, resulting in a generalized low value of AD when compared with global averages.
Furthermore because of the very segmented and articulated geometry of the fault, a minor, but not comple-tely negligible, amount of the coseismic slip could have been accommodated by minor synthetic splays branching at depth from the VBF and outcropping outside the area investigated by us and other authors (Civico et al., 2018; Emergeo Working Group, 2017; Villani, Civico, et al., 2018; Villani, Pucci, et al., 2018), which includes a band of about 2–3 km straddling the main fault segments.
Figure 9. (a) 2016 cumulative (24 August to 30 October) displacement profile normalized to the maximum displacement (MD) and compared with normalized displacement profiles of normal faulting earthquakes (five earthquakes) compiled in Wesnousky (2008); (b) 2016 cumulative displacement profile normalized to the average displacement (AD) and com-pared with normalized displacement profiles of surface faulting earthquakes analyzed in Manighetti et al. (2005, their Figure 2c; 44 earthquakes of any kinematics); c) normalized displacement profiles (D/AD) of single segments, sections and subsections of the 24 August and 30 October (cumulative) ruptures (profiles are shown in Figures S4 and S5) compared with data from Manighetti et al. (2005). These latter are graphically summarized as follows: Light‐gray area includes all the data; dark‐gray area includes most of the data; pink thick line is the average.
Concerning the implications for seismic hazard analysis such as in fault‐based probabilistic seismic hazard assessments (e.g., Valentini et al., 2019), the empirical regression that seems to better predict the maximum expected Mw(here considered as the cumulative Mw= 6.7) is that for SRL (predicted Mwcomprised between
6.7 and 6.8 for normal faulting). Instead, regressions for AD and MD should be used cautiously for highly segmented faults such as the VBF. Caution is needed in using single‐site paleoseismologic displacement, or empirically derived AD or MD, together with slip rate for estimating average recurrence times of the max-imum expected earthquake. For example, the slip rate obtained from sites close to the MD or far from it can be very different. The acritical using of this value can seriously overestimate or underestimate the average recurrence time. The 2016 displacementfield suggests that it is highly recommended the using of displace-ment per event values and slip rates deriving from the same site, or from short stretches of the same fault.
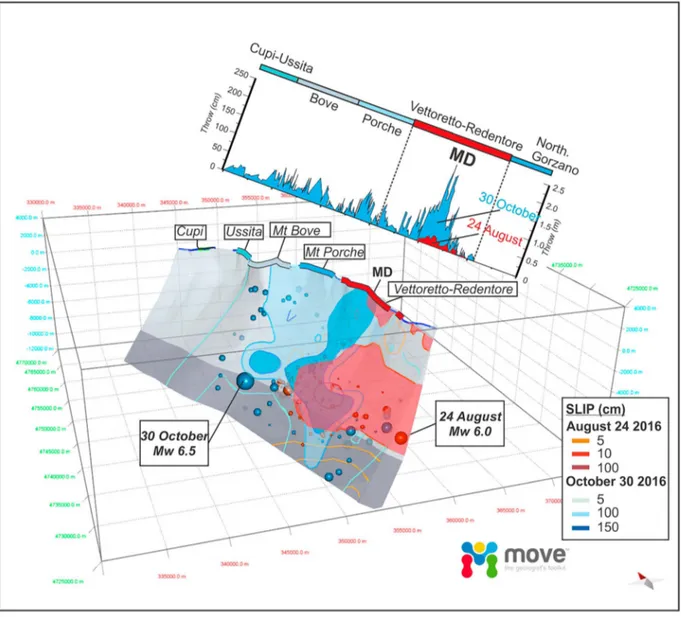
Figure 10. Coseismic slip profiles reconstructed for the VBF (upper graphs) compared with the slip distribution obtained from inversion of DInSAR data on the modeled subsurface fault plane (3‐D model below). The graphs compare the total VBF coseismic slip profiles following the 30 October (line subtending blue area) and the 24 August events (line subtending red area). The whole data set used to trace both the curves is provided as supporting information S1. The 3‐D model of the Vettore‐Bove fault (from Lavecchia et al., 2016, 2017) shows location of (1) 24 August and 30 October surface maximum displacement (MD) near Scoglio dell'Aquila, (2) 24 August and 30 October iso‐contour lines of coseismic displacement obtained from source modeling by Xu et al. (2017; slip value expressed in cm as in the bottom right legend), and (3) hypocenters of the 24 August and 30 October events and of the corresponding early aftershocks (first 12 hr after each event; red balls = 24 August event and following early aftershocks, blue balls: 30 October event and following early aftershocks). A good agreement is found between the observed slip at surface and the slip values modeled at depth. To notice the significant overlap between the higher values of the displacement fields of both the events (slip >10 cm for the 24 August earthquake and >100 cm for the 30 October mainshock) in the subsurface of the Vettoretto‐Redentore fault segment and, particularly, of the Scoglio dell'Aquila apex (SdA, Figure 7) where the maximum displacement (MD) is observed.
10.1029/2018TC005305
6.3. Comparison With Slip at Depth
The 24 August and the 30 October coseismic slip pattern may be further analyzed in comparison with coseismic slip reconstructed at earthquake sources depth. In the literature, are available the source parameters and the slipfields obtained, for both events, through inversion of DinSAR and GPS measure-ments (Xu et al., 2017, for the three events with Mw > 5.5; Tung & Musterlark, 2018, for only the 24
August earthquake) as well as the 3‐D reconstruction of the entire VBF activated by the two events (Lavecchia et al., 2016, 2017).
Starting from these data we have projected onto the VBF 3‐D model, through the use of the Midland Valley Move software (Figure 10):
1. the iso‐slip contour lines of the 24 August and 30 October on seismogenic sources, reconstructed from the Xu et al. (2017) slip data;
2. the hypocenters of the two earthquakes and of the following“early aftershock” (occurred during the first 12 h after the two major events); and
3. the position at the surface of the 24 August and 30 October common zone of MD.
The 24 August and 30 October zones of MD do not correspond to the same site but are located very close to each other. The 24 August hypocenter is located SSW of MD, at an along‐strike distance of 13 km. The 30 October hypocenter is located NNE of MD, at an along‐strike distance of 12 km. At the surface, the 24 August and 30 October zones of MD overlap in correspondence of the Redentore Fault Section (FSII in Figure 6) of the VRS. At depth, the corresponding displacementfields overlap over a more extended area, in any case located beneath the FSII of VRS.
The 3‐D geometry of the 2016 displacement field shows a certain consistency with the model proposed by Manighetti et al. (2005) who defined, from the analysis of several normalized displacement profiles, a zone of maximum slip (defined as major asperity) and a distance from the maximum slip within which the earthquake is expected to nucleate. This distance should correspond to ~20–30% of total rupture length. Moreover, the overall 2016 displacement profile has an asymmetric shape that resembles that highlighted by Manighetti et al. (2005) and by other authors (e.g., Wesnousky, 2008). Nevertheless, the 2016 cumulative displacement profile is far from the simple triangular function proposed by Manighetti et al. (2005), which implies MD ~2 AD. The simple triangular model applies better to the single 24 August earthquake.
In the central Italy seismic sequence, the zone of maximum slip is clearly controlled by structural geology, corresponding to the Redentore section of the VBF.
Considering that the MD of the 24 August to 30 October events well coincides with the fault section where the post‐LGM offset (Figure 5) is maximum and where also the long‐term stratigraphic throw across the fault shows the highest values (Figures 4 and 6b), we conclude that maximum coseismic slip due to reactivation of the entire VBF recurs systematically in the central stretch of the Redentore fault section.
7. Conclusions
We offer a high‐resolution image of the 24 August and 30 October coseismic displacement fields recon-structed at the surface for the VRS and the whole VBF (Figures 3 and 6) compared with the corresponding long‐term (i.e., geologic) fault segmentation pattern.
The pattern and the timing of the observed coseismic surface ruptures, together with the distribution of the major earthquakes (Mw> 5) and the extent of the area covered by the early aftershocks following them,
sug-gest that all three main segments of the VBF (Vettoretto‐Redentore, Bove‐Porche, and Cupi‐Ussita, Figure 1) were reactivated; the VRS was reactivated twice, by both the 24 August and 30 October events.
Our structural data suggest clear correlations between the coseismic deformational pattern and the long‐ term normal faulting pattern, thus contributing to demonstrate the primary tectonic origin of the great majority of the surveyed surface ruptures.
We provide robust constraints to the coseismic parameters of the entire earthquake rupture (SRL, AD, MD, see also Figure 3 for our estimates of the individual 24 August and 30 October parameters). In particular, we
obtained the following: cumulative SRL = 30 km (32 km if a 2‐km‐long uncertain rupture at the southern end of the M. Vettore fault is considered), AD arithmetic = 37 cm, AD integral = 36 cm; MD = 240 cm, 222 cm of which due to the 30 October event.
Analyzing in depth the slip distributions of the 24 August and 30 October earthquakes and comparing them with the long‐term (Late Pleistocene to present) fault geometry and displacement obtained from structural geology and fault scarp profiling, we highlight the strict control exerted by the faults pattern and their segmentation on the development of the overall seismic sequence and of the energy release.
In particular, the slip distribution reconstructed along the VBF and more in detail along VRS is characterized by a complex along‐fault sinuosity with alternation of displacement peaks and depressions (Figures 3, 6, S4, and S5). Along the VRS slip profile, three well‐distinct wavelength orders of fluctuations can be recognized that reflect the long‐term hierarchic organization in fault segments, fault sections, and subsections. Interesting to note that the peaks of coseismic displacement, corresponding to fault sections and subsections, that were activated by both events, have just the same along‐strike positions (Figure 6b), although they show different amplitude;
The dominant role played by the Redentore section FSII of the VRS, in terms of displacement, is not only a coseismic feature but also a long‐term geological feature as highlighted by the good agreement between the shape of the coseismic, long‐term and Late Quaternary (i.e, after LGM) slip profiles (Figure 6). The possible significance of the FSII as a long‐term preferential zone of slip is moreover supported by geological evidence that this fault section bounds eastward the Piano Grande plain (Figure 4), which is the only Late Pleistocene‐ Holocene basin developed in the entire VBF hanging wall.
The 30 October mainshock also ruptured the northernmost Bove‐Porche segment and, maybe partly, the Cupi‐Ussita segment (Figure 3). The overall observed surface slip exhibits a roughly sinusoidal distribution, where wavelength, MD, and mean slip progressively decrease northward along the fault.
The comparison between the coseismic parameters of the 24 August, 30 October, and cumulative 24 August to 30 October surface ruptures (cumulative magnitude Mw= 6.7, see section 6.2), with global
coseismic data from the literature, show that the 24 August rupture parameters agree with the values pre-dicted by the empirical regressions. On the contrary, for the 30 October, the MD is significantly higher than the expected values and AD is lower than the expected value (Figures 8a–8c). SRL is close to the empirical regressions, but it is still higher than values predicted by most of them (Figure 8c). The relation-ships that bestfit the 30 October and cumulative data are the SRL versus MD regressions (Figure 8d), even though, the observed MD is again above than, or close to, the upper expected bound, that is, the Wesnousky (2008) regression.
The MD value, exceeding the expected, might be due in part to localized tectonic back‐tilting or graben for-mation, due to deep irregularities of the main fault surface. At the same time, the good correlation between the coseismic MD, the post‐LGM and geological MD (Figure 6b) suggests that the MD recurs systematically in the same section of the fault (FSII, Redentore section).
The AD value, lower than the expected, might be probably caused by a scattering of coseismic displacement toward the surface, possibly due to the high segmentation of the fault system.
One of the main suggestions that derive from our analysis is that high‐segmented faults could cause higher SRL and lower AD values than expected from regressions based on global earthquakes.
Our results suggest caution in using regressions based on MD because it cannot be ruled out that other global earthquakes might be affected by comparable problems.
Similarly, caution is needed in the use of AD and MD, for seismic hazard analysis, when obtained indirectly from other parameters (fault length and expected magnitude).
Finally, the use of displacement values and slip rates for calculating recurrence times of large earth-quakes have to be carefully evaluated: In fact, using displacement values measured on a section of the fault, where D~AD and slip rate values obtained in a section close to MD, lead to underestimate the recurrence time and vice versa. In other words, when the aforementioned coseismic parameters are to be used for these purposes, it is necessary, as much as possible, to determine them at the same point of the fault.