R E S E A R C H A R T I C L E
Open Access
Exploring the networking behaviors of
hospital organizations
Fausto Di Vincenzo
Abstract
Background: Despite an extensive body of knowledge exists on network outcomes and on how hospital network structures may contribute to the creation of outcomes at different levels of analysis, less attention has been paid to understanding how and why hospital organizational networks evolve and change. The aim of this paper is to study the dynamics of networking behaviors of hospital organizations.
Methods: Stochastic actor-based model for network dynamics was used to quantitatively examine data covering six-years of patient transfer relations among 35 hospital organizations. Specifically, the study investigated about determinants of patient transfer evolution modeling partner selection choice as a combination of multiple organizational attributes and endogenous network-based processes.
Results: The results indicate that having overlapping specialties and treating patients with the same case-mix decrease the likelihood of observing network ties between hospitals. Also, results revealed as geographical proximity and membership of the same LHA have a positive impact on the networking behavior of hospitals organizations, there is a propensity in the network to choose larger hospitals as partners, and to transfer patients between hospitals facing similar levels of operational uncertainty.
Conclusions: Organizational attributes (overlapping specialties and case-mix), institutional factors (LHA), and geographical proximity matter in the formation and shaping of hospital networks over time. Managers can benefit from the use of these findings by clearly identifying the role and strategic positioning of their hospital with respect to the entire network. Social network analysis can yield novel information and also aid policy makers in the formation of interventions, encouraging alliances among providers as well as planning health system restructuring. Keywords: Networking behavior, Hospital organizations, Patient transfer, Social network analysis
Background
Interest in understanding how and why hospital organi-zations choose collaborative partners overtime is a rela-tively recent issue and is related to a new strand of research that investigates these phenomena using con-cepts and methods from organizational sociology and network theory [1–5]. Networking behavior of organiza-tions matters because they can achieve better perfor-mances, mitigate competition, learn by interaction, and develop effective ways to absorb external knowledge pro-duced by their partners [6–9]. Networking matters also be-cause organizations are connected to their environments through other organizations [10]. As a consequence, the
quality, quantity and value of resources that an organization can access and the terms of availability of such heavily de-pend on the relations that it is able to establish with ex-change partners [11].
Previous literature assumes that existing and past rela-tions among organizarela-tions may act endogenously to in-duce networking [7, 12], and how the position that an organization occupies in the web of industry relations af-fects the formation of networking relationships [13]. Despite an extensive body of knowledge exists on net-work outcomes and on how netnet-work structures may con-tribute to the creation of outcomes, less attention has been paid to understanding how and why organizational networks emerge, evolve, and change [14].
A quantitative exploration based on social network analysis (SNA) and specifically on stochastic actor-based Correspondence:[email protected]
Department of Economic Studies, G. d’Annunzio University, Viale Pindaro 42, 65127 Pescara, Italy
© The Author(s). 2018 Open Access This article is distributed under the terms of the Creative Commons Attribution 4.0 International License (http://creativecommons.org/licenses/by/4.0/), which permits unrestricted use, distribution, and reproduction in any medium, provided you give appropriate credit to the original author(s) and the source, provide a link to the Creative Commons license, and indicate if changes were made. The Creative Commons Public Domain Dedication waiver (http://creativecommons.org/publicdomain/zero/1.0/) applies to the data made available in this article, unless otherwise stated.
model for network dynamics [15–17] was employed to understand networking behavior dynamics of hospital organizations, and specifically to identify the endogen-ous and exogenendogen-ous determinants underlying the propen-sity of hospitals to exchange network ties. The research relies on original fieldwork and longitudinal data on pa-tient transfer relations within a regional community of hospital organizations in Italy. Patient transfer flows re-flect collaboration and the existence of underlying rela-tionships between the hospitals involved [1, 2]. Patient transfers between hospitals are directly observable and require high levels of coordination and communication [3]. The transfer of a patient requires the exchange of detailed clinical information which by definition, is com-plex due to the growth and specialization of clinical knowledge and the multiple combinations of conditions that patients can be subject to, and involves the co-construction of an understanding of the patient that needs also to consider the cognitive aspects of the actors involved in the exchange [18].
Recently, a number of studies have addressed the is-sues of the determinants of patient transfer between hospital organizations. In order to reduce staff uncer-tainty and coordinate their efforts, hospitals tend to routinize destination selection such that staff immedi-ately contacted a“usual” transfer destination [19]. Trans-fer destination selection, therefore, was primarily driven at an institutional level by organizational concerns and bed supply, rather than physician choice or patient preference [19]. Remaining within the ambit of the organizational features, further studies have shown how patients are more likely to be transferred between hospi-tals differing in size [20], high-volume and larger hospi-tals are more attractive partners than small hospihospi-tals based on their greater availability of resources and infra-structures [21], resource complementarity especially in terms of technological assets and expertise matter in explaining the propensity of hospital to collaborate [22], and that patients often move from low-performance hospitals to high-performing hospitals [1, 20]. Among the institutional variables, it was highlighted how pa-tients are more likely to be transferred between hospital belonging to the same Local Health Authority (LHA) and having the same organizational forms (ownership-governance structure) [3]. Finally, the literature analyzed the impact of the geographical variable, highlighting how geographically proximate hospitals were somewhat more likely to share patients [2,23].
Despite this abundance of studies, most of them have in common the limit of being studies with a cross-sectional data setting or that have not been pushed to longitudinally analyze the evolution of patient transfer dy-namics in a wide span of time. There are two researches that, however, are an exception to this limitation. The first,
conducted by Lomi et al. [4], observed patient sharing events between hospitals during four consecutive years finding that quality of care, measured as 45-day risk-adjusted readmission rate, has an impact on the pro-pensity of hospital organizations to exchange patients over time. The second, conducted by Stadtfeld et al. [5], explains assimilation and differentiation mechanisms (among which the propensity to transfer patients) be-tween network partners over time. However, currently, no studies have already provided a longitudinal investi-gation of the determinants of patient transfer evolution employing stochastic actor-based model for network dynamics, and modeling partner selection choice as a combination of multiple organizational attributes and endogenous network-based processes. The present study aims to fill this gap in the literature.
Methods Research setting
The dynamics of patient transfer relations within the en-tire network of hospitals providing services to patients in Abruzzo, a region in central Italy with a population of approximately 1,300,000 residents, have been analyzed. The Italian National Health Service (I-NHS) is a publicly funded health system that provides universal coverage. The government, at the central level, allocates resources to 20 Italian regions and is responsible for defining the core benefit packages and ensuring that basic coverage is provided to the entire population. Regional governments have wide autonomy in planning, allocating resources, and organizing regional level services, and are respon-sible for delivering health care services to their resident populations.
The Abruzzo regional health system is entrusted to six LHAs, and health care services are provided by 35 hos-pital organizations (22 public and 13 private). Of the 22 public hospitals, two are teaching hospitals. Public hos-pitals provide highly specialized hospital care and are characterized by technical, economic, and financial au-tonomy. Teaching hospitals are hospitals linked to uni-versities, and provide education, research, and tertiary care. Private hospitals are partially financed by the re-gional healthcare service and are investor-owned organi-zations that provide ambulatory assistance, hospital care, and diagnostic services.
The study setting seems to be particularly appropriate for the purpose of this research. The first reason is that earlier research in this context [3, 24,25] and the field-work show the presence of local netfield-works of collabor-ation among hospitals, which mainly stem from the transfer of patients between hospitals. Patient transfer occurs when one hospital directly transfers one or more elective patients to another hospital. For example, hospi-tals that provide only basic services may send patients
with more complicated clinical problems to another provider that offers comprehensive specialty care. Patient transfer may also be driven by‘asymmetries’ in regional providers’ clinical resources or competences: e. g., hospitals may transfer patients to other local pro-viders if they lack the necessary medical equipment (e. g., intensive care unit beds), expertise (e.g., staffing), or supplies. These informal networks become established and can have important implications for organizational performance [24,25].
The second reason is that, given the great strategic and organizational autonomy of our empirical setting, there are no significant external factors that influence the networking process for which to control. In the period considered in this study, there were no significant policy interventions that substantially altered the institu-tional framework, the number of providers, or the struc-ture of the local inter-organizational network. Exception is the progressive reduction in the number of beds set by regional authorities, but this has affected propor-tionally all hospitals.
The third reason why this is an ideal case to study network dynamics is that Abruzzo health care system suffers from a lack of systemic planning and strategy co-ordination among its hospitals [26]. Unlike some other regions that have fostered inter-hospital collaboration through well-defined and formal collaboration mecha-nisms (e.g.,“hub&spoke” models or clinical pathways for patient referrals), coordination in Abruzzo emerges mainly through patient transfer among providers [3]. Especially in regions where systemic planning and or-ganizing of health provision is lacking, collaborative ini-tiatives among hospitals arise and evolve endogenously [26]. These emergent “self-organizing” properties of inter-hospital networks may produce outcomes and be-haviors that can be investigated by employing longitu-dinal models and social network analysis [15].
Data collection
The analysis draws on a range of rich data. Data on patterns of collaborative interdependencies during the period 01/01/2003–31/12/2008 among all hospitals in the region were extracted from the hospital information system database managed by the Abruzzo Region. Data on hospital activities, and information on demographics and performance, were taken from the Abruzzo Health Agency archives and yearly reports. These data are col-lected regularly and archived digitally by the Region for administrative purposes, and by the Health Agency for its operational and reporting activities. Archival sources are generally more precise and detailed than surveys and provided complete information on the network of hospitals: there were no missing data.
Variables
Dependent variable
Since this study is interested in understanding the dy-namics of networking behavior of hospital organizations, the dependent variable is inter-hospital collaboration measured as transfers of patients [1, 2, 22]. Using avail-able data on patient transfer among regional hospitals, as dependent variable, six“35 × 35” dichotomized matri-ces one for each of the years from 2003 to 2008 were built. The rows and columns of each matrix respectively report the hospitals that sent and admitted at least one patient between January 1 and December 31 in each of the year considered. Because matrices may vary depending on the dichotomization criteria, separated analyses were conducted to assess the effect on the results of different criteria (i.e. “greater-than” mean value, “greater-than” zero). The results obtained were qualitatively similar. Explanatory variables
This research tested for several organizational-level vari-ables that might influence networking behavior of hos-pital organizations. Specifically:
Case mix Measure of the level of complexity of the cases which are treated in a given hospital. It measures if hospitals facing with highly complex cases (for example, transplants, stroke, or hearth attacks) have different net-working behavior compared to hospitals treating patients with a low degree of disease severity (for example, appendicitis, rehabilitation, etc.).
N° of common specialties It counts the number of overlapping specialties, and indicates to what extent two hospitals are alike because they do the same thing or not. It serves to investigate whether the transfer of pa-tients occurs between hospitals that overlap in know-ledge stocks. Using available data on specialties (clinical wards) present in each hospital in the region, was built a “35 × 35” matrix. The rows and columns of the matrix respectively report the hospitals in the Region, while the cells of intersections report the number of overlapping specialties between each pair of hospitals. The matrix was computed for the year 2003 and was regarded as a constant in the statistical model as there have not been major changes in the number and types of specialties present at each hospital during the six years.
Staffed beds A proxy of dimension, measured as the number of staffed beds [1,20].
LHA membership It considers the affiliation of hospi-tals to the distinct LHAs in which the region is divided [3]. In a “35 × 35” matrix, the rows and columns of the matrix respectively report the hospitals in the Region,
while the cells of intersections report 1 if pairs of hospi-tals were affiliated to the same LHA, 0 otherwise. Performance Measured as productivity, has been com-puted as the total number of admissions adjusted for case mix, divided by total number of staffed beds [24]. Geographical distance A “35 × 35” matrix, the rows and columns of the matrix respectively report the hospitals in the Region, while the cells of intersections report the distance between each pair of hospitals expressed in km [23].
Percentage of emergency admissions It represents un-planned emergency admissions as a percentage on the total admitted patients, as in previous studies [27]. It is commonly used as proxy of the level of uncertainty of input (i.e. patients) faced by the hospital [22].
Each variable was computed yearly, for the six-year period 2003–2008. Table 1 presents the descriptive statistics for the independent variables used in this research.
Geographical distance between hospitals, LHA mem-bership and the number of specialties are constant over time, showing the absence of structural policies for the re-designing of the hospitals regional system. The mean of staffed beds reduces over time (such as the percentage of emergency admissions) while the case mix complexity and the productivity indicators slightly increase in the six years analyzed. Table 2 reports correlations among all the variables included in the full model.
In the estimation, the model controlled also for some structural endogenous effects named respectively outde-gree, reciprocity, transitive ties, three cycles, balance, indegree-popularity, and outdegree–activity. Table3 de-scribes in detail each of the types of relational patterns investigated and how they should be interpreted. Only these simple and basic effects and not for the more so-phisticated ones have been included in the model be-cause they represent the most commonly used in works that exploits stochastic actor-based models [28,29]. Estimation technique
The R-Siena Software Package [15] allowed to conduct the exploratory analysis. The observed changes can be explained as functions of both individual and dyadic characteristics of actors and structural effects. Specific actor attributes and dyadic characteristics either favor or reduce the probability that two hospitals will transfer pa-tients and so collaborate. For each actor and dyadic at-tribute, several effects have been included in the model specification. As explained by Snijders et al. [15], for continuous actor covariates (e.g., staffed beds, case mix, productivity, emergency admissions), three kinds of
actor-driven mechanisms can be specified. The sender (ego) and receiver (alter) effects evaluate the tendency for organizations with higher attributive value to, re-spectively, send out more (higher outdegree) or receive more (higher indegree) than others. The“similarity” ef-fect measures whether collaborative relations tend to occur more often between organizations with similar values for a given attribute. Finally, for the constant dyadic (LHA membership and overlapping specialties), the effects included in the model measure the tendency for ties between actors with the “same” value of that variable. Structural effects represent endogenous net-work mechanisms that also may influence the probabil-ity of interdependence between actors. For examples of introductory papers employing stochastic actor ori-ented models the reader can refer to Snijders, van de Bunt and Steglich [15]. For a more mathematical treat-ment and definition of effects in such models for net-work dynamics the reader can refer to Ripley et al. [29]. Results
Table 4reports key statistics describing the evolution of network ties in terms of density (i.e. ratio of number of collaborative ties observed yearly on the total number of possible ties), average degree (i.e. average number of col-laborative partners for each node), and total number of ties. With the exception of the year 2006, density and number of ties increased slightly from 11% in 2003 to 12.2% in 2008, and from 131 in 2003 to 145 in 2008 re-spectively. Also, in the six-year period observed, the average number of collaborative ties increased from 3. 743 to 4.143.
To explore networking behavior dynamics more in-depth, have been also considered the collaborative pat-terns at dyadic level over time (see Table5). The column labeled 0→ 0 reports the number of pairs of hospitals that did not develop a collaborative relationship in the observed wave; the column labeled 1→ 1 indicates the number of pairs that maintained their collaborative rela-tionships. The other two columns report the number of ties formed or dissolved from one year to the next. Con-sistent with the third column in Table 4, also Table 5 shows a growing trend in tie changes: during the period of observation, 213 new collaborative ties were formed and 199 existing relationships were dissolved. The Jac-card coefficient is a measure of similarity for two sets of data, with a range from 0% to 100%. The higher is the percentage, the more similar are the two networks of hospitals. The values in Table 5 show that around 50% of ties, over time, change between subsequent observa-tions from one year to another.
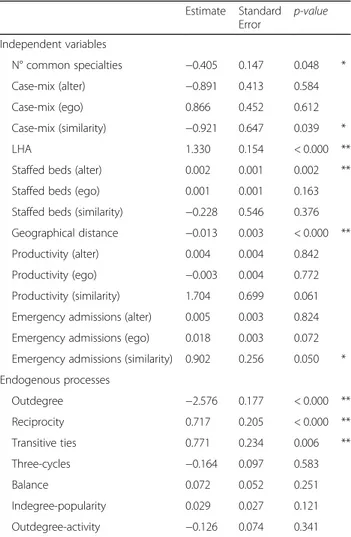
The empirical results of the stochastic actor based model estimations are presented in Table6. The analysis of the endogenous effects suggests that collaborative ties
Table 1 Descriptive statistics of independent variables Variables Changing/ Cons tant 2003 2004 2005 2006 2007 2008 Mean StD Min Max Mean StD Min Max Mean StD Min Max Mean StD Min Max Mean StD Min Max Mean StD Min Max LHA Cons tant 3.00 1.81 1.00 6.00 Staffed beds Chan ging 183.03 164.68 20.00 730.00 167.83 146.70 20.00 661.00 168.17 145.27 20.00 650.00 167.83 146.70 20.00 661.00 167.83 146.70 20.00 661.00 132.97 129.73 20.00 572.00 Case-mix Chan ging 1.03 0.13 0.81 1.40 1.03 0.13 0.81 1.40 1.02 0.12 0.70 1.42 1.03 0.11 0.66 1.29 0.92 0.20 0.00 1.24 0.90 0.12 0.66 1.22 N° commo n spec ialties Cons tant 15 7.32 1 31 Productivity Chan ging 35.65 16.80 5.45 79.40 42.92 23.13 9.21 130.44 50.93 27.10 11.21 136.37 32.49 16.24 5.74 77.16 28.10 14.72 0.00 60.00 38.10 19.78 6.51 103.49 Emergen cy. admissions Chan ging 31.657 25.53 0 71 35.74 24.25 0.00 71.00 37.35 24.54 0 74 34.77 28.07 0 79 34.69 27.44 0 75 31.26 25.55 0 71 Geographi c distance Cons tant 65.69 29.61 0 133
Table 2 Correlations 1 2 3 4 5 6 7 8 9 1 01 1 1 21 3 1 41 51 6 1 71 8 1 9 2 02 1 1 Outdegree – 2 Reciprocity 0.159 3 Transitive ties 0.381 0.375 4 3-Cycles − 0.087 − 0.147 − 0.597 5 Balance − 0.335 − 0.478 − 0.915 0.405 6 Indegree- popularity − 0.690 − 0.208 − 0.743 0.370 0.658 7 Outdegree- activity − 0.495 − 0.546 − 0.855 0.203 0.913 0.649 8 LHA − 0.185 − 0.081 0.297 − 0.205 − 0.286 − 0.112 − 0.210 9 N° common specialties 0.126 0.097 − 0.033 0.017 0.021 − 0.018 0.013 − 0.075 10 Geographical distance − 0.047 − 0.113 − 0.371 0.138 0.359 0.307 0.363 0.305 0.103 11 Staffed beds (alter) 0.003 − 0.166 − 0.048 − 0.079 0.099 − 0.303 0.195 0.086 − 0.218 − 0.008 12 Staffed beds (ego) 0.358 0.346 0.448 0.049 − 0.521 − 0.290 − 0.707 0.159 − 0.164 − 0.204 − 0.112 13 Staffed beds (similarity) − 0.490 − 0.311 − 0.595 0.151 0.587 0.582 0.678 − 0.123 − 0.257 0.241 0.419 − 0.275 14 Case-mix (alter) − 0.018 − 0.130 − 0.181 0.068 0.183 0.152 0.181 − 0.077 0.001 0.097 − 0.098 − 0.055 0.181 15 Case-mix (ego) − 0.079 − 0.018 0.007 − 0.008 0.003 0.020 − 0.009 0.041 0.011 − 0.048 0.127 − 0.042 0.095 − 0.043 16 Case-mix (similarity) 0.147 0.208 0.169 − 0.044 − 0.198 − 0.147 − 0.204 − 0.001 0.105 − 0.026 − 0.060 0.087 − 0.218 − 0.420 − 0.070 17 Emergency adm. (alter) 0.044 − 0.247 − 0.023 − 0.176 0.119 − 0.189 0.156 0.009 − 0.041 − 0.054 0.164 − 0.162 0.063 − 0.141 0.084 − 0.066 18 Emergency adm. (ego) − 0.247 − 0.066 − 0.187 0.150 0.204 0.181 0.096 0.061 − 0.123 − 0.040 − 0.016 − 0.055 0.007 0.086 0.079 − 0.144 0.118 19 Emergency adm. (similarity) − 0.012 0.067 0.244 − 0.210 − 0.333 − 0.101 − 0.225 0.115 − 0.111 − 0.259 − 0.071 0.117 − 0.156 − 0.063 − 0.075 0.022 − 0.235 − 0.271 20 Productivity (alter) 0.033 0.148 0.120 0.028 − 0.182 − 0.132 − 0.182 0.112 0.062 0.047 − 0.248 0.077 − 0.292 − 0.104 − 0.162 0.001 − 0.040 − 0.042 0.031 21 Productivity (ego) 0.057 − 0.081 − 0.067 − 0.064 0.114 0.053 0.109 0.088 0.001 0.177 0.029 − 0.244 0.046 − 0.020 − 0.038 − 0.049 0.072 0.038 − 0.058 − 0.200 22 Productivity (similarity) − 0.096 0.118 0.208 − 0.089 − 0.200 − 0.043 − 0.201 0.095 − 0.010 − 0.078 − 0.170 0.083 − 0.236 − 0.116 − 0.087 − 0.147 − 0.294 − 0.139 − 0.032 0.482 − 0.056
do not evolve randomly but instead follow specific rela-tional patterns. The significant negative effect of outde-gree and the significant positive effect of reciprocity respectively indicate a general tendency of organizations against outgoing collaborative ties and the propensity overtime to reciprocate received collaborative ties. The significance of these two basic measures is crucial in sto-chastic actor-based model for network dynamics as they provide robustness to the entire model [15]. A lack of their significance would imply that the phenomenon ob-ject of investigation (i.e. the propensity to exhibit collab-orative ties) is not statistically relevant. In addition, the
network presents overtime a general tendency toward transitive ties, meaning as collaborative ties tend to be established with partners of direct partners. This is in line with the study results of Madhavan, Gnyawali and He [30] on triads formation in cooperative networks. The remaining endogenous effects are not statistically significant.
The coefficient of N° of common specialties is negative and significant. This implies that there is a negative rela-tionship between the similarity in terms of overlapping specialties and the propensity of organizations to collab-orate. Higher levels of overlapping specialties have a Table 3 Summary of structural configurations
negative impact on networking behavior of hospital or-ganizations, reducing their propensity to exchange col-laborative ties.
The variable case-mix (similarity) is negatively and sig-nificantly correlated with the dependent variable, mean-ing that network ties are more likely to be observed among organizations with different values in this index. Geographical distance is negative and significant. This implies that there is a geographical proximity effect [2], namely that as the distance decreases the propensity of hospital organizations to collaborate increases.
In line with previous studies [22, 27], the results show that input uncertainty matter in explaining how hospital organizations choose their collaborative patterns. The variable Emergency admissions (similarity) is positive and significant, revealing a propensity to transfer pa-tients between hospitals facing similar levels of oper-ational uncertainty.
With reference to the proxy of size, staffed beds (alter) is positive and significant, showing a tendency in the network to choose larger hospitals as partners to which transfer patients [20].
The proxy used to measure whether similarities or dif-ferentials in performance levels (ie productivity) induce the networking behavior of hospitals organizations is not significant. It follows that if on the one hand it is widely recognized in literature that higher levels of collabor-ation produce a positive impact on organizcollabor-ational per-formance [24], on the other hand - at least in this specific case study - the opposite relationship is not true and therefore performance doesn’t matters in explaining partner selection.
Finally, the variable LHA is positive and significant, meaning that collaborative ties are more likely to de-velop between hospital organizations belonging to the same LHA.
Discussion
Understanding the factors that stimulate or hinder net-working behavior of organizations is a matter of signifi-cant theoretical interest and has remained high on the list of priorities of researchers interested in network rela-tions [14]. Using stochastic actor-based model for net-work dynamics [15–17, 29], the purpose of this paper was to model partner selection choice as a combination of individual organizational attributes and endogenous network-based processes. The opportunity was provided by the availability of very rich data and the identification of an ideal empirical context within a regional commu-nity of hospital organizations in Italy.
Table 4 Characteristics of ties evolution
Year Density (%) Number of ties Average degree
2003 11 131 3.743 2004 10.2 121 3.457 2005 11.2 133 3.800 2006 9.5 113 3.229 2007 11.5 137 3.914 2008 12.2 145 4.143
Table 5 Number of changes between subsequent observations
Observation time 0→ 0 0→ 1 1→ 0 1→ 1 Jaccard
2003–2004 1030 29 39 92 0.575
2004–2005 1022 47 35 86 0.512
2005–2006 1029 28 48 85 0.528
2006–2007 1021 56 32 81 0.479
2007–2008 1000 53 45 92 0.484
Columns labeled“0➔1” and “1➔0” indicate the number of forming and dissolving collaborative ties, respectively, from one period to the next. Columns labeled“0➔0” and “1➔1” indicate the number of pairs for which no changes were observed
Table 6 Parameter estimates predicting the dynamics of collaborative interdependences Estimate Standard Error p-value Independent variables N° common specialties −0.405 0.147 0.048 * Case-mix (alter) −0.891 0.413 0.584 Case-mix (ego) 0.866 0.452 0.612 Case-mix (similarity) −0.921 0.647 0.039 * LHA 1.330 0.154 < 0.000 **
Staffed beds (alter) 0.002 0.001 0.002 **
Staffed beds (ego) 0.001 0.001 0.163
Staffed beds (similarity) −0.228 0.546 0.376
Geographical distance −0.013 0.003 < 0.000 **
Productivity (alter) 0.004 0.004 0.842
Productivity (ego) −0.003 0.004 0.772
Productivity (similarity) 1.704 0.699 0.061
Emergency admissions (alter) 0.005 0.003 0.824
Emergency admissions (ego) 0.018 0.003 0.072
Emergency admissions (similarity) 0.902 0.256 0.050 *
Endogenous processes Outdegree −2.576 0.177 < 0.000 ** Reciprocity 0.717 0.205 < 0.000 ** Transitive ties 0.771 0.234 0.006 ** Three-cycles −0.164 0.097 0.583 Balance 0.072 0.052 0.251 Indegree-popularity 0.029 0.027 0.121 Outdegree-activity −0.126 0.074 0.341
*p < 0.05; **p < 0.01. P-values are based on approximately normal distributions oft-ratios (defined as the parameter estimate divided by the standard error)
The networking behavior of hospital organizations was observed through the study of patient flows, since the previous literature has amply demonstrated to us how this represents a valid proxy reflecting collabor-ation and the existence of underlying relcollabor-ationships be-tween the hospitals involved in patient transfers, because of the high levels of coordination and commu-nication that patient transfer requires [1,2,22, 25]. Al-though recently numerous studies have addressed the issue of patient transfer and investigated its determi-nants, this research topic was still uncovered as regards the study of evolutionary dynamics and factors that over time can induce or prevent ties formation among hospital organizations.
This research found that high levels of overlapping specialties reduce the propensity to exchange collabora-tive ties. This seems to suggest that perceiving another hospital organization as similar (in terms of dependence on the same resources, i.e. inputs represented by the pa-tients), in this context seems to increase the competition between similar organizations and consequently inhibits the formation of network ties. Indeed, when two hospi-tals have many overlapping specialties, it implies that they are vey similar, they take care of the same diseases and treat the same type of patients, and thus may per-ceive each other as potential competitors [22]. Also this research found that, over time, network ties are more likely to be observed among hospital organizations that face with different case-mix. This seems to suggest that networking behavior is driven by clinical knowledge stock owned by a given hospital. Hospitals can suffer for the lack of high specialized physicians and nurses skilled to work in the intensive care unit, coronary care unit, stroke unit or operating surgery rooms equipped for transplantation, so they send patients to hospitals which could offer appropriate care related to patients’ patholo-gies [18]. In addition to the case-mix, the analysis also reveals a tendency in the network to choose larger hos-pitals as partners to which transfer patients, probably due to the fact that larger hospitals are more equipped in terms of resources and technologies [1,20].
The results of the empirical analysis show that, over time, collaborative ties are more likely to develop be-tween hospital organizations belonging to the same LHA. This can be interpreted in line with what was found by Veinot et al. [19], i.e. patient transfer is not considered by hospitals only as a solution to contingent one-off problems, rather it happens in a structured and localized social context where hospital organizations tend to routinize destination selection in order to coord-inate their efforts and conserve their cognitive resources for patient care. The significance of the geographical di-mension shows how the search for partners is also guided by proximity. This result, therefore, confirms
what found by Mascia and colleagues [23] and extends the validity of their findings longitudinally to a wider time frame.
The last explanatory variable is operational uncer-tainty, that manifests when internal organizational activ-ities are difficult to plan, or planned activactiv-ities are difficult to execute, and it comes from unpredictable variation in internal operating conditions, which require change in original plans and routines, and the revision of resource allocation decisions. Although it is well known in the literature that health care organizations re-spond to uncertainty by creating ties [22, 27], this study adds that within the network there is a propensity over time to choose as collaborative partner hospitals facing similar levels of operational uncertainty. Future studies will have to clarify the motivations and theoretical mechanisms that explain this criterion in the choice of the partner organization.
Finally, results found that the formation of network ties between organizations is explained by peculiar forms of structural (or local) configurations, composed of sub-sets of two or three network actors and the possible ties among them [30]. These dyadic and triadic micro-processes have been measured statistically to provide evidence on how endogenous local forces drive the for-mation (and evolution) of network ties. Among the dyadic configurations, outdegree (the overall tendency of organizations to exhibit outgoing collaborative ties) and reciprocity (the overall tendency of organizations to exhibit reciprocal ties) are significant and confirm the non-static nature of the network investigated. Among the triadic configurations, only transitive ties (the tendency toward transitive closure, where collab-orative ties are established with partners of partners) are significant in explaining how networks ties evolve over time [22,28].
To reduce the risk of over-interpreting the results, it is useful to reflect on the main limitations of this research, which provide opportunities for future research. First, one specific relation, i.e. patient transfer among hospi-tals, was analyzed. Although inter-hospital collaboration is widely used in the literature [3], it is possible that hos-pitals also collaborate in other ways including exchanges of doctors, cross training of medical staff, and technol-ogy transfer. Future studies should pay attention to the multiplexity that inter-organizational collaboration is likely to involve. Second, our findings are based on data for a six-year period from hospitals in a single region of Italy and may reflect issues specific to the local context or the time period. Further research is encouraged on the dynamics of collaboration, in order to extend the application of longitudinal models for social network analyses to other settings, and to check whether our findings can be generalized.
Conclusions
This study provides new insights by addressing the applica-tion of longitudinal models for social network analysis, which so far have received scant attention in health care. Delivery of hospital services is highly influenced by the for-mation of collaborative networks between providers. Hos-pital managers and policymakers are invited to use network analytic techniques that allow them to be informed about the current collaborative network. Also, through the use of these tools they can obtain novel information and under-stand better the effects of these networks, supporting the formation of structured agreements between hospitals, and allowing to draw proper patient flow at the regional level.
Health care networks are strongly self-organizing and emergent in nature, independent from (or even negatively influenced by) management and policymakers’ interven-tions (absence of interveninterven-tions). It is therefore recom-mended to the latters of carefully define organizational characteristics (such as number of specialties, case-mix, size), institutional factors (LHAs) and geographical prox-imity as they count in determining the formation and shaping over time of hospital networks.
Abbreviations
I-NHS:Italian National Health Service; LHA: Local health authority Acknowledgements
The author is grateful to Francesca Masciarelli and Daniele Mascia for their comments and feedback on an earlier version of the manuscript, and to Valentina Evangelista for her support collecting data and providing empirical analysis. Precious support for data gathering has been provided also by the Abruzzo Agency of Public Health. A previous version was presented at the 2016 Academy of Management Annual Meeting, Anaheim (California), USA, Health Care Management Division, taking advantage from the suggestions provided by the audience.
Availability of data and materials
The dataset used and/or analyzed during the current study is available from the author on reasonable request.
Authors’ contributions
The sole author was responsible for all aspects of the study and manuscript. Ethics approval and consent to participate
No ethical approval was necessary for this study since no experimental research was performed and patient information consisted of secondary data routinely collected and released by a regional agency of public health. Competing interests
The author declares that he has no competing interests.
Publisher’s Note
Springer Nature remains neutral with regard to jurisdictional claims in published maps and institutional affiliations.
Received: 23 January 2018 Accepted: 24 April 2018
References
1. Iwashyna TJ, Christie JD, Moody J, Kahn JM, Asch DA. The structure of critical care transfer networks. Med Care. 2009;47:787–93.
2. Lee BY, McGlone SM, Song Y, Avery TR, Eubank S, Chang CC, Bayler RR, Wagener DK, Burke DS, Plat R, Huang SS. Social network analysis of patient
sharing among hospitals in Orange County, California. Am J Public Health. 2011;101:707–13.
3. Mascia D, Di Vincenzo F, Cicchetti A. Dynamic analysis of interhospital collaboration and competition: empirical evidence from an Italian regional health system. Health Policy. 2012;105:273–81.
4. Lomi A, Mascia D, Vu D, Pallotti F, Conaldi G, Iwashina TJ. Quality of care and interhospital collaboration: a study of patient transfer in Italy. Med Care. 2014;52:407–14.
5. Stadtfeld C, Mascia D, Pallotti F, Lomi A. Assimilation and differentiation: a multilevel perspective on organizational ancd network change. Soc Networks. 2016;44:363–74.
6. Cohen WM, Levinthal DA. Absorptive capacity: a new perspective on learning and innovation. Adm Sci Q. 1990;2:128–52.
7. Gulati R, Gargiulo M. Where do interorganizational networks come from? Am J Sociol. 1999;104:1439–93.
8. Powell WW, White DR, Koput KW, Owen-Smith J. Network dynamics and field evolution: the growth of interorganizational collaboration in the life sciences. Am J Sociol. 2005;110:1132–205.
9. Mascia D, Di Vincenzo F. Understanding hospital performance: the role of network ties and pattern of competition. Health Care Manag Rev. 2011;36: 327–37.
10. Scott WR, Meyer JW. The organization of societal sectors. In: Meyer JW, Scott WR, editors. Organizational environments: rituals and rationality. Newbury Park: Sage; 1983.
11. Jensen M, Roy A. Staging exchange partner choices: when do status and reputation matter? Acad Manag J. 2008;51:495–516.
12. Soda G, Usai A, Zaheer A. Network memory: the influence of past and current networks on performance. Acad Manag J. 2004;47:893–906. 13. Kilduff M, Tsai W. Social networks and organizations. London: Sage; 2003. 14. Ahuja G, Soda G, Zaheer A. The genesis and dynamics of organizational
networks. Organ Sci. 2012;23:434–48.
15. Snijders TAB, van de Bunt G, Steglich C. Introduction to stochastic actor-based models for network dynamics. Soc Networks. 2010;32:44–60. 16. Valente TW, Fujimoto K, Palmer P, Tanjasiri SP. A network assessment of
community-based participatory research: linking communities and universities to reduce cancer disparities. Am J Public Health. 2010;100:1319–25. 17. Giuliani E. Network dynamics in regional clusters: evidence from Chile. Res
Policy. 2010;42:1406–19.
18. Cohen MD, Hilligoss B, Amaral ACK. A handoff is not a telegram: an understanding of the patient is co-constructed. Crit Care. 2012;16:303–17. 19. Veinot TC, Bosk EA, Unnikrishnan KP, Iwashyna TJ. Revenue, relationships
and routines: the social organization of acute myocardial infarction patient transfers in the United States. Soc Sci Med. 2012;75:1800–10.
20. Iwashyna TJ, Christie JD, Kahn JM, Asch DA. Uncharted paths: hospital networks in critical care. Chest. 2009;135:827–33.
21. Dudley RA, Johansen KL, Brand R, Rennie DJ, Milstein A. Selective referral to high-volume hospitals. J Am Med Assoc. 2000;283:1159–66.
22. Lomi A, Pallotti F. Relational collaboration among spatial multipoint competitors. Soc Networks. 2012;34:101–11.
23. Mascia D, Pallotti F, Angeli F. Don’t stand so close to me: competitive pressures, proximity and inter-organizational collaboration. Reg Stud. 2016; 51:1348–61.
24. Mascia D, Di Vincenzo F. Understanding hospital performance: the role of network ties and patterns of competition. Health Care Manag Rev. 2011;36: 327–37.
25. Mascia D, Angeli F, Di Vincenzo F. Effect of hospital referral networks on patient readmissions. Soc Sci Med. 2015;132:113–21.
26. Lo Scalzo A, Donatini A, Orzella L, Cicchetti A, Profili S, Maresso A. Health care system in transition Italy: health system review. Health Syst Transit. 2009;11:1–216.
27. Gittel JH. Relationships between service providers and their impact on customers. J Serv Res. 2002;4:299–311.
28. Pallotti F, Lomi A, Mascia D. From network ties to network structures: exponential random graph models of interorganizational relations. Qual Quantity. 2011;47:1665–85.
29. Ripley RM, Snijders TAB, Boda Z, Vörös A, Preciado P. Manual for SIENA version 4.0. Oxford: University Press; 2017.
30. Madhavan R, Gnyawali DR, He J. Two's company, three’s a crowd? Triads in cooperative-competitive networks. Acad Manag J. 2004;47:918–27.