ACTA IMEKO
ISSN: 2221‐870XSeptember 2016, Volume 5, Number 2, 55‐63
3D survey technologies: investigations on accuracy and
usability in archaeology. The case study of the new
“Municipio” underground station in Naples
Luigi Fregonese
1, Francesco Fassi
1, Cristiana Achille
1, Andrea Adami
1, Sebastiano Ackermann
1, Alessia
Nobile
1, Daniela Giampaola
2, Vittoria Carsana
31 Polytechnic of Milan, Department ABC, Hesutech laboratory, Campus Mantova, Piazza D’Arco 3 ‐ 46100 – Mantova, Italy 2 Superintendence Archaeology Campania, Piazza Museo Nazionale, 19 ‐ 80135 ‐ Naples, Italy 3 Assistant of the Superintendence Archaeology Campania, Via del Marzano, 6 – 80123 – Naples, Italy Section: RESEARCH PAPER Keywords: Close Range Photogrammetry; laser scanner; instruments; accuracy; calibration; 3D‐Model; archaeology Citation: Luigi Fregonese, Francesco Fassi, Cristiana Achille, Andrea Adami, Sebastiano Ackermann, Alessia Nobile, Daniela Giampaola, Vittoria Carsana, 3D survey technologies: investigations on accuracy and usability in archaeology. The case study of the new “Municipio” underground station in Naples, Acta IMEKO, vol. 5, no. 2, article 8, September 2016, identifier: IMEKO‐ACTA‐05 (2016)‐02‐08 Section Editor: Sabrina Grassini, Politecnico di Torino, Italy; Alfonso Santoriello, Università di Salerno, Italy Received March 24, 2016; In final form July 22, 2016; Published September 2016 Copyright: © 2016 IMEKO. This is an open‐access article distributed under the terms of the Creative Commons Attribution 3.0 License, which permits unrestricted use, distribution, and reproduction in any medium, provided the original author and source are credited Corresponding author: Luigi Fregonese, e‐mail: [email protected] 1. INTRODUCTION
Nowadays, three-dimensional models of objects from images are a standard in a wide range of applications from autonomous robotics to industrial vision and consumer digital entertainment. In addition, it has been a topic of intensive research since the early days of computer vision and in the field of Cultural Heritage [1], but it has eluded a general solution regarding the accuracy in photogrammetric systems.
Image Based Modelling (IBM) is based on multiple 2D image measurements to recover 3D object information through a mathematical model. This method calculates 3D
measurements from multiple views with the use of projective geometry and a perspective camera model. In addition, it guarantees a good portability and implies often low cost sensors [2].
However, the surveying results must meet specific criteria in order to provide the required accuracy for certain applications. For that reason, any geometric surveying task, such as the photogrammetric one, includes not only the definition of the relative positions of points and objects but also the estimation of the accuracy of the results [3].
With the least squares adjustment method, based on finding an approximate solution to overdetermined systems, it is
ABSTRACT
Advanced 3D survey technologies, such as Digital Photogrammetry (imaged based) and Laser Scanner, are nowadays widely used in Cultural Heritage and Archaeological fields. The present paper describes the investigations realized by the Laboratory Hesutech of the Polytechnic of Milan in cooperation with the Superintendence Archaeology Campania in order to examine the potentiality of Image Based Modeling (IBM) systems applied to the archaeological field for advanced documentation purposes. Besides the 3D model production workflow in an uncommon excavation environment, a special consideration about the reached accuracy will be discussed. In the first part of the research, a comparison between photogrammetric camera parameters obtained with IBM systems and the ones provided with the calibration certificate by the manufacturer of the camera is performed. In the second part of the research, the operational phases of the application of such advanced 3D survey technologies are shown. The test field is the archaeological excavation area for the construction of the new “Municipio” underground station in Naples. Due to its position in one of the historical area of the city, its construction coexists with the archaeological excavations and it is strictly tied to their evolution. In such conditions, the need to reduce as much as possible the time to build the public infrastructure is a very relevant feature together with the ability to produce accurate documentation of what is considered archaeologically important.
possible to obtain reliable information concerning the accuracy of the results as well as the accuracy of the observations.
The building of the new “Municipio” underground station in Naples has required extended as well as intensive archaeological investigations on almost the entire area of the construction yard. The importance of the findings and the evidences together with the need to speed up the completion of the infrastructure, required to introduce advanced 3D survey technologies to satisfy both the requirements. However, the high amount of almost every day photogrammetric surveys as well as restitutions, has not allowed to follow a rigorous workflow regarding the calibration procedure (e.g. with dedicated calibration test fields). Anyhow, a self-calibration has been always performed by using the same images acquired during the survey tasks, obtaining residuals on GCPs of few millimetres or 1 to 1.5 cm in the worst cases. In the following Section, a comparison between a self-calibration obtained in such way and the one certified by the manufacturer will be descripted and discussed. In the second part, a few numbers of the IBM system applications on different size and complexity objects will be shown.
2. ACCURACY WITH IBM METHOD
2.1. Method for the determination of the accuracy with IBM
Nowadays, high-resolution cameras allow to acquire excellent quality images in terms of resolution and sharpness and can be used to perform precision surveys. The best way to evaluate the efficiency and the quality of this instrument as well as the whole process is to focus on camera calibration, the common issue in photogrammetric applications, especially when the precision for dimensional measurements is a not negligible variable.
In order to perform this calibration, the process follows a three steps approach:
1. Image acquisition;
2. Image alignment with the software Photoscan®, to define position of images and camera parameters (internal orientation and lens distortions);
3. Comparison of the calculated values with those reported in the metric calibration certificate.
Compared to the other aberrations, lens distortion is the one that mainly affects photogrammetric measurements in terms of accuracy, and the images must be corrected in photogrammetry. Lens distortions are of several kinds, but the radial one is the most significant. It is the radial displacement of a projected image point on the sensor from its theoretically true position or, equivalently, a change in the angle between a ray and the optical axis.
In order to define the distortions, the parameters of the internal orientation of a camera are calculated by means of the self-calibration, in which the distortion and camera parameters are included as part of the bundle adjustment solution.
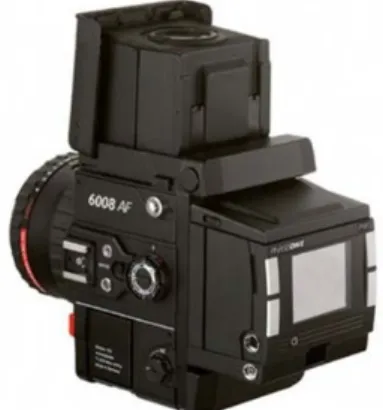
The digital camera used in this test is the Rollei 6008 (Figure 1) with fixed digital 72405433 pixel (49.23236.9444 mm) resolution back sensor (Phase One) and with a 40 mm optical lens. This camera has the following features:
it can save Loss-free or RAW-format images, up to 48 bit colour depth, 32 MB per image;
interchangeable metric lenses PQ (fastest shutter speed: 1/500 s) between 40 mm and 350 mm, interchangeable metric lenses PQS (fastest shutter speed: 1/500 s)
between 50 mm and 500 mm;
metric calibration certificate for each lens; pixel size 6.8 μm.
The calibration certificate provided by the manufacturer includes the following parameters:
Ck: 41.195 mm;
Xh: 0.161 mm and Yh: +0.460 mm;
A1: 3.6010-5 and A2: 2.4410-8 as parameter for the
radial distortion; R0: 0.0 mm; R: [0, 31] mm.
The curve of distortion is defined by Rollei with the following equation:
∆ ∙ ∙ ∙ ∙ . (1)
The radial distortion curve reported in Figure 2 shows a
Figure 1. Rollei 6008AF with Phaseone P45.
radial distortion of 374 μm (55 pixels) at 31 mm of radial distance.
2.2. Test for accuracy investigation
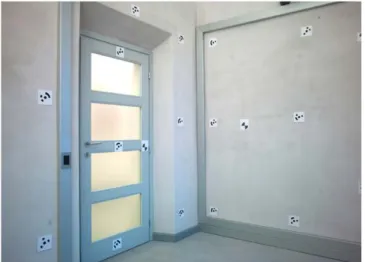
In order to evaluate the overall accuracy of the IBM system (in particular Photoscan) a calibration test was realized in a closed environment set-up in a square room of about 4 meters of length, with a cross vault on the top (Figure 3).
In this room, a total amount of 108 coded targets (85 coded for PhotoScan and 23 for Leica HDS Cyclone) were displaced all around and measured with a Leica Total Station TS30.
In the first data processing, all acquired targets have been used for camera calibration through the steps of image alignment and subsequently of optimization. In such a way the software Photoscan calculated the inner orientation, with the results reported in Table 1.
These results are congruent with the data provided in the original calibration certificate of the camera and the distortion, as reported on also from the distortion curves of Figure 4.
As concerning the accuracy of alignment of the photogrammetric model, the process has calculated its solution at high quality and it discovered about 120.000 points (Figure 5) with the quality values expressed in Table 2.
The above described accuracy values clarify that the precision of the photogrammetric model (with an order of 0.5
pixel) well fits the standard deviations obtained for each direction X, Y, Z.
To have a more significant comparison, about 2/3 of all GCP were used as check points (CPs) to verify the quality of the alignment of the total model: the results of such test are summarized in Table 3. Figure 5. GCP and Tie Points determined in alignment and calibration phase of the model of investigation. Table 1. Camera Parameters calculated with Photoscan software: exported in Australis format. Camera Parameters Value Camera Rollei 6008 P45 H sensor 7240pixel V sensor 5433pixel Pixel size 6.8µm C 41.150mm Xp ‐0.2549mm Yp 0.3618mm K1 ‐3.9628710‐5 K2 3.0461610‐8 K3 ‐4.7477510‐12 P1 3.5966310‐6 P2 1.6384410‐6
Figure 4. Comparison Lens radial symmetric distortion in μm (above) and pixel (below).
Figure 3. The Polygon test in which coded target for Photoscan and HDS Laser Scanning were positioned.
As evident from the comparison, the IBM approach, based on photogrammetry and topography, is correct and we can use it also in the documentation of Cultural Heritage. Indeed, the network geometry adopted for the images acquisition in this work is the same as the one adopted during the surveys of architectural and archaeological artifacts; in addition, the order dimension of the acquired objects, for cases of close range survey, are similar. The IBM method is efficient not just for the acquisition stage (in terms of instrumental costs and timing for data acquisition), but also in terms of achievable accuracy.
2.3. Test on surface accuracy
The last part of the test concerns the comparison between the point cloud extracted with photogrammetric approach and a second one obtained by employing the laser scanner Leica HDS 7000 [4].
The laser scan was made by positioning the scanner in the centre of the room and it was registered in the same reference system used for the photogrammetric model by aligning it through the 23 black/white HDS targets.
The results of the registration, made with Leica Cyclone, are shown in Table 4.
The evaluation of surface accuracy has been made with the software CloudCompare which allows to measure the Euclidean distance between two pointclouds. In Figure 6, it is clear that the distances between photogrammetric and laser
scanner pointcloud are included in the interval 0.0006<x<0.0048 mm.
These tests confirmed that the photogrammetric approach, IBM, is a reliable survey methodology as it guarantees the same accuracy of other well-established methods such as laser scanner. This method validation allowed us to use both methods, IBM and lasers scanner, and to choose the most suitable one time by time considering also some other aspects such as the possibility to acquire texture, the acquisition time, the operational conditions, etc.
The following Sections contain a few examples of applications of these survey methods in real, and complex, contexts.
3. CASE STUDY: THE NEW UNDERGROUND STATION “MUNICIPIO” IN NAPLES
The construction of the new underground station “Municipio” in Naples, interchange point between two underground lines and the touristic harbour, has produced time expensive archaeological investigations within the construction areas. These investigations were arranged with the Italian Cultural and Activities Heritage Ministry, the Municipality of Naples and “Metropolitana di Napoli S.p.A.”, concessionaire for the construction of the underground, and represent a precocious example of “planned archaeology” applied to an important public infrastructure: indeed, they have been started a few years before the introduction of the “Rescue Archaeology” law, issued in 2006. Table 2. Residuals on GCPs. Parameters Value No. Images 73 Tie points 117.081 GCP Points 108 RMS (mm) 0.9 RMS (pixel) 0.542 σx (mm) ±0.61 σy (mm) ±0.65 σz (mm) ±0.57 Figure 6. Euclidean distances between laser scanner and photogrammetric point clouds. Table 3. Estimated accuracy of georeferencing images considering both sets of points GCPs and CPs. Parameters Configuration with GCPs only Configuration with GCPs and CPs No. Images 73 73 GCPs 108 37 CPs 0 71 RMS (mm) 0.99 0.89 σx (mm) ±0.63 ±0.61 σy (mm) ±0.68 ±0.65 σz (mm) ±0.72 ±0.49 Table 4. Registration Laser Scanner data. Parameters Value No. Target 23 RMS (mm) 1.2 σx (mm) ±0.95 σy (mm) ±0.82 σz (mm) ±1.02
By following the principles of the “urban archaeology”, the investigations have allowed to explore all the human settlements originated within the area, from the most ancient to the modern ones, denoting an unexampled fact-finding model applied to a critical area of the historical centre of Naples, an area that couldn’t be differently investigated due to the complexity of the urban situation, the depth of the evidences and the contextual presence of a phreatic layer. In this second part of the research, survey methodologies verified in the previous part are applied on the below described evidences and adapted to the specific cases will be presented.
3.1. The archaeological evidences
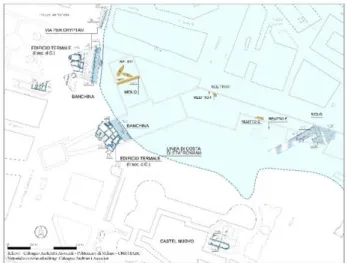
The old costal landscape shape in front of the historical Neapolitan settlement has been reconstructed thanks to the archaeological investigations. However, the area delimited by the actual Via Medina, Via Depretis, Piazza Municipio and Castel Nuovo was deeply different by the one known as-is today, outcome of secular natural and anthropic transformations (Figure 7).
At the beginning, it was the south-west zone of a wide inlet delimited, from south-west to north-east respectively, by the promontory where now Castel Nuovo is located and by the elevation where now the S.Maria di Porto Salvo church is located.
From the end of the 4th century B.C. to the 5th century A.D., the above described area matched with the port basin of Neapolis and with the neighbouring seaboard as well [5]. The laying out of the harbour has dated back to the end of the 4th century/beginning of the 3rd century B.C., thanks to the founding of tracks related to an extended dredging operation
(about 3750 m2) on the deepest sea bottoms levels, operations
that modified the original shape of the inlet. In the same epoch, the above slope was regularized by rising up walls for terracing purposes made with panelled masonry or tuff blocks technique, probably for the protection of the basin. A ramp made with tuff blocks was also built, maybe for mooring purposes.
During the Augustan age, the area was differently reorganized, and important harbour and street infrastructures were set up. Next to the inside edge of the inlet, a quay made with concrete, superimposed over tuff blocks lines and delimited by a reticulated work type wall, was built, and the natural tuff bank was also worked. The presence of an erosional line characterized by the presence of malacofauna (barnacles
and oysters) proves that the sea level during the roman imperial age was about 1.70 to 1.80 m below the actual sea level. In the south-east area of the inlet, a much more complex harbour infrastructure, still under investigation, has been recently discovered: it is composed of concrete structures, built by using a wooden formwork, that probably were used as docks or breakwaters to protect the entrance of the port basin. The regularized coastline area was employed to build a thermal structure (1st and 2nd century A.D) along a route, probably the via per cryptam from Neapolis to the Phlegraean Fields.
Among other things, the stratigraphic sequence of overlapping sea bottoms that included a high number of ceramic and organic evidences (such as waste, ship equipment or lost objects), was also excavated. During these investigations, six shipwrecks were found: poor rests of two shipwrecks dated 2nd century B.C. (named “Napoli E” and “Napoli H”), two ships dated 1st century A.D. ( “Napoli A” and “Napoli C”), and other three boats, maybe sunk due to a storm at the end of the 2nd century A.D. (“Napoli B”, “Napoli F”, “Naples G”). All the boats were built according to the shell-first method, with the planks fitted edge to edge and fastened by mortise-and-tenon joints technique [6]. Shipwrecks A, B and F were sail-boat types used for commercial purposes, whereas the C and G ones had a flat vertical stern, belonging to the horeiae class, probably pushed by using both sail and oars with multi-purposes employment, details known just from iconographic sources (a mosaic found in Althuburus, Tunisia) [7]. While the A and C boats were entirely removed by constructing a fiberglass case around them, the F, G and H boats, found in 2015, due to their worse condition, have been accurately disassembled and each component has been stored within water tanks to preserve them. The disassembling process has been set up and executed with the cooperation of the ISCR (National Institute for Conservation and Restoration) and the naval archaeologists G.Boetto (CNRS – Center Camille Jullian) and C.Zazzaro (University of Naples “L’Orientale”).
The archaeological excavations revealed a mutation of the inlet morphology at the beginning of the 5th century A.D.: the coast line moved toward east and so the port basin. In addition, the previously built construction was abandoned or reorganized to be used in different manner.
The urban history of the area completely changed from the construction of Castel Nuovo in the 1279 up to the last square realized in the second half of the 19th century.
3.2. Survey method for the archaeology
One of the issues that affects the Cultural Heritage field is the need to storage a huge number of evidences found during archaeological excavations. Most of them are usually preserved in storehouses: the employment of before mentioned digital technologies allows to obtain accurate three dimensional models and to share them through the web network, strongly changing the way to benefit from such ancient treasures. In addition to the possibility to carry out metric and semantic information of an object without physically measuring the real evidence, such technologies are almost a mandatory step especially to document those artefacts that could not be preserved, as in the case of the construction of a public infrastructure.
An exclusive use of a traditional two-dimensional drawing approach would bring to a loss of important information [8], metrical as well as semantic, and to a lack of precision. In addition, the total absence of texture information of the
measured object could make this approach difficult to read if not supported by photographs. Because of the three-dimensionality of architectonic and archaeological structures, and also of the importance to the appearance quality of the surveyed objects besides the geometrical precision, the best way to represent them is to reproduce them by keeping all the three dimensions and texture information, in order to have a virtual representation extremely similar to the real object.
Since 2012, the concessionaire for the underground construction, together with the “Superintendence Archaeology Campania”, has set up a cooperation with the “3D Survey Group” of the “Polytechnic of Milan”.
The main issue that came out in this excavation site was the need to work in a complex environment, with working machinery close to the areas to be surveyed, logistical difficulties, and the necessity to save as much time as possible to avoid construction slowdown. These working conditions has led to further adapt the modus operandi in particular for the acquisition step, but also to better test the adopted survey techniques in a stressing situation. Beyond that, the systematic usage of Digital Photogrammetry and Laser Scanner (not just for isolated cases) has met the need to produce adequate and detailed documentation of the found evidences within a huge construction area like the one in Piazza Municipio. The 3D models obtained from each survey session performed in different moments and positions can be successively combined together in order to have a global vision of the found evidences, making possible also the stratigraphic sequence understanding and to reconstruct the ancient scenery and its transformation from the Hellenistic era up to the 19th century. The adopting of such new techniques sensibly reduced the acquisition time (and as a consequence improved the efficiency of the excavation process) but guaranteed the accuracy of all acquired data.
The strong cooperation between surveyors and archaeologists required to tune up a process schedule among the survey step and the preliminary restitution of the related orthophoto, that permit a practical verification by the archaeologist before let the excavations go on. In a second moment, without the need to halt anymore the excavations, phase drawings, architectonic and stratigraphic sections are carried out in cooperation with the “Calcagno Architetti Associati” company.
3.3. The new underground station
The documentation to produce within the “Municipio” construction yard with 3D survey technologies is basically composed by orthophotos and 3D point cloud models [9], [10]. During the last three years, several tests with both survey techniques have been conducted on an elevated number of evidences that differ in terms of type and dimension, reaching the best approach to use depending on the case.
At the beginning, digital photogrammetry has been mainly used to generate orthophotos while laser scanner to obtain 3D point clouds. However, the improvements of the actual photogrammetric software and the test validation we exposed, allow now to obtain accurate dense point clouds in an almost fully-automatic way. The obtained results that will follow encourages the use of this image-based technique to extract also 3D point clouds, reserving the use of the laser scanner for particular cases and even lower much more the acquisition time as well as the halt of the excavations. A series of surveys related to particular and different type of evidences and stratigraphy will be presented and discussed. In some case, specific
additional solution were adopted to perform the survey and to achieve the requested results in term of precision and resolution [11].
A. Dredging tracks
One of the most interesting and particular discoveries has been the finding of the rests of dredging operations on the tuff rock stratum. Because these tracks have been found about 7 meters below the actual sea level, it is supposed they were probably realized by employing a dredge mounted on a boat or on a buoyant platform [5].
These tracks have been localized in different but neighbouring excavation areas of the construction yard, and they have been excavated in different moments as well. Due to these reasons, it was not possible to have a complete physical global view of the tracks all together.
The proposed technologies have been employed in the most part of the area in which the dredging tracks have been found. Except for the dredging found in 2004 during the line 1 station shaft excavations, for which less updated survey methodologies were employed, all the remaining areas in which they have been
discovered, have been surveyed with actual technologies.
The dredging tracks discovered in the line 6 station shaft have been surveyed in 2014. Due to the fact that they were partially found below a reinforced concrete slab, built during the archaeological excavations two years before, the natural light condition was poor, and the laser scanner was preventively preferred to carry out the 3D model. The complexity of the site, due to the irregularity of the elevation profile of the area, and the requested high resolution of the model, required an elevated number of scans and an intensive post-processing work as well.
Thanks to the high quality of the surveys’ results in terms of level of detail and degree of realism, and to the potentiality allowable by such digital technologies, the archaeologists have now the possibility to observe the site overall on a computer, from almost infinite points of view, to better recognize the directions of the dredging tracks in order to identify the ones belonging to a single dredge passage and also a valid support to study the possible shapes of the tool used to dredge the sea bottom (Figure 8).
In addition, as the surveys have been topographically georeferenced in a global reference system, the combining of all the surveys performed - or to be performed - in the neighbouring areas, and the possibility to see all the 3D digital models together, will permit to have an overall view of the whole excavated area. Last, all the a posteriori analysis intended to extract in detail measurement information can be performed directly on the 3D model and without a specific urgency, allowing the contractors the prosecution of the station construction and optimizing the infrastructure construction
time as well.
B. Sea bottoms stratigraphy
The use of advanced survey technologies to document the stratigraphy sequence of the sea bottoms (Figure 9) entailed to plan a process schedule in which a strict interaction between surveyors and archaeologists has been necessary.
A new concept of “measurable” stratum in three-dimensions has been adopted, bringing to an important improvement if compared to the traditional survey techniques, mainly based on 2D maps and sparse 3D measured points.
The “digital assembling” of all the surveyed stratums together made possible to reconstruct the entire sequence of sediments settled or removed over the centuries, metrically and semantically as well, deleting any possible individual interpretation [12].
Within this archaeological area of the line 6 station shaft, a total amount of 16 different sea bottom stratums were
surveyed: approximatively, a volume of about 5000 m3 was
removed by following the rules of the archaeologic investigations, obtaining a height difference between the first and the last stratum surveyed of about 3.60 m (Figure 9 and 10).
C. Thermal Structure
When a complex ruin has to be excavated, especially if it is characterized by great extensions and big dimensions, or in case of lack of important structure elements, the understanding of the whole structure utility could appear arduous. An orthographic vertical view as well as a 3D model of the area can give a valid help to understand its shape otherwise not always comprehensible just looking at it on the excavation site (Figure 11).
The survey of the Roman thermal structure found in the line
6 station shaft appeared as an extreme difficult task due to the complexity of the site and to the restricted working spaces. Beyond the survey of each single walls’ façades of the structure, a global survey of the entire area, by using a bird’s eye view, was necessary.
Due to the presence of several obstructions that made impossible the employment of auxiliary flying units such as hanging baskets or UAVs, a flexible and cheap solution has been designed and manufactured. In order to take vertical photos, the camera was mounted on a horizontally movable aluminium frame controlled in one direction by a sort of “clothesline” and in a second direction by a movable roof previously positioned on two rails to preserve the ruins during the excavation progress [8].
This stratagem, besides its cheapness, turned up to be a good resource to overcome the above described difficulties. Thanks to this solution, a true orthophoto (Figure 11) of the entire visible parts of the structure was obtained, allowing to have a real perception of the building composition.
The 3D model of the same structure instead (Figure 12), obtained by employing a laser scanner, allowed to have a good starting point for the prosecution of the excavation activities: indeed, a particularity of this structure is the fact that walls previously used for different purposes in Hellenistic epoch were reused to build it in Roman epoch.
The surveys performed successively, during the prosecution of the excavations and contextually to the disassembling of the thermal structures, permitted to document the more ancient walls, allowing to digitally reconstruct older situations like a backwards travel through the time.
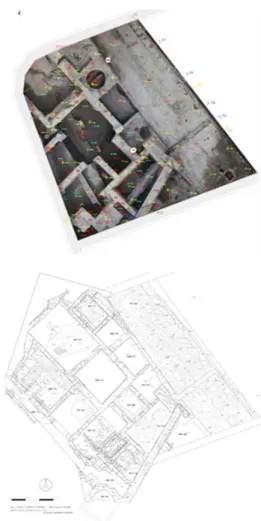
Figure 11. Thermal structure and quay true orthophoto and vector map.
Figure 9. Perspective view of a 3D model of line 6 station shaft excavation site where the first and last surveyed sea bottoms have been highlighted.
Figure 10. Stratigraphic section carried out from the combined 3D models of all the surveyed sea bottoms.
In addition, the possibility to assemble and view together 3D models related to surveys performed in different excavation moments, even in different years, is an exhaustive tool to understand the original uses of the artefacts and the relationship among the structure of different epochs.
The accurate documentation of the much important artefacts produced during the excavation progress allowed to carry out graphic two-dimensional representation as well, such as maps, sections and perspective drawings with wall orthophotos façades (Figure 13).
In addition, stratigraphic sections and 3D multi temporal views have been produced in order to show in a clear manner the relationship between different epochs structures (Figure 14).
D. Shipwreck “Napoli G”
At the end of 2014, the partial bottom of a shipwreck, including edge-joined hull planks and transversal frames, was found (Figure 15).
Due to the particularity of the archaeological evidence and for the location of the finding, there was the necessity to pay serious attention to its excavation and to find a quick solution to provide exhaustive documentation of the evidence and disassemble the shipwreck in as less time as possible. This special case required a strictly cooperation between surveyors and archaeologists, as the start and the prosecution of the disassembling process depended by the preventive and quickly production of maps with orthophotos in specific moments, useful to the archaeologist to take note of each single disassembled part. For these reasons, high resolution orthophotos and accurate 3D models were requested.
The high number of corners for the presence of several frames located in their original positon above the bottom of the boat, brought to choose the photogrammetry as the best survey solution in terms of quality of the final model and time-consuming. Indeed, with a range-based instrument like the laser scanner, a huge number of scans to avoid “holes” on the model would have been requested, with a consequent overabundance of unnecessary data, an intensive and time expensive editing activity and several junction zones between the scans to deal with. As additional negative surrounding condition, the boat was found partially cut by the bulkheads built before the beginning of the archaeological excavation activities. The presence of the bulkheads themselves too close to the boat on one side would have made impossible the acquisition with a laser scanner, while the flexibility of the photogrammetry made it possible even if with some difficulty. In order to keep a good range of DOF (Depth Of Field) and a suitable degree of sharpness in a low light condition, photos were taken with an elevated f-number and with the camera set on a tripod. Normal/nadiral photos were taken together with a set of tilted photos to well reconstruct each particular of the hull and to improve the quality of the camera network. A mobile platform on which to place the camera was also prepared to move the camera itself above the shipwreck.
For this evidence, four distinct surveys, which information is summarized in Table 5, were performed during the disassembling phases, in order to record as much construction details as possible.
Other than being a satisfying documentation, an accurate 3D reconstruction of such archaeological found can be a useful tool for historians of ancient naval architecture to better
Figure 12. Perspective view of the 3D model of the roman thermal complex and of the quay.
Figure 13. Architectonic section of the thermal structure together with the front of the quay.
Figure 14. 3D multi temporal view: Roman structures in grayscale,
understand the typology of the vessel, the employed construction techniques or to have important elements to reconstruct a complete virtual or real model of the vessel reducing reconstruction hypothesis. Even a remounting of the shipwreck in a museum, as it was found, could be taken into consideration as each part was mapped in detail before being removed.
4. CONCLUSIONS
The results of investigations about the accuracy allow to switch between photogrammetry and laser scanner as very really efficient method to document Cultural Heritage. The above described cases are just a selected group of the most exhaustive and interesting evidences found during the excavations activities to which advanced survey technologies have been applied. Even if these cases could appear as a small part of the enormous and continuous survey activity started in 2012 and still under way, they fully give an idea of the potentiality of such methodologies. The thermal structure in particular is a significant example of the possibility to virtually reconstruct the several historical stages that came in succession from Hellenistic epoch on.
Beyond the achievable information that can be extracted from detailed 3D models, the above shown results demonstrate the capability of such technologies to deal with continuous excavation activities that take places simultaneously in different areas of the construction yard and to perfectly satisfy the requirements of all the involved subjects.
Within the last three years, the improvements introduced in the actual data processing photogrammetric software (parallel computing, automatic point cloud generation, etc.) brought to reorganize the two employed methodologies. According to the results of the first part of this paper, much more space has been reserved to the photogrammetric approach in the last months, sensibly reducing the acquisition time in the perspective of still optimize the work. Accurate 3D models in a limited time, depending on the complexity of the object, can now be
obtained with the photogrammetry in a fast manner. In addition, this technique demonstrated its capability to be employed even in case of outstanding conditions, thanks to its flexibility.
REFERENCES
[1] L. Quan, Image-Based Modeling, Springer, New York, ISBN 978-1-4419-6678-0.
[2] F. Remondino, S. El-Hakim, Image-based 3D modelling: A review. The Photogrammetric Record 2006, 2, pp. 269–291.
[3] W. Boehler, V. Bordas, A. Marbs, “Investigating laser scanner Accuracy”, Proc. of XIXth CIPA Symposium, 30 September–4 October, 2003, Antalya, Turkey, pp. 696-702.
[4] C. Achille, A. Adami, S. Chiarini, S. Cremonesi, F. Fassi, L. Fregonese, L. Taffurelli, UAV-Based Photogrammetry and Integrated Technologies for Architectural Applications - Methodological Strategies for the After-Quake Survey of Vertical Structures in Mantua (Italy). Sensors 2015, 15, 15520-15539, ISSN 1424-8220, doi:10.3390/s150715520.
[5] V. Carsana, S. Febbraro, D. Giampaola, C. Guastaferro, G. Irollo, M.R. Ruello, “Evoluzione del paesaggio costiero tra Parthenope e Neapolis”, in “People/environment relationships from the Mesolithic to the Middle Ages, recent geo-Archaeological findings in Southern Italy”, Méditerranée, No.112, 2009, pp. 14-22.
[6] E. Allevato, E. Russo Ermolli, G. Boetto, G. Di Pasquale, “Pollen-wood analysis at the Neapolis harbour site (1st -3rd century AD, southern Italy) and its archaeobotanical implications”, Journal of Archaeological Science, Vol. 37, 2010, pp. 2365-2375.
[7] D. Giampaola, V. Carsana, G. Boetto, F. Crema, C. Florio, D. Panza, B. Pizzo, C. Capretti, G. Galotta, G. Giachi, N. Macchioni, M.P. Nugari, M. Bartolini. “La scoperta del porto di “Neapolis”: dalla ricostruzione topografica allo scavo e al recupero dei relitti”, in Archaeologia maritima mediterranea, An International Journal on Underwater Archaeology, No.2, 2005 (Pisa-Roma), pp. 48-91.
[8] F. Doglioni, “Stratigrafia e restauro. Tra conoscenza e conservazione dell’architettura”, ed. LINT, Trieste, 1997.
[9] F. Fassi, L. Fregonese, S. Ackermann, V. De Troia, “Comparison between Laser Scanning and Automated 3D modelling techniques to reconstruct complex and extensive cultural heritage areas”, Int. Arch. Photogramm. Remote Sens. Spatial Inf. Sci., Vol. XL-5/W1, 2013, pp.73-80.
[10] F. Fassi, C. Rossi, A. Mandelli, Emergency survey of remote and endangered archaeological sites, Int. Arch. Photogramm. Remote Sens. Spatial Inf. Sci., XL-5/W4, pp. 85-91, doi: 10.5194/isprsarchives-XL-5-W4-85-2015, 2015.
[11] F. Remondino, Heritage Recording and 3D Modeling with Photogrammetry and 3D Scanning. Remote Sensing 2011, 3, 1104-1138, ISSN 2072-4292, doi:10.3390/rs3061104.
[12] M. Peripimeno, “Sperimentazione di tecniche 3D laser scanning per l’analisi e la conservazione del patrimonio archeologico e storico-monumentale. Definizione di procedure e campi di utilizzo”, Proc. of National Congress SIFET - Integrazione tra le tecniche innovative del rilievo del territorio e dei beni culturali, Mondello, 29-31 June 2005. Table 5. Shipwreck “Napoli G” survey report. Survey session 1st 2nd 3rd 4th No. Photos 334 278 285 213 Images resolution 5616*3744 Acquisition time (mins.) 90 55 65 65 Orthophoto restitution time 1 day No. points 3D model (millions of points) 117 100 79 74