2016
Publication Year
2020-09-16T09:54:09Z
Acceptance in OA@INAF
Adjustable integration molds for X-ray optics with cold shaping: requirements and
conceptual design
Title
CIVITANI, Marta Maria; BASSO, Stefano; PARESCHI, Giovanni
Authors
10.1117/12.2234417
DOI
http://hdl.handle.net/20.500.12386/27404
Handle
PROCEEDINGS OF SPIE
Series
9905
Number
PROCEEDINGS OF SPIE
SPIEDigitalLibrary.org/conference-proceedings-of-spie
Adjustable integration molds for X-ray
optics with cold shaping:
requirements and conceptual design
Civitani, M., Basso, S., Pareschi, G.
M. Civitani, S. Basso, G. Pareschi, "Adjustable integration molds for X-ray
optics with cold shaping: requirements and conceptual design," Proc. SPIE
9905, Space Telescopes and Instrumentation 2016: Ultraviolet to Gamma
Adjustable integration molds for X-ray optics with cold
shaping: requirements and conceptual design
M. Civitani
a,1, S. Basso
a, G. Pareschi
aa
INAF Astronomical Observatory of Brera, Via E. Bianchi 46, I-23807 Merate (LC), Italy
ABSTRACT
The cold shaping of thin substrates is a worthwhile process for the realization of x-ray optics. The technique is based on the usage of integration molds to keep the substrate in the theoretical shape while it is fixed to a structure, which will limit at the desired level the residual spring back of the plate after the release of the constrain. Since some years, this process is in use at INAF/OAB to realize Slumped Glass Optics mirror modules by means of interfacing ribs. In principle, the optical design at a given focal length of each mirror shell is different for each radius and therefore several integration molds are necessary for an assembly of plates. Depending on the optical design of the mirror module to be realized and on the desired optical performances of the system, some simplifications can be introduced in order to reduce the number of integration molds to be realized. Nevertheless the most cost-efficient solution to the problem is to realize an adjustable integration mold pair that can be shaped to the different theoretical configurations needed for the plates. This is advantageous not only in terms of number of molds and parts to be realized but also for the reduction of integration time thanks to the simplification of the process procedure. In this paper we describe the conceptual design of the system, describing its optical design, analysing its requirements and we report on the achieved results.
Keywords: X-ray grazing-incidence telescopes, X-ray segmented mirrors, cold slumping, hot slumping, integration and alignment, reference mandrel, replication techniques.
1
Introduction
Since several years, the slumped glass optics (SGO) has been developed for the realization of x-ray optics: with the realization of NuSTAR telescope [1], it can be considered well-proven and mature technology. It mainly relies on two phases: the glass segments are produced with hot slumping technique and they are assembled into modules. Several groups in Europe and in US have developed different hot slumping techniques [2,3]. As well, different integration concepts are under study [4,5].
A new mirror realization concept, called ‘cold slumping glass optics’, has been recently introduced and patented (TO2015A000219). This technique skips the first part of the process and starts directly from the thin flat glass sheets [6]. The assembly concept is based on the use of Wolter-I (or with desired optical design) counter-form moulds and of reinforcing ribs. The flat plates are bonded by means of ribs onto the supporting structure while they are wrapped around reference mandrels. These ribs constrain the foil profile to the correct shape during the bonding, damping the low-frequency residuals with respect to the counter-form configuration. Moreover, the ribs connect the different consecutive foils in the final assembly, playing the role of mechanical connectors increasing the structural stiffness. From a general point of view, the greater is the difference between the initial shape of the glass plate and the one of the reference mandrel, the greater will be the residual spring back effect (e.g. residual errors) on the glass after the release of the constrains at the end of the bonding phase. Starting from flat plates, the initial shape of the glass plates will be farer from the final theoretical one (e.g. Wolter-I), but the process can be tuned, almost in terms of glass thickness and constrains scheme, so that the final expected shape of the glass is compatible with the requirements. In all the cases in which the optical performances of the mirror module to be assembled are not so tight (e.g. few arcsecs), the pre-shaping of the plates with the hot slumping can be avoided.
Moreover, starting from flat glasses and skipping the hot slumping process, the initial (quite low) micro-roughness of the glass is preserved. This is a very important feature for high-energy applications (energies greater than 10keV): in these cases the cold replication approach represent a key process and is very attractive for high-throughput optics. In order to reach very small radius of curvature without breaks, very thin glass plates are necessary. In this regard, recent advancements in thin glass materials allow the development and the mass production of very thin glass foils of high quality (i.e. with low waviness errors), like Willow glass (thickness of 0.1-0.2 mm) produced by Corning or AF32 produced by Schott (thickness down to 0.055 mm).
The advantages of this new approach are the low weight and the low cost of the optics. As the hot slumping procedure is avoided, the realization costs are highly reduced, both for the slumping mandrel procurement cost and for the overall production time of the optic. Moreover, with the cold slumping approach, the excellent micro-roughness of glass foils is preserved, making these substrates ideal e.g. for the application of multilayer interferometric reflecting coatings. In the concept here presented, each pair (parabola and hyperbola) of several layers that will compose a final assembly is characterized by different Wolter-I parameters. These correspond to different values in radius of curvature, conical angle and longitudinal profiles. This means that, in principle, a compete set of pairs of reference mandrels is needed to build a complete assembly. The mandrels for this application are used just for integration and they do not need to be super polished. Moreover, they can be made also of metals like Aluminum, provided that the integration is carried out in a controlled temperature environment, in order not to be sensitive to the difference in CTE between the glass and the metal. In spite of the fact that the production cost of the mandrels is relatively low, the procurement of the overall set of mandrels can be expensive and time consuming. Moreover, it may introduce operational problems due to the need to switch them for each radial configuration.
In order to push forward the technology and reduce further the production time and simplify the integration process, the usage of pairs of adjustable integration molds for integration of several consecutive shells could be a very cost-effective and elegant solution. If it is possible to “generate” mandrels with different reference shapes, corresponding to different radial configurations, using a same single mechanical structure for many shells, the number of mandrel units to be procured reduces dramatically. Moreover, the operational problem of switching between the different integration molds is automatically solved (or reduced) as the mechanical interfaces and reference positions on the surfaces are the same. In this paper, we provide an overview of the concept, the requirements and the preliminary conceptual design. The integration procedure is summarized in Section 2. The adjustable integration mold geometry and design is reported in Section 3, while the sensitivity analysis with respect to the main geometric error is analyzed in Section 4. Preliminary conceptual designs are proposed in Section 5. Finally, the conclusions are reported in Section 6.
2
Integration procedure
In order to build an x-ray module based on cold slumping approach, the initial flat shape of the plates has to be corrected to the final Wolter-I by means of a proper integration procedure. Moreover, several flat glass foils have to be assembled with high accuracy upon each other.
The integration method, developed at INAF/OAB, employs precisely figured integration segmented molds (Parabolic and Hyperbolic in Wolter-I configuration) to form the mirror plates via vacuum suction during the integration process. When forced onto the integration mold, relying on the elasticity of the flat foils, the glass plates accurately replicate the shape of the integration mold. In this configuration, the first tandem of glass foils is bonded to a stiff structure by means of ribs, which freeze the correct shape before releasing the vacuum. The next mirror plates are successively bonded to the previously integrated plates in the stack.
Due to the difference in shape between the integration moulds and the glass plates, spring-back effects are expected after the vacuum release from the integration moulds. This effect is nearly zero at the rib locations, where the glass plates replicate very well the integration mould, while it becomes more important as the distance from the ribs increases. As the accuracy of the integrated plate improves decreasing the rib spacing, the number of the ribs can be optimized taking into account the desired optical performances, the weight of the module and the acceptable vignetting due to the ribs [7,8].
The corrective capability of the integration process has been studied through a detailed Finite Element Analysis (FEA). These analyses have been carried out varying the spatial wavelengths of longitudinal profile errors. Long-scale errors could be corrected almost entirely, whereas errors over a few cm-scale remained almost unchanged after the integration.
I
In correspondence of the ribs positions, the damping is effective both at low and high frequency. Between the ribs, the higher is the frequency the lower is the damping capability of the profile errors
In Figure 1A) and 1B) two examples of integration molds used in the last years to build assemblies with SGO techniques are shown. In the first case the integration molds are made of BK7 glass and are they have a parabolic and the hyperbolic shaper respectively, corresponding to a focal length of 20 m with 1 m radius of curvature. In the second case, the integration molds are made of Aluminium and correspond to a Wolter-I configuration with 8.4 m focal length and 242.5mm radius of curvature. Both molds pairs are convex and therefore suited to perform a so-called ’direct’ integration (i.e. with reflecting surface of the glass substrate in contact with the mold surface). The integration process can be also carrid out with an in-direct approach as reported in figure 1C, where a concave mold, with jointed parabolic and hyperbolic section, is used as reference mandrel for glasses slumped with indirect approach (the radius of curvature and the focal length are respectively 0.5m and 7.4m). in this case the rear of the glass substrate is in contact with the mold surface.
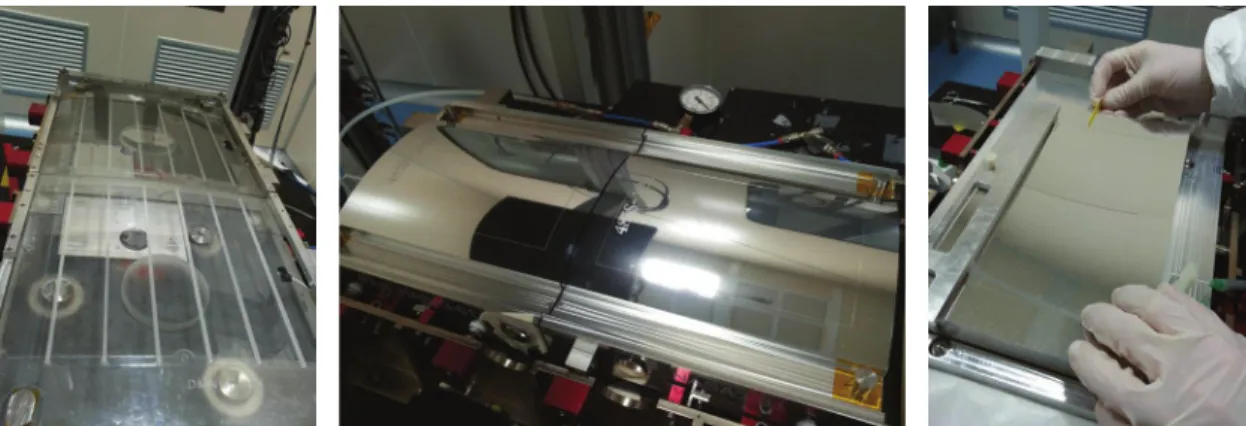
The Integration MAchine (IMA), available at the INAF/OAB, allows the cold slumping integration process and as well as the mutual plate alignment [9]. The relative alignment of the integration molds is carried out by means of picomotors acting on the hyperbolic mold in close loop with autocollimators. As each tandem of plates is bonded at a time with a very low shrinkage epoxy but very long curing time, this active control avoids possible misalignment caused by thermal drifts. In figure 1A) it is shown the present set-up of the IMA, while in figure 1B) is reported the integration process flow. Figure 1C) shows an assembly of integrated plate pairs.
Figure 1: (A) A pair of Parabolic and Hyperbolic molds made of BK7 during one of the integration phases: the glasses are constrained on the mold surfaces with vacuum suction and the ribs are aligned and ready to be bonded. (B) A pair of parabolic and hyperbolic molds made of alluminium: two slumped glass are positioned in
their optical area. (C) A monolithic (parabolic and hyperbolic sections are joined together) integration mold with concave optical surface.
Figure 2: (A) The Integration Machine (IMA) in INAF/OAB laboratories; (B) the integration process flow; (C) the X-ray Optical Unit Breadboard (XOU_BB) [11] Adjustable integration molds geometry and design
3
Adjustable integration mold geometry
Each of the Plate Pair (PP) in a stack is theoretically characterized by a different Wolter-I configuration. The radius of curvature, the conical angle and the profiles along the optical axis change in dependence of the radius at the Intersection Plane (IP) of the PP. Therefore, during the integration for each of the integrated PPs, the integration mold shape need to be changed accordingly. In order to avoid the procurement of several integration molds, a cost-effective solution for the realization of co-focal prototypal stacks has been found adopting a dedicated optical design, based on the ‘recycling’ of the integration molds [10]. Basically, by opportunely changing the relative alignment of the integration mold pairs it is possible to compensate the cone angle difference, converging the rays reflected by the different PPs to a common focus. As this configuration corresponds to a displacement of the best focus position along the optical axis, in dependence of the focal length, the radius of curvature and the azimuthal aperture of the different segments, the expected azimuthal aberrations at the common focus have different amplitude and are not always negligible. Therefore, in the following a particular optical prescription is defined and followed.
The selected optical configuration is almost similar to the one used as a study-case for a medium-size X-ray module described in [11]. The building inputs are the same. Segmented plates are grouped in sets of constant thickness and are stacked together by means of glass ribs. In order to provide a cost-effective solution for the glass ribs procurement, the distance between the different plates is set to be constant for different consecutive layers. Moreover, it is fixed in multiple of glass plate thickness to be compatible with an innovative realization approach that is under investigation. The focal length has been set to 8.4m (instead of 10m) in order to be easily compatible with standard Panter set-up (RefPanter). The radial size of the telescope is between 80 and 240 mm. In figure 3A) it is reported the ribs geometric prescription corresponding to the optical design just described. On the top, the mean rib thickness is grouped and fixed to the same values for consecutive plates. In the middle the average thickness of the different group of ribs is showed. On the bottom it is reported the tapered profiles for the ribs. In figure 3B), it is shown an enlarged view of a part of the radial stack (in green the initial double conical backplane, in yellow the ribs with constant thickness, in blue and cyan the glass plate thickness).
In order to keep the size of the glasses and the integration procedure with a reasonable frame, the innermost layer will be divided into six azimuthal sections while the external in twelve sections. In this way the azimuthal section of glasses will be around 80 mm (60°) for the innermost part and 125 mm (30°) for the outermost plates.
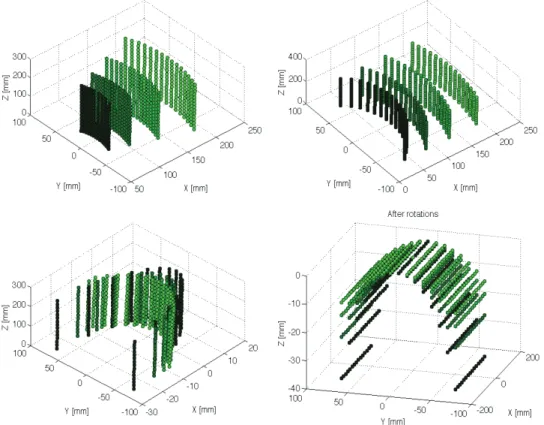
When a complete (radially) stack of plates is considered, the theoretical geometrical configuration of integration molds is the one represented in figure 4A. Taking into account for a constant width of the mold, the integration molds geometry is reported in figure 4B. The different mold shapes can be compared overlapping their central profiles both with respect to the position and the tilts as reported in figure 4C) and 4D). This condition can be easily implemented on the IMA as the hyperbolic mold alignment can be adjusted with respect to the parabolic one for each of the element of the stack. This condition corresponds to the ‘recycling’ configuration described before. Restoring the desired alignment between the central profiles of the molds in the theoretical configuration it is possible to obtain confocal mirror plates. As the common focus is degraded by the azimuthal aberrations, the new idea is to manage the variations in terms of average radius of curvature, the conical angle and the longitudinal profiles in such a way to reduce the impact of the errors that arises from a non-perfect integration mold.
1 1 Rb thickness mean All . . : . : 0 20 40 60 8o 160 120 14 Shell Rb thickness All 1500 1000 500 150 -100 -50 0 50 100 150 200 250 OptIcal axls Z [mm thIckness vanatIon All 20 '75 0 950 -200 -150 -100 -50 0 50 100 150 200 250 OptIcal axle Z [mm 130 125 120 115
Plate Pair profile
Optical axis Z [mm] 300. 200 100 0 -100 50 0 Y [mm] 50 00 50 150 100 X [mm] 200 250 50 -50 Y [mm] -loe o 50 1C0 X [mm] 2C0 300, E E 1CC o 100 50 0 Y [mm] 50 CO -30 0 -10 X [mm] 0 20 -10 -20-N -30--40 100 After rotations 50
/4.
0 -50 Y [mm] 200 0 -100 -200 X [mm]Figure 3: (A) The ribs geometric prescription corresponding to the dedicated optical design described in the text. On the top the mean thickness grouped the mean rib thickness is grouped and fixed to the same values for
consecutive plates. In the middle it is showed the average thickness of the different groups of ribs. On the bottom one can see the tapered profiles for the ribs. (B) An enlarged view of the radial stack structure: in green
the initial double conical backplane, in yellow the ribs with constant thickness, in blue and cyan the glass plate thickness.
Figure 4: Variation of the parabolic integration mold along the radius, assuming a complete stack of mirrors realization.
Image depending on focal plane positon. te:
-5 0 5 10
axis [mm[ HEW depending on the focal plane distance 100
ä 50
+
b00 0 500
Exhafocal <- [mm]-> Inhafocal
Image depending on focal plane positon. te:
-5 0 axis [mm[ HEW depending on the focal plane distance
5 10
0
Exhafocal <- [mm]-> Inhafocal
500
Image depending on focal plane positon. te:
-5 0 5 10
axis [mm[ 100
HEW depending on the focal plane distance
50
-500 0 500
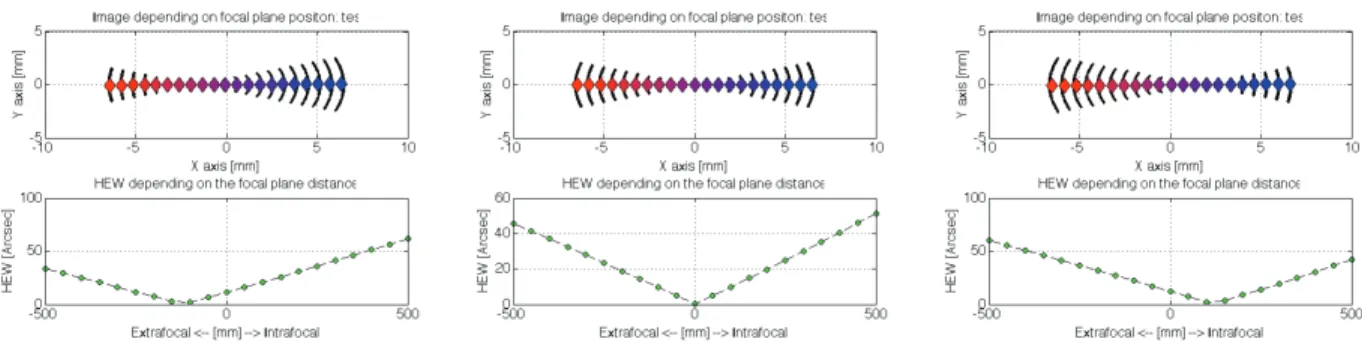
Exhafocal <- [mm]-> Inhafocal Figure 5: Focal spot for three PPs (PP#6, PP#7 and PP8) assuming the same integration mold pairs
correspondent to PP#7 for the integration of the adjacent PP. The innermost and the outermost
First of all, in order to point out the necessity of the adjustable integration mold, we analyse the expected results of the simplified configuration, achievable with the same integration moulds pairs opportunely re-aligned to compensate for the taper angle between the parabolic and the hyperbolic segments. In the case of the external 14 plate pairs to be integrated, it is foreseen to have the integration molds corresponding to one of the middle PP (in the following the PP#7). Supposing the usage of this integration mold pairs for the adjacent plate pairs, the impact on the HEW is derived by ray-tracing simulations. The differences in radius are on average 1.6 mm in both directions (PP#6 and PP#8). In this simplest case, the contribution to the HEW to the overall stack due to the use of not optimized molds for all substrates is more than 10’’ for both the cases.
In the calculation, an azimuthal aperture of about 125 mm is considered, corresponding to the integrated plate pairs. In Figure 5 the focal spots, as intercepted by intra-extra focal planes, and the corresponding HEW are reported. Both adjacent PPs have a best focus position in which the minimum HEW is about 2’’. However, as long as they are considered at the common focal plane, they appear clearly out-of-focus and their azimuthal aberration is not negligible. After this analysis one can conclude that this kind of approximation is not possible with the selected optical configuration. Indeed the radial shape of the mould needs to be adjusted in order to overcome this problem.
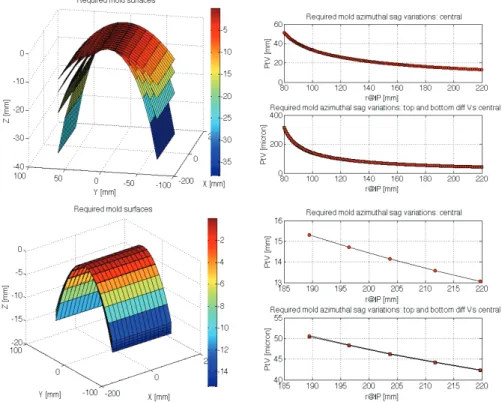
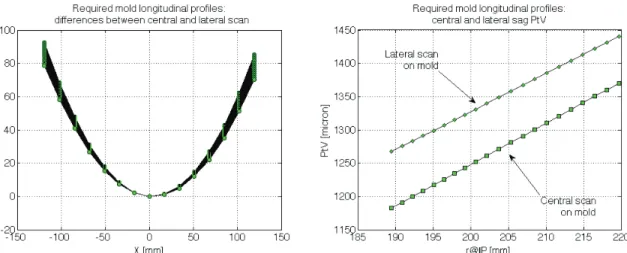
In the theoretical configuration, each PP (parabola and hyperbola) is characterized by a different Wolter-I profile. The overall geometric surfaces for the parabolic sections (for all the 133 PPs that compose the mirror assembly in the selected optical design) are represented in figure 6A). The variations of the surface correspond to variation of radius of curvature, conical angle and longitudinal profiles. The reference coordinate system has been changed in order to set the central position on the mold in the centre of the reference system. The radius of curvature variation of the central azimuthal section corresponds to a variation in the azimuthal profile PtV. This variation is reported in figure 6B). In the top panel is shown the radial PtV for some of the different radial configuration. The overall azimuthal variation of the average azimuthal sag is of almost 50mm. On the bottom panel it is shown the difference of the top and the bottom azimuthal profiles on the mold surfaces with respect to the central position along the longitudinal direction. This variation, corresponding to the conical angle modification for the different PP, is quite demanding. In conseguence of these results, we will consider a simplified configuration, reducing the number of plate pairs to be accounted for. Taking into account only the twenty external layers of the assembly, the variations reduce to around 2.5mm in azimuthal profile and maximum 0.05 mm in azimuthal top/bottom differences with a range of around 0.01 mm to take into account the different PP. This is a much more realistic situation for the integration molds to be provided (see figure 6C and 6D). The corresponding azimuthal profiles at the top, at the center and at the bottom of the molds are reported in figure 7A. The changes in azimuthal direction at the top and at the bottom of the molds corresponds to the conical angle variations, while the longitudinal profiles configurations is reported in figure 7B9. The central profile along the longitudinal direction and the extrenal ones are reported.
-10
N
30
ß0
100
Required mold surfaces
o 50 Y [mm] 10 -15 -20 -25 30 35 -100 -200 g [mm]
Required mold azimuthal sag variations: central
100 120 140 160 r @IP [mm]
Required mold azimuthal sag variations: top and bottom dill Vs central 400 130 200 220 200 > a 80 100 120 140 160 180 200 220 r@IP [mm] 0. N
Required mold surfaces
0
V [mm] -IM -zm X [mm]
Required mold azimuthal sag variations: central
190 195 200 205
r @IP [mm]
Required mold azimuthal neo variations '. top and bottom dill Vs central
55 210 215 220 2 50 45 41&5 190 195 200 205 r@IP [mm] 210 215 220 60 40 É 20 N 0
Required mold profiles dill Vs central . bottom scan
280 -60 -40 -20 0 V [mm]
Required mold profiles central azimuthal scan
o -5 E -10 N -15 20 40 60 80 -80 -60 -40 -20 0 20 V [mm]
Required mold profiles dill Vs central . top scan
0 40 -p -40 EC BC 600 -60 -40 -20 0 V [mm] 20 40 60 80
Required mold longitudinal profiles central scan
X[mm] Required mold profileslateral scan
1CC ó 0 19Y50 0 -1000 20050 50 100 150 X fmm]
Required mold profiles, lateral scan change
-100 -50 50 100 150
X [mm]
Required mold profiles lateral scan deformations
-100 -50 0 50 100 150
X [mm]
Figure 6: (A) The modification in the integration mold surface if the same mold has to be used for all the segments of a stack. (B) The average radius and the difference between top and bottom azimuthal curvature to account for the conical angle variations. (C) The modification in the integration mold surface if the same mold
has to be used for just the external twenty segments of a stack. (D) The average radius and the difference between top and bottom azimuthal curvature to account for the conical angle variations if the external twenty
segments are considered.
Figure 7: (A) The different azimuthal profiles required for the top, the central and the bottom positions on the parabolic molds. (B) The profiles along the optical axis for the central and the lateral scans.
100 80 60
f
&, 40,
20 0 2-Y50 -100Required mold longitudinal profiles: differences between central and lateral scan
-50 0 X [mm]
50 100 150
14
14
Required mold longitudinal profiles: central and lateral San PtV
50 ]0 50 ]0 50 Lateral scan on mold 1200 115185 Central sean on mold 190 195 200 205 210 215 220 r@IP [mm]
Figure 8: (A) Difference between the longitudinal profiles on the central and on the lateral parts of the mold in correspondence to the different PP. (B) PtV of the longitudinal profiles sag on the central and on the lateral
portion of the integration mold in dependence of the radius of curvature of the PPs.
4
Surface requirements
The optical surface requirements of the integration molds have been set by means of numerical simulations. In this regard, ray-tracing simulations have been carried out for accounting for the major geometric errors of the molds, while a Fresnel analysis [12] has been performed for taking into account the profiles requirements definition.
Due to the segmented configuration and to the alignment possibilities, it is always possible to consider a different radial position with respect to the theoretical one. This introduces an azimuthal error concerning the entire plate. The impact in terms of HEW for this kind of re-adjusted configuration is reported in Table 1. The errors and the effect on the HEW are almost linear. As the HEW is degraded for around 5’’ in correspondence of an error of 1 mm on the radius of curvature, the necessity for this kind of correction is clear. The azimuthal PtV error has to be controlled down to 0.01 mm in order to reduce the impact on the HEW below 1 arcsec.
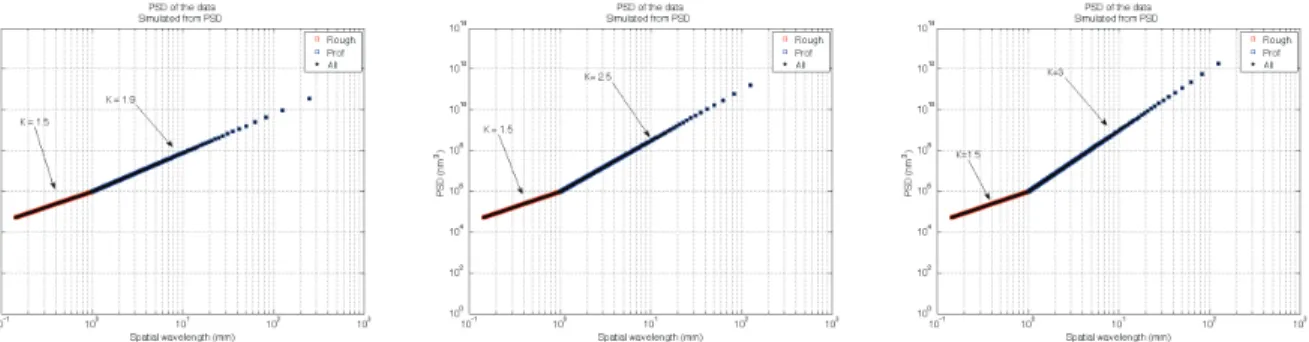
In the Wolter-I configuration, the longitudinal profiles are characterized by an almost parabolic deviation from the line that corresponds to the conical surface. The amplitude of this deviation depends on the corresponding radius at the intersection plane. An error on this sag has an impact on the HEW performances. The error is almost linear: the amplitude of the deviation as reported in table 2, where errors of 10nm, 1000nm and 1microns are considered. In order to prevent degradation on the HEW larger than 1’’, the parabolic profile sagitta has to be controlled at 100nm level. The conical surface that sustains the Wolter-I configuration is characterized by an angle with respect to the optical axis. This angle is normally related to the radius of curvature in fixing the focal length. Nevertheless, due to the segmented configuration, a conical angle error can be partially recovered tilting the integration mold surface as reported in table 3. As long as the conical angles errors are lower than around 10 arcsec, the impact on the HEW is lower than 1 arcsec. In order to allocate an error budget for the mold surface, an assessment on the impact of the figure errors in terms of frequency range has been carried out via simulations based on Fresnel diffraction approach to include properly the mid-frequency error domain. The simulations have been carried out on simulated data profiles and roughness profiles. In both cases, they have been derived from the PSD. In this preliminary analysis a single break in the overall PSD has been considered so that two different power laws describe the surface error depending on the frequency range. It should be noted that above a certain wavelength, one may expect an increase of the PSD slope can be expected. An example of the input in terms of PSD is shown in figure 9. In this case the HEW is determined at 1 keV, hence the wavelengths below 72 µm are expected to be irrelevant and are not considered.
PSDOf nedaza Simulatetllrom PSD 10n Spatial wavelength (mm) 10° Pl a Simulatetl from ng PSD 10n Spatial wavelength (mm) 10° Pl a Simulatetl from ng PSD 10n Spatial wavelength (mm) 10°
Table 1: Sensitivity analysis with respect to error in radius of curvature. Errors ranging between 100micron and 10mm are considered. The correspondent PtV error along the azimuthal profiles is reported for each of the
cases, together with the impact on the HEW.
Error in radius of curvature PTV azimuthal error (Micron) Final HEW
0.1mm 8.2 0.48’’
1mm 82.5 5.1’’
10mm 825.1 42.57’’
Table 2: Sensitivity analysis with respect to error longitudinal profile sag. Errors ranging between 10nm and 1micron are considered. The correspondent impact on the HEW is reported.
Error in sag Final HEW
10 nm 0.06’’ 100 nm 0.6’’ 1000 nm 6.3’’
Table 3: Sensitivity analysis with respect to conical angle. Errors ranging between 1’’ and 100’’ are considered. The correspondent HEW (without any tilt compensation) and the ‘realigned’ HEW are reported for each of the
cases.
Error in conical slope No comp. HEW Final HEW
1’’ 0.8’’ 0.1’’
10’’ 8.2’’ 0.8’’
100’’ 85’’ 8.5’’
Once fixed the reference PSDs, ten different profiles are reconstructed from inverse FFT with different random phases, so that the different profiles have all the same PSD. Slightly differences are expected in the PtV of the single profile, but by definition they all have the same RMS in a given wavelength range. In Figure 10 the PtV and the RMS of the micro-roughness profiles, the figure profile and the overall profile (the sum of the two) for each of the ten simulated profiles are shown. The profiles and the corresponding HEW (cyan) values that were determined are reported in Figure 11. The color scale for the profile error map is in microns.
Once chosen the part of the PSD relevant to the micro-roughness with a negligible contribution in all the cases (@1 keV) the figure error PSD is built-up, defining the wavelength of the separation from scattering aspects and the new power-law index. Different indexes are considered for PSD profile (1.5, 1.9 and 3.0) and different break position (1 mm and 2 mm). Ten profiles are generated for each case. The results are summarized in Table 4. An RMS of about 20 nm guarantees a HEW better than 1 arcsec, while to keep the angular resolution at few arcsecs level a RMS of around 100nm is necessary.
102
10
map:Simulated from PSD Profiles Pry and RMS
i
--Roughness01V Roughness RME tProfPIS Prof RMS -0- Overall 01V Overall RMS 4 6 #Profile 10 on 102 101 map:Simulated from PSD Profiles PtV and RMS 0- Roughness P1V Roughness RMS ---Prof. P14 Prof. RMS - 0-Overall P1V 4 /*Profile 10 1Ó map:Simulated from PSD Profiles PtV and RMS 10' t---RoughnessP V 102 RoughnessRMS --Prof. P[V Prof. RMS -fOveralll PtV Overall RMS 101t 1
'
100 4 8 10 #Profile HEW [Aresec] axis [mm] T ° 88 v2
2 v 8 8 map:Simulated from PSD 4 3 2 x 1 2 4 6 8 10 X axis [mm] 015 0.1 0.05 0 -0.05 -0.1 -015 10 8 6 4 x 2 map:Simulated from PSD 2 4 6 8 10 Xaxis [mm] 0.6 04 0.2 0 -0.2 -04Figure 10: RMS and PtV for the different longitudinal profiles generated from the PSD adding random phases to the different sinusoidal components generated with amplitude defined by the PSD.
Figure 11: Longitudinal profiles errors amplitude for the simulated profiles and correspondent HEW as inferred from the Fresnel algorithm and the RT simulations.
Table 4: Expected mean HEW for ten randomly generated profiles staring from a double PSD curve with a cut-off at 1mm or 2mm and different slopes index at lower frequencies. The average rms of the profiles generated
with the two PSD is reported.
LKNEE [mm] APSD1 KPSD1 K PSD2 Profile From PSD1 PtV (nm) Profile From PSD1 RMS (nm) Profile From PSD2 PtV (nm) Profile From PSD2 RMS (nm) Total Profile PtV (nm) Total Profile RMS (nm) HEW (arcsec) 1 1 30 1.5 1.9 7.5 1.1 69.2 15.4 72.5 15.4 0.4 ± 0.06 2 1 30 1.5 2.5 7.7 1.1 266.8 70.6 269.4 70.7 1.5 ± 0.14 3 1 30 1.5 3.0 7.8 1.1 921.4 265.4 923.3 265.4 6.1 ± 1.24 5 1 60 1.5 1.9 11.1 1.5 95.6 21.8 99.4 21.8 0.5 ± 0.01 4 1 60 1.5 2.5 11.2 1.5 381.0 99.9 384.5 99.9 2.2 ± 0.44 6 1 60 1.5 3 10.8 1.5 1255.7 375.3 1258.8 375.3 8.8 ± 1.53 7 2 30 1.5 1.9 9.9 1.4 59.5 13.4 64.0 13.4 0.4 ± 0.1 8 2 30 1.5 2.5 10.0 1.4 189.8 49.7 193.3 49.8 0.8 ± 0.1 9 2 30 1.5 3 9.5 1.4 520.2 156.9 523.8 156.9 3.5 ± 0.67 10 2 60 1.5 1.9 14.4 2.0 82.3 18.9 88.2 19.9 0.5 ± 0.0 11 2 60 1.5 2.0 13.9 2.0 270.4 70.4 275.7 70.4 1.5 ± 0.22 12 2 60 1.5 3.0 14.3 2.0 793.7 221.8 799.4 221.8 5.5 ± 1.21
5
Preliminary conceptual design
As highlighted in the introduction, the geometry of the adjustable integration molds should be compatible with the IMA design. In principle, they can be concave or convex, for direct or indirect integration. In one case the optical surfaces of the plates is in contact with the integration mold, while in the second case the backside of the plates is in contact with the mold.
The convex integration molds surface has the advantage that can be directly measured in UV or x-ray for a complete characterization if opportunely polished. Conversely, the disadvantage is that in this case the thickness variation of the glass should be taken into account or corrected [14,15].
The most attractive integration configuration fits the integration molds case: in this case the two blocks are around 250mm x 250mm each. Nevertheless, if needed, it is possible to foresee a larger area for the optical surfaces, keeping the given limits only for the supporting parts. Depending on the selected configuration in fact, it could be that the adjustable mold area is greater than the available standard area.
Different materials can be envisaged for the adjustable mandrel surface. The selection will be carried out in terms CTE match with respect to the glass and the bending capabilities. Moreover, its functionality should be also taken into account: the material should be easy to clean and be resistant to scratches. A summary of the different possibilities is reported in table 6.
Table 5: Materials for the mandrel reference surface. The Willow CTE is 3-5ppm/°C
CTE [ppm/°C] Bending capabilities Cleaning Scratches Costs
Titanium 3-5 ++ - - + Borofloat 3.25 - + + - Alluminium 23.1 + - - + Silicon 2.56 - + - - Silicon carbide 2.77 + + + - Fused silica 0.5 - + + -
NODAL SOLUTION SOB T1 SI. T.001101 ANSYS R14.5 Academic NODAL SOLUTION SOB +1 S1 (AVM 09.5 +.002169 SID5 +.781E+08 ANSYS R14.5 Academic -6517.38 008 +08 521E+08 08
.867E+0 60E+08 +08 607E+08 .694 781E+08
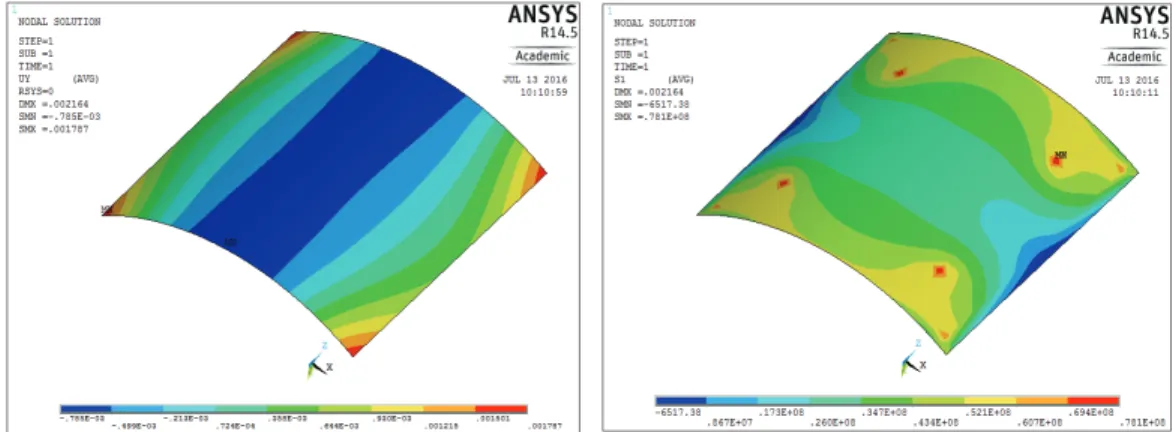
Different possible configurations can be envisaged. In a first case the standard four point bending is foreseen to change the radial configuration of the molds. From a general point of view, a flat plate with a given size and thickness can be bent to a fixed radius of curvature, by means of two loads acting on the edges of the plate while it is supported in other two positions. In dependence of the convex/concave configuration the position of the supporting and load points is different so that the optical surface of the integration molds remains free. The size of the plate, the distance between the supporting positions and the loads acting on the edge concur to the radius of curvature definition. Smaller radii of curvature are more difficult to be achieved, as the stress imposed on the plate is higher. FEM simulations will be carried out to analyse to optimize the geometry of the system. Another solution foresees a pre-shaped adjustable mold in Wolter-I configuration, to be bent to different adjacent configurations. In figure 13 is reported, as an example, the case of a cylindrical surface 250mm x 250mm x 4mm with a starting radius of curvature of 220mm: applying a force of around 300N in the corners it is possible to change the azimuthal PtV of around 2.5mm. Other solutions can be based on a higher number of actuators to be placed under the reference surface. The impact of all the deformations with respect to the theoretical Wolter-I configurations should be carefully evaluated in order to choose the final mechanical configuration to be implemented.
Figure 12: (A) Mold geometry: the radius at PHIMAX and at the Intersection plane (IP) are highlighted in red. The longitudinal profiles on the central and on the lateral side are marked in yellow. (B) The variations in the
radius of curvature in and in longitudinal profiles are reported as dashed lines. Red arrows indicate the positions for the loads.
Figure 13: (A) Vertical displacement in the simulation result, starting from a applying a force of around 300N in four points at the edges of a cylindrical surface with 0.22m radius of curvature. The reference surface is 250mm x 250mm x 4mm made of glass. (B) The position is around 50-80Mpa, maximum values are in correspondence
of the supporting position.
The metrology in both of the cases can be directly made on the surface by means of 3d machine for azimuthal profiles and conical shape as the required accuracy is of few microns. Instead, the sag and the longitudinal profile errors needs better accuracy. The evaluation of the performances of the deflectometric set-up presently used for the dust particle detection on board of the IMA [16,17] is under investigations.
Optical axis l i PHIMAX IP L Loads ds Loadsdsdsds
6
Conclusions
The realization of x-ray optics through the cold shaping of thin substrates is an efficient and worthwhile process. The technique is based on the usage of integration molds to keep the substrates in the theoretical shape while they are fixed to a structure, which will limit at the desired level the residual spring back of the plate after the release of the constrain. In principle, at a given focal length, for each radius and therefore for each of the plate to be integrated, the optical design is different. As a consequence, in principle several integration molds are necessary for an assembly of plates. Depending on the geometry of the system to be realized and on the desired optical performances of the system, some simplifications can be introduced in order to reduce the number of integration molds to be realized. Nevertheless the most cost-efficient solution to the problem is to realize an adjustable integration mold pair that can be shaped to the different theoretical configurations needed for the plates. This is advantageous not only in terms of number of molds and parts to be realized but also for the reduction of integration time thanks to the simplification of the process procedure.
In this paper, starting from the optical design of a prototypal module to be realized, the geometric prescription of the adjustable integration molds has been highlighted. The sensitivity analysis on the main geometric parameters that defines the optical surface has been explored and the requirements on the surfaces have been set. The optimization of the amplitude and position of the loads to bend the mold surfaces to desired level will be carried out thought FEM analysis, both with respect to accuracy and stability. The most reliable solution will be used in the next months to build the first prototypal adjustable integration mold pairs.
7
Acknowledgment
This research is supported by ASI.
8
References
(1) F.A. Harrison, et al., "The Nuclear Spectroscopic Telescope Array (NuSTAR)", Proc. SPIE 7732, (2010) 10.1117/12.858065
(2) W. Zhang, et al., "Lightweight X-ray Mirrors for the Constellation-X Mission," Proc. SPIE 6266, (2006) (3) M. Ghigo, S. Basso, R. Canestrari, P. Conconi, O. Citterio, M. M. Civitani, E. Dell’Orto, D. Gallieni, G.
Pareschi, G. Parodi, L. Proserpio, D. Spiga, “Hot slumping glass technology and integration process to manufacture a grazing incidence scaled prototype for the IXO telescope modules”, Proc. SPIE 7437, (2009) (4) Kai-Wing Chan, et al, "An approach for alignment, mounting, and integration of IXO mirror segments," Proc.
SPIE 7437, 74371D (2009)
(5) M. M. Civitani, S. Basso, M. Bavdaz, O. Citterio, P. Conconi, D. Gallieni, M. Ghigo, B. Guldimann, F. Martelli, G. Pagano, G. Pareschi, G. Parodi, L. Proserpio, B. Salmaso, D. Spiga, G. Tagliaferri, M. Tintori, E. Wille, A. Zambra, “IXO x-ray mirrors based on slumped glass segments with reinforcing ribs: optical and mechanical design, image error budget, and optics unit integration process”, Proc. SPIE 7732, (2010)
(6) M.M. Civitani, S. Basso, O. Citterio, M. Ghigo, B. Salmaso, G. Pareschi, G. Vecchi , “ Cold shaping of thin glass foils: a fast and cost-effective solution for making light-weight astronomical x-ray optics ", Proc. SPIE 9603 (2015)
(7) G. Parodi, F. Martelli, S. Basso, M. Bavdaz, O. Citterio, M. M. Civitani, P. Conconi, M. Ghigo, G. Pareschi, L. Proserpio, D. Spiga, E. Wille, A. Zambra, “Design of the IXO optics based on thin glass plates connected by reinforcing ribs”, Proc. SPIE 8147, (2011)
(8) M. M. Civitani, S. Basso, O. Citterio, P. Conconi, D. Gallieni, M. Ghigo, G. Pareschi, L. Proserpio, B. Salmaso, G. Sironi, D. Spiga, G. Tagliaferri, A. Zambra, F. Martelli, G. Parodi, P. Fumi, M. Tintori, D. Gallieni, M. Bavdaz, E. Wille, “Accurate integration of segmented x-ray optics using interfacing ribs”, Opt. Eng. 52(9), 091809-091809, (2013)
(9) M. M. Civitani, S. Basso, M. Bavdaz, O. Citterio, P. Conconi, D. Gallieni, Ghigo, M., B. Guldimann, F. Martelli, G. Pagano, G. Pareschi, G. Parodi, L. Proserpio, B. Salmaso, D. Spiga, G. Tagliaferri, M. Tintori, E. Wille, A. Zambra, “An integration machine for the assembly of the x-ray optic units based on thin slumped glass foils for the IXO mission”, Proc. SPIE 8147, 81470R (2011)
unit for the IXO telescope,” Proc SPIE 8141, 81410M (2011)
(11) S. Basso, M.M. Civitani, G.Pareschi, “Design of a medium-size x-ray mirror module based on thin glass foils”, SPIE 9905 (2016)
(12) V. Burwitz, M. Bavdaz, G. Pareschi, M. Collon, W. Burkert, M. D. Ackermann, G. Hartner, D. Spiga, M. M. Civitani, B. Menz, “In focus measurements of IXO type optics using the new PANTER x-ray test facility extension,” Proc SPIE 8861-51, (2013)
(13) Raimondi, L., Spiga, D., "Mirror for X-ray telescopes: Fresnel diffraction-based computation of point spread functions from metrology," AA 573, A22 (2015)
(14) L. Proserpio, C. Wellnhofer, E. Breunig, P. Friedrich, A. Winter, “Addressing the problem of glass thickness variation in the indirect slumping technology”, Proc. SPIE. 9603 (2015)
(15) M. M. Civitani, M. Ghigo, J. Hołyszko, G. Vecchi, S. Basso, “Ion beam figuring of thin glass plates: achievements and perspectives”, Proc. SPIE 9905 (2016)
(16) M. M. Civitani, S. Basso, M. Ghigo, D. Spiga, B. Salmaso, G. Pareschi, G.Vecchi, V. Burwitz, G. D. Hartner, B. Menz, "Slumped Glass Optics based on thin hot formed glass segments and interfacing ribs for high angular resolution X-ray astronomy: performances and development status," Proc. of SPIE Vol. 9603, (2015)
(17) E. Breunig et al.,” Characterising x-ray mirror deformations with a phase measuring deflectometry system,” Proc. SPIE 9144 (2014)

![Table 5: Materials for the mandrel reference surface. The Willow CTE is 3-5ppm/°C CTE [ppm/°C] Bending capabilities Cleaning Scratches Costs](https://thumb-eu.123doks.com/thumbv2/123dokorg/8095348.124753/13.918.105.821.907.1054/materials-mandrel-reference-surface-bending-capabilities-cleaning-scratches.webp)