2015 Publication Year
2020-04-02T15:06:46Z Acceptance in OA@INAF
Ammoniated phyllosilicates with a likely outer Solar System origin on (1) Ceres Title
DE SANCTIS, MARIA CRISTINA; Ammannito, E.; RAPONI, Andrea; Marchi, S.; McCord, T. B.; et al. Authors 10.1038/nature16172 DOI http://hdl.handle.net/20.500.12386/23791 Handle NATURE Journal 528 Number
Ammoniated-phyllosilicates on dwarf planet Ceres with a likely outer solar system origin
M.C. De Sanctis1, E. Ammannito2,1, A. Raponi1, S. Marchi 3,1, T.B. McCord4, H.Y. McSween5, F. Capaccioni1, M.T. Capria1, G. Carrozzo1, M. Ciarniello1, A. Longobardo1, F. Tosi1, S. Fonte1, M. Formisano1, A. Frigeri1, M. Giardino1, G. Magni1, E. Palomba1, D. Turrini1, F. Zambon1,J-P Combe4, W. Feldman6, R. Jaumann7, L.A. McFadden8, C.M. Pieters9, T. Prettyman6, M. Toplis10, C.A. Raymond11, C.T. Russell2.
1 Istituto di Astrofisica e Planetologia Spaziali, INAF, via del fosso del cavaliere 100, 00133 Roma, Italy
2 Institute of Geophysics and Planetary Physics, University, of California, Los Angeles, CA, USA.
3 Solar System Exploration Research Virtual Institute, SRI, 1050 Walnut St, Boulder, CO 80302, USA
4 Bear Fight Institute, 22 Fiddler's Road, P.O. Box 667, Winthrop, WA, 98862, USA 5 Department of Earth & Planetary Sciences, University of Tennessee,
Knoxville, TN 37996-1410, USA
6 Planetary Science Institute, Tucson, AZ 85719-2395, USA
7 Institute of Planetary Research, German Aerospace Center (DLR), Rutherfordstrasse 2, 12489 Berlin, Germany.
8 NASA Goddard Space Flight Center, Greenbelt, MD 20771, USA
9 Department of Earth, Environmental, and Planetary Sciences Brown University, Providence, RI 02912, USA
10 Institut de Recherche d'Astrophysique et Planétologie, Observatoire Midi Pyrénées, Université Paul Sabatier, 14 Ave. E. Belin, 31400, Toulouse, France.
11 Jet Propulsion Laboratory, California Institute of Technology, Pasadena, CA, USA.
Studies of the dwarf planet Ceres using ground and orbital telescopes have concluded that its closest meteoritic analogues are the volatile-rich CI and CM carbonaceous chondrites1,2. Water in clay minerals3, ammoniated phyllosilicates4, or
a mixture of Mg(OH)2 (brucite), Mg-carbonate and iron-rich serpentine5,6 have all
been proposed to exist on the surface. In particular, brucite has been suggested from analysis of the mid-IR Ceres’ spectrum6. However, lack of spectral data across
and the H2O bending overtone are found, have precluded definitive identifications.
In addition, water vapor around Ceres has recently been reported7, possibly
originating from localized sources. Here we report 0.4-5 μm spectra of Ceres acquired from a distance of ~ 82000 km to 4300 km from the surface. Our
measurements indicate widespread ammoniated-phyllosilicates across the surface, but no detectable water ice. Ammonia, accreted either as organic matter or as ice, may have reacted with Ceres' clays during differentiation. This implies that material from the outer Solar System was incorporated into Ceres, either during its
formation at great heliocentric distance or by incorporation of material transported into the main belt.
The Visible-Infrared Mapping Spectrometer VIR8 on the Dawn spacecraft9 obtained hyperspectral images of Ceres’ surface in the spectral range 0.4-5 μm with an Instantaneous Field Of View (IFOV) of 250 μrad (Fig.1). This range includes the 2.6-2.8 µm spectral region precluded from telescopic measurements due to the atmospheric absorptions. As such, Dawn data provide new constraints on Ceres’ surface composition.
The average spectrum of Ceres’ surface measured by VIR shows a low level of reflectance combined with prominent thermal emission at longer wavelengths, indicative of a very dark, warm surface. At the spatial scale of ~11 km/px, daytime surface temperatures of Ceres span the range 180-240 K at a heliocentric distance of 2.86 AU, with maximum temperatures measured in the equatorial region, corresponding to the minimum solar incidence angle. This range of temperatures is generally incompatible with a
widespread occurrence of water ice on the surface, even if very small localized occurrences of water ice cannot be excluded10 .
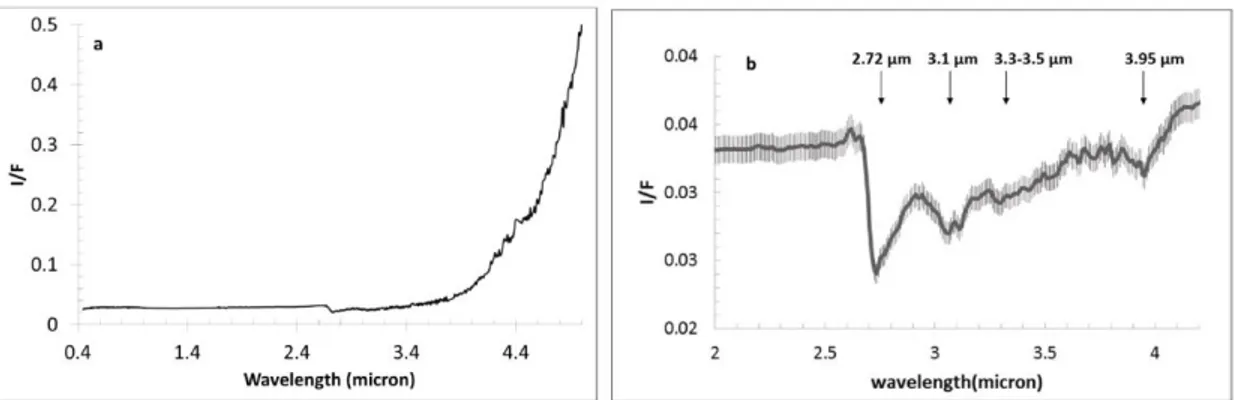
The geometric albedo obtained from VIR is 0.088 ±0.006 at 0.55 µm, derived from Hapke modeling of the average surface photometric properties of the body11. The measured value of the albedo agrees with HST observations in the F555W filter12. Given the low albedo of the surface, single scattering dominates the reflectance. The thermally-corrected reflectance spectrum of Ceres (Fig.1b) shows that the 2.6-4.2μm wavelength region is characterized by a broad asymmetric feature, characteristic of H2O/OH bearing materials. Within this broad absorption are several distinct absorptions bands at 2.72, 3.05-3.1, 3.3-3.5, and 3.95 μm.
Laboratory spectra of CM and CI carbonaceous chondrites measured under anhydrous conditions13 show the same prominent 2.7 µm OH absorption band as the Ceres spectrum, suggesting some mineralogical similarity, consistent with the idea that these materials are relevant meteoritic analogs for Ceres1,2.However, these chondrites are not a good match with Ceres at other wavelengths (Fig. 2). Even if the spectrum of Ceres is broadly similar to CM chondrites, distinct spectral features indicate variations in
mineral proportions that may reflect differences in alteration pathways and/or formation conditions. For instance, the ~4.0μm absorption is stronger in the Ceres spectrum than in most CM/CI spectra, while the ~3.4μm feature is usually stronger in CM/CIs. Moreover, CM and CI chondrites lack Ceres’ distinctive signature at 3.05-3.1 μm.
The 3.05-3.1 μm band dominates Ceres’ ground-based spectra, and was also observed on two other asteroids14. This signature has been attributed to a variety of different phases including water ice, hydrated or NH4-bearing clays and brucite3-6
(Extended Data Fig. 1). Brucite, in particular, clearly shows this narrow characteristic absorption15. Ammoniated mineral species, including NH
4-bearing annite and NH4 -montmorillonite, have an absorption feature near 3.06 μm, which could account for this band.
VIR observations show a strong and narrow absorption centered at 2.72-2.73 μm. This characteristic feature is distinctive for OH-bearing minerals (Extended Data Fig. 1). H2O-bearing phases, however, show a much broader absorption band that is a poor match for the Ceres’ spectrum. Water ice does not fit the observed spectrum, consistent with its instability at the maximum surface temperature. OH-stretching vibrations occur in the 2.7-2.85μm range for phyllosilicates16, with band centers at different wavelengths for different species.
Ceres is rich in absorption bands in the 3-4 μm region, but the spectral range 1.0-2.5 μm lacks distinctive features. Conversely, some terrestrial H2O- and OH-bearing phases show numerous diagnostic bands over this spectral range. For example, brucite has a prominent 2.46 μm band that is absent in the Ceres’ spectra (Extended Data, Fig.1). Also, the vibrations due to the OH overtone at about 1.4 μm and the bands due to H-O-H combination stretching and bending vibrations in the 1.9 μm region are absent in the Ceres’s spectrum. The combination of phyllosilicates with other species, however, can mask the presence of such bands.
In order to model Ceres’ surface spectrum, we solved the radiative transfer equation in a particulate medium, using the Hapke model17. We investigated several different combinations of mineralogical phases (Methods and Extended Data figures, table 1 and 2). We started with a simple combination of water ice with a dark component (amorphous
carbon or magnetite), but the presence of ice gives rise to clear absorption bands at 1.5 and 2μm that are not present in our data (Extended Data, Fig. 2). Also, the 3μm ice band center does not fit the Ceres data. Magnetite (or carbon) in the fits represents a highly absorbing species whose specific character is not defined in this analysis. However, the mixture with magnetite fits the spectral slope between 1 and 2.6 μm better. For this reason we choose to use magnetite in the other mixtures.
While the mixture of brucite, Mg-carbonate, a dark component, and Fe-serpentine (cronstedtite)6 is able to match the Ceres spectrum in the 2.9-4.2 μm range, it fails in fitting the intense 2.7 μm band (Fig 3). Also, mixtures of water ice with CM or CI carbonaceous chondrite do not fit the Ceres spectrum (Extended Data, Fig.3 and table 2). The fit is also poor in the case of adding brucite and water to carbonaceous chondrites (Extended Data, Fig.3 and table 2). The prominent 2.7μm band can be fit by a mixture of phyllosilicates such as Mg-serpentine (antigorite) or tochilinite (structurally interlayered brucite and iron sulfide), with Fe-serpentine (cronstedtite), carbonate (dolomite) and magnetite (Extended Data, Fig. 4a,b). The fit with antigorite is slightly better in reproducing the depth and center of the 2.7 μm band, thus for the following fits we use antigorite to reproduce the 2.7 feature. However, the fit does not fully reproduce the absorption at 3.05-3.1μm. By analogy with CM chondrites, however, tochilinite is more likely than antigorite to be in equilibrium with cronstedtite and thus may be a more plausible phase18. Addition of brucite to the mixture of phyllosilicates, carbonates and magnetite described above slightly improves the fits at 3.05-3.1 μm, but the fits are not satisfactory at shorter wavelengths (Extended Data, Fig. 4c,d and Table 2).
Other species that have clear absorptions at 3.05-3.1μm are ammonia-bearing minerals, which also show absorptions at 3.3 µm19. The best fit of Ceres’ spectrum over the infrared range is consistently obtained by adding ammoniated phyllosilicates to a dark material (magnetite), antigorite, and carbonate (Fig.4). Mixtures with different
ammoniated clays (Fig. 4) can match the Ceres spectrum, but the specific clay mineral cannot be determined. Carbonates are always needed in the fit but the specific carbonate mineral is not fully constrained because dolomite, magnesite, and calcite produce
equivalent matches to the observed Ceres’ spectrum (Extended Data, Fig.5 and Table 2).
Ammoniated clays on Ceres have been suggested previously4, possibly formed by reaction with ammonia ice. Recent observation of significant amounts of ammonia contained in organic compounds in some CI, CM, and CR chondrites20 suggests another mechanism for the formation of ammoniated clays on Ceres. The consistent 15 N-enrichment of carbonaceous chondrite organic matter may indicate that N-enrichment occurred in the solar nebula prior to star formation20, although it was likely processed into more complex molecules in the protoplanetary disk and parent bodies as well. Modest heating to 300-400° C of NH4-bearing organic matter in carbonaceous chondrites releases ammonia20, and a similar process on Ceres could have plausibly produced ammoniated phyllosilicates. The ability of smectite, especially montmorillonite, to incorporate ammonia by cation exchange is well documented21.
Ceres' surface enrichment in ammoniated phyllosilicates and relatively low bulk density pose significant challenges to understanding its origin and formation. One view holds that Ceres and most C-type asteroids could have formed close to their current locations,
inferred to be near the water snow line22. However, CI/CM meteorites have bulk water contents of 15-20% at most, while Ceres is inferred to be ~30% water by mass, based on its bulk density. This may indicate that Ceres retained more volatiles than objects
represented in the meteorite collection, or that it accreted from more volatile-rich material.
We have shown here that the altered CM and CI carbonaceous chondrites (CC) do not offer a good spectral match for Ceres, nor do all CCs show evidence of exposure to significant amount of ammonia. Therefore, it seems unlikely that a substantial population of ammonia-rich planetesimals could have formed locally at Ceres' current location in the main belt, even if the water snow line episdically migrated about 1 AU during the
evolution of the proto-planetary disk22-24. However, it is possible that Ceres grew close to its present position by accreting pebble-sized objects, some of which could have drifted inward from larger heliocentric distances25 where ammonia was stable. If the source of NH3 for ammoniated phyllosilicate was ammonia-bearing organic matter, Ceres could have accreted organics originally formed by irradiation of N2 ices condensed near the orbit of Neptune.
Alternatively, Ceres may itself have formed further out in the solar system, presumably in the trans-Neptunian disk, before being subsequently implanted in the main belt26. This view is corroborated by the presence of ammonia ice on other large trans-Neptunian objects, such as Orcus and Charon27,28. The implantation of Ceres in the main belt could have taken place during a migratory phase of the giant planets, either during
their growth in the proto-planetary disk29, or at a later time as a result of an orbital instability30.
References
1 Chapman, C.R. & Salisbury, J.W. Comparisons of meteorite and asteroid spectral reflectivities, Icarus, 19, 507-522 (1973).
2. McCord, T. & Gaffey, M. J. Asteroids: Surface composition from reflectance spectroscopy. Science 186, 352-355 (1974).
3 Lebofsky, L., Feierberg, M., Tokunaga, A., Larson, H. & Johnson, J. The 1.7-4.2 µm spectrum of asteroid 1 Ceres: Evidence for structural water in clay minerals. Icarus 48, 453-459 (1981).
4 King, T., Clark, R., Calvin, W., Sherman, D. & Brown, R. Evidence for ammonium-bearing minerals on Ceres. Science 255, 1551-1553 (1992).
5 A.S. Rivkin, E.L. Volquardsen, & Clark, B.E. The surface composition of Ceres: discovery of carbonates and iron-rich clays. Icarus 185, 563–567 (2006)
6 Millikin R. E. & Rivkin, A. S. Brucite and carbonate assemblages from altered olivine-rich materials on Ceres. Nature Geoscience 1, 258-261 (2009).
7 Küppers, M. et al., Localized sources of water vapour on the dwarf planet (1) Ceres, Nature, doi:10.1038/nature12918 (2014)
8 De Sanctis M.C., et al. The VIR Spectrometer, Space Sci. Rev., 163, 329 -369 (2011) 9 Russell C. T. & Raymond C.A. The Dawn Mission to Vesta and Ceres. Space Science Rev. 16, 3–23 (2011).
10 Nathues, A. et al. Sublimation in bright spots on Ceres , Nature submitted.
11 Helfenstein, P., & Veverka, J., 1989. Physical characterization of asteroid surfaces from photometric analysis. In: Binzel, R.P., Gehrels, T., Matthews, M.S. (Eds.), Asteroids II. Univ. of Arizona Press, Tucson, pp. 557–593
12 Li, J.-Y., McFadden, L.A., Parker, J.W., Young, E.F., Stern, S.A., Thomas, P.C., Russell, C.T., & Sykes, M.V., Photometric analysis of 1 Ceres and surface mapping from HST observations. Icarus 182, 143–160 (2006).
13 Takir, D. et al. Nature and degree of aqueous alteration in CM and CI
carbonaceous chondrites. Meteoritics & Planetary Science, 48, 1618-1637 (2013) 14 Takir, D., & Emery, J.P. Outer Main Belt asteroids: Identification and distribution of four 3-µm spectral groups, Icarus, 219, 641-654, (2012)
15 Beck, P., B. Schmitt, E.A. Cloutis, & P. Vernazza, Low-temperature reflectance spectra of brucite and the primitive surface of 1-Ceres? Icarus, 257, 471-476 (2015) 16 Bishop J. L. et al., Reflectance and emission spectroscopy study of four groups of phyllosilicates: smectites, kaolinite-serpentines, chlorites and micas, Clay Minerals, 43, 35–54 (2008)
17 Hapke, B. Theory of reflectance and emittance spectroscopy. Cambridge University Press. (2012).
18 Howard K. T., C. M. O’D. Alexander, D. L. Schhrader, & Dyl, K. A. Classification of hydrous meteorites (CR, CM and C2 ungrouped) by phyllosilicate fraction: PSD-XRD modal mineralogy and planetesimal environments. Geochimica et Cosmochimica Acta, 75, 2735-2751 (2011)
19 Bishop, J. L., Banin, A., Mancinelli, R. L. & Klovstad, M. L. Detection of soluble and fixed NH4+ in clay minerals by DTA and IR reflectance spectroscopy: A potential tool for planetary surface exploration. Planet. Space Science, 50, 11-19 (2002).
20 Pizzarello S., & Williams L. B., Ammonia in the early Solar System: an account from carbonaceous meteorites. The Astrophysical Journal, 749 161-167 (2012).
21 Borden, D. & Giese, R. F. Baseline studies of the Clay Minerals Society source clays: cation exchange capacity measurements by the ammonia-electrode method. Clays and Clay Minerals, 49, 444-445 (2001).
22 Martin, R. G. & Livio, M. On the evolution of the snow line in protoplanetary discs. Monthly Notices of the Royal Astronomical Society: Letters, 425, L6-L9 (2012).
23 Lodders, K. Solar System Abundances and Condensation Temperatures of the Elements. The Astrophysical Journal, 591, 1220-1247 (2003).
24 Bitsch, B., Johansen, A., Lambrechts, M., & Morbidelli, A. The structure of protoplanetary discs around evolving young stars. Astronomy & Astrophysics, 575, id.A28, 17 (2015).
25 Johansen, A., Mac Low, M.-M., Lacerda, P., & Bizzarro, M. Growth of asteroids, planetary embryos, and Kuiper belt objects by chondrule accretion. Science Advances, 1, Iss. 3, id. 1500109 (2015).
26 McKinnon, W. B. Where Did Ceres Accrete? Asteroids, Comets, Meteors 2012, Proceedings of the conference held May 16-20, 2012 in Niigata, Japan. LPI Contribution No. 1667, id.6475 Published in May 2012.
27 DeMeo, F.E. et al., Spectral variability of Charon’s 2.21-μm feature. Icarus, 246, 213-219 (2015).
28 Barucci, M.A. et al., Surface composition and temperature of the TNO Orcus. Astron. Astrophys. 479, L13–L16 (2008).
29 Walsh, K. J., Morbidelli, A., Raymond, S. N., O'Brien, D. P. & Mandell, A. M. A low mass for Mars from Jupiter's early gas-driven migration. Nature, 475, 206-209 (2011). 30 Levison, H. et al. Contamination of the asteroid belt by primordial trans-Neptunian objects. Nature, 460, 364-366 (2009).
Acknowledgements:
The authors would like to thank the following institutions and agencies, which supported this work: Italian Space Agency (ASI - Italy), National Aeronautic and Space
Administration (NASA-USA) and Deutsches Zentrum für Luft- und Raumfahrt (DLR-Germany). The Visible and Infrared Mapping Spectrometer (VIR) was funded and coordinated by the Italian Space Agency and built by SELEX ES, with the scientific leadership of the Institute for Space Astrophysics and Planetology, Italian National Institute for Astrophysics, Italy, and is operated by the Institute for Space Astrophysics and Planetology, Rome, Italy. The VIR calibrated data will be available through the PDS Small Bodies Node web site. A portion of this work was carried out at the Jet Propulsion Laboratory, California Institute of Technology, under contract to NASA. We thank J.L. Bishop, D. Takir and an anonymous referee for the helpful reviews, and D. Takir for providing spectra of carbonaceous chondrites plotted in fig.2.
Author Contributions: M.C.D.S., A.R., E.A., G.C., performed data analysis and calibration. M.C. provided optical constants from reflectance spectra. F.T. provided the
surface temperatures. M.C.D.S., S.M., H.Y.M. T.B.M, C.M.P. contributed to the
interpretations of the data. All authors contributed to the discussion of the results and to writing the paper.
Author information: Correspondence and requests for materials should be addressed to M.C.D.S. (mariacristina.desanctis@iaps.inaf.it )
Fig. 1 Average Ceres’ spectrum. a) Average spectrum of Ceres from 0.4 to 5μm. No smoothing has been applied to the spectrum and some instrument artifacts are still present, especially in the thermal range (4.2-4.6μm). The error bars are calculated taking into account a mean absolute deviation of the calibration uncertainties along the 256 samples. Errors bars are not shown for clarity, but are of the same order of those in b. b) Expanded thermal-removed average Ceres spectrum in the 2-4.2 μm range.
Fig.2 Ceres’ spectrum compared with carbonaceous chondrites spectra. Normalized reflectance spectra of CM/CI carbonaceous chondrites measured under dry conditions13 compared with Ceres’ spectrum acquired by VIR. The spectra have been offset for clarity. We thank to D. Takir for the spectra of carbonaceous chondrites.
Fig.3 Spectral fits of the near-infrared reflectance spectrum of Ceres. a) Results of the spectral fitting model (red curve) using brucite, Mg-carbonates, dark component and cronstedtite6; b) the same model (red curve) is shown over an extended spectral range (1-4.2 μm). Gray bars represent regions of the detector affected by the filter junctions. Ceres’ spectrum is in black. The error bars are calculated taking into account a mean absolute deviation of the calibration uncertainties along the 256 samples.
Fig. 4. Spectral fits of the near-infrared reflectance spectrum of Ceres with ammonia- bearing species. a) Results of the spectral fitting model (red curve) using NH4-montmorillonite, antigorite, Mg-carbonates, and dark component; b) results of the spectral fitting model (red curve) using NH4-annite, antigorite, Mg-carbonates, and dark component. Gray bars represent regions of the detector affected by the filter junctions. Ceres’ spectrum is in black. The error bars are calculated taking into account a mean absolute deviation of the calibration uncertainties along the 256 samples.
Methods
Spectral modeling
The Ceres’ surface spectrum reported in the main text is derived as a median of ca. 2500 spectra acquired during the first phase of the mission, under standard viewing geometry (incidence angle 30°, emission angle 0°). The resulting spectrum has been corrected for thermal emission by removing a Planck function produced by the best fit with the measured spectra. We model the Ceres’ average spectrum as formed by an intimate mixture of different end-members, starting from their optical constants. We take advantage of Hapke theory17 which characterizes light scattering in particulate media. The optical constants, when not available from literature, are derived from reflectance spectra as in31. The endmembers treated in this work are listed in Extended Data Table 1. The best fit between Ceres’ spectrum and the models are obtained by means of a least squares optimization algorithm as in 32, where the free parameters are the abundances and grain sizes of each endmember (abundances, grain sizes and χ2 reported in Extended Data Table 2).
Laboratory Spectra of minerals
The carbonaceous chondrite laboratory reflectance spectra used as endmembers presented were measured at the Reflectance Experiment LABoratory (RELAB) at Brown University and obtained through the RELAB online database. Ivuna and Murchison samples were heated
in a vacuum cell at different temperatures for one week33,34. The sample lost a large part of its 3 μm water band by heating at 300°. MAC87300 is a candidate for thermally
-metamorphosed CI/CM/CR meteorites, and was classified as an anomalous C235.
The magnesite (MgCO3) mineral standard is from Brumado Bahia, Brazil. It was measured
using a bi-directional VNIR spectrometer, from 0.3 to 2.5µm under ambient conditions and a Nicolet FTIR spectrometer, in a biconical configuration from 1 to 50 µm in an environment purged of H2O and CO2 for 10–12 h, at Brown University's RELAB36. Spectra of dolomite,
calcite, and siderite were measured at both the University of Winnipeg PSF with an ASD Field Spec Pro HR spectrometer, between 0.35 and 2.5μm and at Brown University with the RELAB facility, between 2.0 and 25μm37.
Reflectance spectra of NH4-montorillonite were measured using a Nicolet 740 Fourier transform infrared (FTIR) spectrometer in a H2O- and CO2-purged environment. For further details see 38. Spectra of NH4-annite, cronstedtite and brucite were obtained through
the RELAB online database.
Spectral fits including water ice and amorphous carbon were modelled using optical constants as derived 39,40,41,42,43.
Spectra of magnetite was measured at both the University of Winnipeg PSF with an ASD Field Spec Pro HR spectrometer, between 0.35 and 2.5μm and at Brown University with the RELAB facility, between 2.0 and 25 μm44.
Laboratory spectra of antigorite have been measured after the samples were heated in a vacuum cell at different temperatures at the RELAB facility45.
Code availability: We have opted not to make the code available because it is based on a well-known light scattering theory as described in the methods section.
31 Carli, C.; Ciarniello, M.; Capaccioni, F.; Serventi, G.; Sgavetti, M. Spectral variability of plagioclase-mafic mixtures (2): Investigation of the optical constant and retrieved mineral abundance dependence on particle size distribution. Icarus, 235, 207-219 (2014) 32 Raponi, A. PhD Thesis, arXiv:1503.08172, 2015
33 Hiroi, T.,Zolensky M. E. & C. M. Pieters, Characterization of unusual
CI/CM/CR meteorites from reflectance spectroscopy, Lunar and Planetary Science Conference, 28, 577, (1997)
34 Hiroi, T., Pieters, C. M.; Zolensky, M. E. & Prinz, M., Reflectance Spectra (UV-3 micrometers) of Heated Ivuna (CI) Meteorite and Newly Identified Thermally Metamorphosed CM Chondrites, Lunar and Planetary Science, 27, 551, (1996a)
35 Hiroi, T. et al., Thermal metamorphism of the C,G,B; and F asteroids seen from
0.7μm, 3 μm, and UV absorption strengths in comparison with carbonaceous chondrites. Meteoritics and Planetary Science, 31, 321-327 (1996b)
36 Bishop, J.L. et al., Coordinated spectral and XRD analyses of magnesite-nontronite-forsterite mixtures and implications for carbonates on Mars. Journal of Geophysical Research: Planets, 118, 635-650 (2013)
37 Cloutis, E. et al., Spectral reflectance properties of carbonates from terrestrial analogue environments: Implications for Mars. Planetary and Space Science, 58, 522-537, (2010) 38 Bishop, J. L., et al.. Detection of soluble and fixed NH 4+ in clay minerals by DTA and IR reflectance spectroscopy: a potential tool for planetary surface exploration. Planetary and Space Science, 50, 11-19, (2002)
39 Zubko, V. G. et al., Optical constants of cosmic carbon analogue grains - I. Simulation of clustering by a modified continuous distribution of ellipsoids. Monthly Notices of the Royal Astronomical Society, 282, 1321–1329, (1996)
40 Mastrapa, R.M. et al. Optical constants of amorphous and crystalline H 2O-ice in the near infrared from 1.1 to 2.6 µm, Icarus, 197, 307 (2008).
41 Mastrapa, R.M. et al, Optical Constants of Amorphous and Crystalline H2O-ice: 2.5-22 µm (4000-455 cm-1) Optical Constants of H
2O-ice, Astrophys. J., 701, 1347 (2009). 42 Clark, R.N. et al, The surface composition of Iapetus: Mapping results from Cassini VIMS, Icarus, 218, 831 (2012).
43 Warren, S.G. Optical constants of ice from the ultraviolet to the microwave, Appl.
Opt., 23, 1206- 1225 (1984).
44 Cloutis, E., et al. Spectral reflectance properties of carbonaceous chondrites: 1. CI chondrites, Icarus, 212, 180-209, (2011).
45 Hiroi, T.K., & Zolensky, M. E. UV-Vis-NIR absorption features of heated phyllosilicates as remote-sensing clues of thermal histories of primitive asteroids, Antartic Met. Res., 12, 108-116, (1999).
EXTENDED DATA
Extended Data Table 2. Title: Details of results obtained using different end-members
Extended Data Table 2. Legend: *Grain size cannot be determined univocally. In the case of very dark materials albedo is weekly linked to the grain size. ** The lack of grain
size information on the measured reflectance spectra used as input prevents to adjust the albedo as a function of the grain size. All the spectra are from the Relab data base and described in the method section.
Extended data Fig. 1. Title: End-members spectra used for spectral fit modelling. Extended data Fig. 1. Legend a) Spectra of minerals showing a prominent absorption at 2.7 m. b) Spectra of minerals showing prominent 3.06-3.1 m band; c) Spectra of carbonates; d) Spectra of dark components and carbonaceous chondrites used in the modelling. All panels show the Ceres spectrum for comparison.
Extended data Fig. 2. Title: Spectral fit of the near-infrared reflectance spectrum of Ceres.
Extended data Fig. 2. Legend: Results of the spectral fitting model (red curves) using a) water ice and amorphous carbon, or b) water ice and magnetite. Ceres’ spectrum is in black. The error bars are calculated taking into account a mean absolute deviation of the calibration uncertainties along the 256 samples.
Extended Data Fig. 3. Title: Spectral fit of the near-infrared reflectance spectrum of Ceres.
Extended Data Fig. 3. Legend: Results of the spectral fitting model (red curves) using a) water ice and Ivuna CI chondrite (heated at 500 oC); b) water ice and MAC 87300 CM chondrite; c) water ice and Murchison CM chondrite (heated at 500 oC); d) water ice, Ivuna CI chondrite (heated at 500 oC), and brucite. Ceres’ spectrum is in black. The error bars are calculated taking into account a mean absolute deviation of the calibration uncertainties along the 256 samples.
Extended Data Fig. 4. Title: Spectral fit of the near-infrared reflectance spectrum of Ceres.
Extended Data Fig. 4. Legend: Results of the spectral fitting model (red curves) using a) tochilinite, cronstedtite, dolomite and magnetite; b) antigorite, cronstedtite, dolomite, magnetite; c) tochilinite, brucite, dolomite and magnetite; d) antigorite, brucite, dolomite and magnetite. Ceres’s spectrum is in black. The error bars are calculated taking into account a mean absolute deviation of the calibration uncertainties along the 256 samples.
Extended Data Fig. 5. Title: Spectral fit of the near-infrared reflectance spectrum of Ceres.
Extended Data Fig. 5. Legend: Results of the spectral fitting model (red curves) using a) NH4-annite, antigorite, magnetite and siderite; b) NH4-annite, antigorite, magnetite and calcite; c) NH4-annite, antigorite, magnetite and magnesite; d) NH4-annite, antigorite, magnetite and dolomite. The black curve is Ceres’ spectrum. The error bars are calculated taking into account a mean absolute deviation of the calibration uncertainties along the 256 samples.