1 | P a g e
Politecnico di Milano
School of Industrial and Information Engineering
Master of Science in Telecommunication Engineering.
Agile Analytics: An exploratory study of technical
complexity management
Supervisor: Prof. Chiara Francalanci Ing. Paolo Ravanelli
Candidate: Agnirudra Sikdar Personal Code:10449950 Academic Year 2014/2015
2 | P a g e
ACKNOWLEDGEMENT
Writing an acknowledgement is one of the very less traits which my Alma Mater, Polimi doesn’t teach, but it makes me indebted to the colossal grandeur of the university till my last breath. I am extremely thankful to all my Professors for having given me this amazing opportunity. For having to bear my curious inquisitive minds. I want to thank the Department di Elettronica, Informazione e Bioingegneria of “POLITECNICO DI MILANO” for giving me such a golden opportunity to help me reach till here.
I would like to express my deepest gratitude to my thesis supervisor “Prof.Chiara Francalanci”, who encouraged me to set sail in this vast ocean of research. Her winds of constant, rays of motivation and sunshine of wisdom gave me ample support to strengthen my sails and redirected me to the unchartered territories. I would also like to thank my thesis co-ordinator Ing. Paolo Ravanelli, whose amazing expertise in my laboratory sessions gave me very strong insights into my area of research. I would like to thank my colleagues, without whom life in Milan would have been pretty hard to come by. It was an amazing experience and I would cherish this friendship and moments till the day’s end.
Last but not the least, I would like to be grateful to my parents, my grandparents, my aunt, uncle and my little cousin sister without their sacrifices, nothing would have been possible. Their constant support, motivation and encouragement acted like a guiding light in tough times.
Thank you everyone for the faith you entrusted on me. I hope I did not fail your expectation. I do want to express my profound gratefulness that I felt for being a part of this extended family and amazing journey.
3 | P a g e
Contents
CHAPTER I. INTRODUCTION ... 5
CHAPTER II. State of the Art ... 7
2.1Definition of Big Data: ... 7
2.2 History of Big Data ... 9
2.3 Big Data Technologies and Techniques ... 10
2.4 Applications of Big Data ... 12
2.5 Introduction to Analytics ... 15
2.5.1 What is Big Data Analytics? ... 15
2.6 Agile Analytics ... 17
2.6.1 What is Agile Analytics? ... 17
2.6.2 How Agile Analytics is linked with the Scope of this Thesis? ... 18
2.6.3 Practices of Agile Analytics ... 19
2.6.4 Agile Methods ... 20
2.7. Conclusion ... 23
CHAPTER III. ANALYTICS & IT’S CASE STUDIES ... 24
3.1 Introduction... 24
3.2 A Detailed Description about Analytical modelling ... 24
3.2.1 Descriptive Vs Prescriptive Modelling ... 25
3.2.2 Look-Alike Modeling ... 26
3.3.1. Case studies of Analytical Data Solutions ... 27
3.3.2. COLOMBUS FOODS: CASE STUDY ... 28
3.3.3. CORONA DIRECT Insurance Company. ... 29
3.3.4. MEDIAMATH: CASE STUDY ... 30
3.3.5. MUELLER INC: Case Study ... 32
3.3.6 .TOP TOY Case Study ... 33
3.3.7. VAASAN FOOD GROUP CASE STUDY ... 34
3.3.8. CASE STUDY by Deloitte ... 35
3.3.9. Case Studies of PriceWater House Cooper (PwC) ... 36
3.3.10. Case study of Thought Works. ... 39
3.4 Conclusion ... 45
CHAPTER IV. CUSTOMER SEGMENTATION, CLUSTERING AND PROPOSED METHODOLOGIES ... 46
4 | P a g e
4.1 What is Segmentation? ... 46
4.2 What is Clustering? ... 46
4.3 Clustering Methods ... 47
4.4 K means Clustering & CHAID Clustering: ... 48
4.4.1 K means Clustering ... 48
4.4.2 CHAID:... 49
4.5 RFM Customer Segmentation Procedure: ... 50
4.6 Definition of RFM Metrics: ... 50
4.7 CASE I: ... 55
4.8 Case II: ... 57
4.9 Issues Related to the following case studies ... 59
4.10 How Agile Can be Helpful? ... 60
4.11. Proposed Methodologies ... 62
4.11.1 Data Acquisition: ... 62
4.11.2 Selection of Tools for Analytics ... 64
4.11.3 Selection of Algorithm ... 67
4.11.4. Different types of modelling approaches ... 70
4.11.5 Outcomes and Benefits from Clustering. ... 73
CHAPTER V. CONCLUSION ... 74
5 | P a g e
List of Figures and Tables
Fig 2.1 Big Data Tag Cloud Fig 2.2 Big Data charts. Fig 2.3 Big Data Landscape
Fig 2.4: Big Data Analytics Pipeline model Fig 2.5. Various influences of Agile Analytics Fig.3.1 Components of Modelling
Fig 3.2 Geolocations of the countries on which the case studies were carried out
Fig 3.3 A Graphical comparison of the different sectors along with the type of modelling followed Fig 4.1 Different Types of Segmentation Approaches
Fig4.2 Example of customer segmentation Fig 4.3 Step 1
Fig 4.4. Step 2 Fig 4.5. Step 3 Fig 4.6. Step 4
Fig 4.7. Flowchart of customer segmentation procedure
Fig 4.8 Tools used by 2015 respondents to O’Reilly 2015 salary survey Fig 4.9 Lavastorm survey of analytics Tools
Fig 4.10. Comparison of different modelling techniques Fig 4.11. Step Process for Cluster Support
Table 2.1 Big Data tools based on batch processing
Table 2.2 Some of the used cases of Big Data are tabulated as follows. Table 3.1 Case Studies of Analytical Data Solutions
Table 3.2 A comparison of case studies of various companies Table 4.1: Variables of interest chosen from the dataset. Table 4.2 Clustering Results
6 | P a g e
CHAPTER I. INTRODUCTION
Internet Technologies have come a long way from the quintessential Ethernet to Wireless Communication devices and much more. Along with this evolution, various technologies have evolved over time to satiate the needs of this immense network. With the advent of smartphones and the technologies associated to the Internet of Things, storing, managing and analyzing data has become a challenge.
Big Data Technologies is the answer to this challenge, and analytics is a part of this ecosystem to undercover the hidden secrets of this pool of Exabyte of data.
Agile Analytics is a great analytical methodology. Its approach is very lightweight and addresses the key concerns of improving efficiency, user experience, and performance while trying to reduce complexity. Agile analytics is emerging, mostly because this analytical techniques that caters to the present fast paced world where most of the companies compete against each other to reduce theirs cons and improve their pros. Agile also focuses on soft and managerial variables making it extremely flexible to work in both technical and non-technical domains. But unfortunately the technical guidelines into the implementation of Agile Analytics are still missing.
This thesis respects on an explanatory study, surveying public case studies to design an agile analytics method providing technical guidelines. Our aim is to fill the void of agile analytics into providing a methodology that can fulfill this objective.
We will be following an explanatory approach, studying multi case analysis to determine the root of the analytical problems and how it can be solved by implementing Agile. We will also try to determine from these cases, how many companies are using Agile and how it is being beneficial to them.
7 | P a g e
CHAPTER II. State of the Art
2.1Definition of Big Data:
Big Data is typically referred to the following types of data:
Traditional Enterprise Data- this includes customer information from Customer Relationship Management (CRM) systems, transactional ERP data, web store transactions, and general data from the ledger.
Machine generated/ Sensor data- this includes Call Detail records (CDR), weblogs, smart meters, manufacturing sensors, trading systems data,
Social Data- this includes customer feedback streams, micro-blogging sites like Twitter and social networks like Facebook.
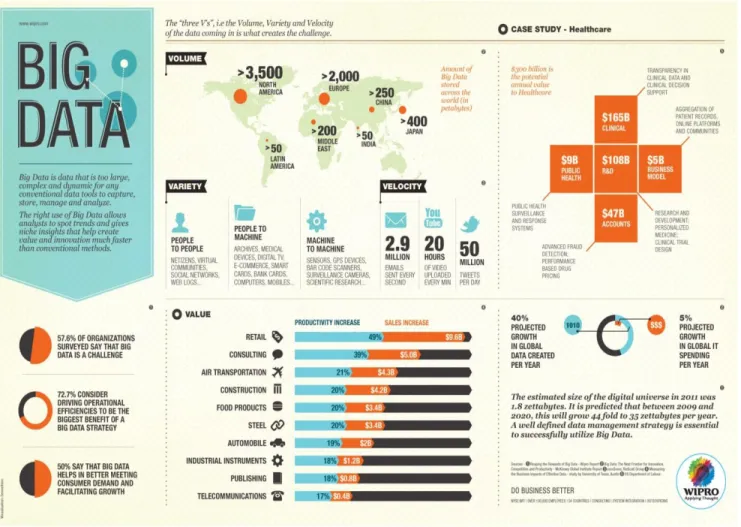
FigThe McKinsey Global Institute has estimated the growth rate of data volume to be 40% per year, and it has been predicted to grow 44 times between 2009 and 2020. Although Volume of data is regarded as the most visible parameter, there are three more characteristics that define big data. [1]
Fig 2.1 Big Data Tag Cloud
8 | P a g e
I. Volume: Data generated by machines have a much larger quantity in comparison
to the non-traditional data.
II. Velocity: Social media data streams-is lesser in terms of quantity when compared
to machine generated data. Produces a large influx of reviews and relationships, valuable to customer relationship management. Twitter for example handles data stream of over 8Tb/s.
III. Variety: Traditional data formats change slowly and tend to be well defined by data schema.
IV. Value: The economic value of various types of data vary significantly.
Fig 2.2 Big Data charts.
9 | P a g e To make the most of these Big Data, companies must transform and evolve their IT Infrastructure in order to handle these large volume, high velocity, mammoth variety sources of data and integrate them with pre-existing enterprise data.
2.2 History of Big Data
More than 90% of the data that is available presently, has been created in the past three years. The term Big Data, was first coined in the year 2005, by Roger Mougalas from O’Reilly Media. Although the usage of Big Data has been lurking way before this period and the need to understand all available data has been much longer.
The 20th Century
The first major data big data project can be traced back to the time when the Social Security Act of USA became a law in the year 1937. The US government had to keep track of 26 million Americans. IBM got the contract for this project and developed punch-card reading machine for this massive bookkeeping project.
The first data processing machine was developed by the British during the World War II to decipher Nazi codes. The device was called Colossus and it searched for patterns in intercepted messages.
1965 the US government decided to build the first data center to store 742 million tax returns and 175 million sets of fingerprints.
The 21st Century
In 2005, Roger Mougalas from O’Reily Media coined the term Big Data, a year after they had defined the term Web 2.0
In 2005 Hadoop was created by Yahoo! It was built on top of Google’s MapReduce.
In 2011, the McKinsey Report on Big Data stated that by 2018, USA alone will face a shortage of 140,000-190,000 data scientist along with 1.5 million data managers.
10 | P a g e In the past years, there has been quite a massive increase of Big Data startups, all trying to tap into this hidden treasure trove of data. The migration to this new form of technology has been slow, but it is sure to pick up the pace and a new era of revolution will begin very soon. [2]
2.3 Big Data Technologies and Techniques
The techniques and technologies involved for the development of data science and BigData, primarily has the purpose of inventing more sophisticated and scientific methods for visualizing, analyzing, managing and exploiting informative knowledge from extremely diversified, distributed and huge datasets.
A paradigm shift is about to begin, as statistical techniques, coupled with mathematics and new data mining tools, along with the help of machine learning algorithms will help data scientists to analyze data and predict outcomes in a much efficient and faster time.
Some of the emerging technologies associated to big data, as stated by Dr. Satwant Kaur, regarded as ,”The First Lady of Emerging Technologies.” According to her the following are regarded as the rising technologies in Big Data:
Schema. MapReduce Hadoop Hive PIG WibiData PLATFORA SkyTree
Current tools focus on three classes, specifically, batch processing tools, interactive analysis tools, and stream processing tools. Most of the batch processing tools are based on Apache Hadoop architecture, like Dryad and Mahout. Google’s Dremel and Apache
11 | P a g e Drill are Big Data platforms based on interactive analysis. Multidisciplinary tools and methods are needed to explore and mine information from Big Data.
Big Data techniques involve quite a lot of disciplines from data mining, machine
learning, neural networks, social network analysis, optimization methods,
visualization approaches, statistics, signal processing and pattern recognition. [3]
Table 2.1 Big Data tools based on batch processing [4]
Name Specified Use Advantage
Apache Hadoop Infrastructure and
platform
High scalability, reliability, completeness
Dryad Infrastructure and
platform
High performance distributed execution engine, good programmability
Apache Mahout Machine learning
algorithms in business
Good maturity
Jaspersoft BI Suite Business intelligence
software Cost-effective, self-service BI at scale Pentaho Business Analytics Business analytics platform
Robustness, scalability, flexibility in knowledge discovery
Skytree Server Machine learning and
advanced analytics
Process massive datasets accurately at high speeds
Tableau Data visualization,
Business analytics
Faster, smarter and ease of use dashboards
Karmasphere Studio and Analyst
Big Data Workspace Collaborative and standards-based unconstrained analytics and self service
Talend Open Studio Data management and
application integration
Easy-to-use, eclipse-based graphical environment
12 | P a g e Fig 2.3 Big Data Landscape
2.4 Applications of Big Data
Big Data of late has experienced a mammoth growth in finding its potentials being applied in various domains. Applications of Big Data have increased significantly and it is slowly getting integrated into various domains of our everyday life. Its emerging potential has given the scope to exploit its features. Some of the noted applications of Big Data are stated as follows
1)
Government uses Big Data analytics to process information that is efficient andbeneficial to them in order to improve cost, productivity and innovation.
2)
Manufacturing industry benefits from the transparency provided by itsinfrastructure. This helps to improve in supply planning and product quality.
3)
Retail. Retail giants like Walmart, Alibaba, Amazon, Ebay are using Big Data toprocess and target their customers using their business intelligence in order to increase their profits.
4)
Information Technology This vast domain has a lot of Big Data used cases from13 | P a g e
5)
Medicine. IBM is using Big Data technologies to predict heard diseases. Analysisof electronic health record can reveal symptoms at an earlier stage. Apache Unstructured Information Management Architecture (UIMA) is used by IBM to extract signs and symptoms of heart failure from the data.
6)
Media. From advertising to marketing industry to social networks, the presence ofbig data can be evidently seen.
7)
Science. One of the most research intensive fields which demands huge dataprocessing tasks in order to process the various kinds of data from Astronomy to Engineering and much more. Google’s DNAStack is one of the applications using Big Data methodologies to study human genomes. [5]
[6]
Company Industry Type Purpose
T-Mobile Communication Optimize
Funnel Conversion
T-Mobile uses various indicators like billings and sentiment analysis to identify customers to offer premium services.
Master Card Finance Behavioral
Analytics
Master Card uses Behavioral Analytics to analyze their 1.8billion customer base.
Walmart Retail Customer
Segmentation
Walmart combines social data, public data and internal data to monitor the reviews of customers and their friends. They use this data to target messages about specific products and also offer special discounts
14 | P a g e Morgan
Stanley
Finance Predictive Support
Morgan Stanley uses real time data analytics to identify problems and prioritize which issues should be addressed. Etihad
Airways
Travel Market Basket Analysis & Price
Optimization
Etihad uses big data to determine which destinations should be added to maximize revenue.
Amazon Online Retail Predict
Security Threats
Amazon has over 1.5 billion items in its catalogue. It uses cloud system S3, to predict which items are most likely to be stolen, in order to better secure its warehouses.
Discovery Health
Insurance Fraud Detection
Discovery Health uses big data analytics to identify fraudulent claims.
Shell Oil Industry
Specific
Shell uses sensor data to map its oil and gas wells to increase its output and improve the efficiency in its operations.
15 | P a g e
2.5 Introduction to Analytics
Analytics is defined as the discovery and communication of meaningful patterns in data. It is extremely valuable in areas rich with documented information. Analytics relies on documented simultaneous application of computer programming, operations research to statistics. Analytics is a multidimensional discipline. The insights obtained from data are used for recommending actions or to assist in decision making. It is not very much concerned with individual analysis steps, but with entire methodology. There is an increasing use of the term advanced analytics, mostly used to describe the technical aspects of analytics. For example, advanced analytics is used in machine learning technique like neural networks to perform predictive modelling. [7]
2.5.1 What is Big Data Analytics?
Big data analytics is the process of examining large data sets containing heterogeneous data to uncover hidden patterns, unknown correlations, customer preferences, market trends and other useful business information. The analytical results can lead to improved efficiency, competitive advantages over rival organizations, better customer services and many other business benefits.
The primary goal of big data analytics is to help companies make more informed business decisions by helping data scientists, predictive modelers and other analytics professionals to analyze data, or other untapped data by conventional business intelligence programs. Big Data can be analyzed with various software tools used mostly as a part of advanced analytics disciplines in data mining, text analytics, statistical analytics, etc. Mainstream business intelligence software and data visualization tools can also play a role in the analysis process.
The business cases for leveraging Big Data are compelling. For example, Netflix mined its subscribers’ data to put the best recommendation upfront the subscriber. This made their recommendation model a big hit and allowed them to reap the benefits of Big Data analytics. [8]
16 | P a g e Enterprises are increasingly looking to find actionable insights into their data. With the right set of tools, skills and expertise, enterprises can boost sales, increase efficiency, risk management and even customer service by the potentiality of Big Data Analytics.
17 | P a g e
2.6 Agile Analytics
2.6.1 What is Agile Analytics?
Agile Analytics includes practices for monitoring, management and project planning; for effective cooperation between stakeholders and business customers and also ensuring technical quality by the delivery team. [9]
Agile is a very specific word, reserved to describe a kind of development style. It means something very explicit. Sadly, it is often misused and misunderstood as a name for processes that are ad-hoc, lacking in discipline and slipshod. Agile depends more on discipline and consistency; although it’s not a tough and a formal process despite several methodologists trying to code it with various approaches. It falls rather between flexibility and structuring. Agile is built on a set of meaningful values and principles, and requires high set of degree of discipline in order for it work properly.
Bringing agility into big data analytics has been a challenge to many talented data scientists and engineers. The motives are similar to the effort in adopting agile application software development: mostly in team dynamics and organizational culture. In case of agile analytics, often stakeholders proceed beyond IT solutions to include marketing and other domains.
Agile analytics is all about failing fast. This can be explained in terms of scientific context, where we first state a hypothesis and then seek to disapprove it using quantitative analysis of real data in rapid cycles. Agile focuses not on the data itself but on the insight and action that can ultimately be drawn from nimble business intelligence systems. Rather than beginning with investment and platform building, Agile analytics starts with learning and testing, so that companies can build their models and strategies based on solid answers to their most crucial business questions. The final solution is actionable insight and maximized value to the business. [10]
18 | P a g e Fig 2.5. Various influences of Agile Analytics
2.6.2 How Agile Analytics is linked with the Scope of this
Thesis?
The objective of this thesis is understand the how Agile Analytics can help to improve the efficiency in Big Data Analytics. To specify it more, the main purpose is to find the complexities in conventional Big Data analytic techniques and implementing Agile Methodologies to address these issues. The reason for which Agile is considered for the scope of this thesis, is because of its high flexibility to address the problems and restructure its modules in order to resolve them.
Data complexities arises from taking up various approaches and choice of selection of methodologies. With Agile, we will try to understand its flexibility and try to find out if taking
19 | P a g e up this approach will improve the efficiency of the system. We will try to concentrate on Customer segmentation and clustering cases and will try to see what kind of complexities are involved. Following this, we will try to determine this solve the problems using Agile approach.
2.6.3 Practices of Agile Analytics
Adapt to Changing ConditionsThe core purpose of big data is to find key insights upon which an organization can pivot. In this way, big data by definition demands agility. Listen to what users, tests and business conditions are telling you, and work change into subsequent iterations.
Automate as Many Processes as Possible
The greatest manpower should be saved for developing new features and collaborating across organizational and development teams. As such, it's important to automate as many regular processes as possible, from testing to administrative tasks so that developers can focus intensely on an iteration's set goals.
Foster Self-Organized Teams
Hire talented, motivated individuals who can set their own goals for each iteration and function as effective self-managers. Then, trust them to do the job at hand, self-monitoring and adapting as they go.
Adapt Agile Methods to Individual Projects and Teams
While Agile analytics has many guidelines, it is a style, not a process. More traditional tactics aren't antithetical to Agile if they're effective in achieving iterative goals. Choose the tactics that work best for each project and team rather than adhering to static rules.
20 | P a g e Agile systems development requires just as much discipline and rigor as the traditional waterfall method in order to stay on track. However, rigor should be applied not to adhering to rigid systems and static goals, but to constantly re-evaluating the effectiveness of the methods and styles at hand.
Constantly Learn
Keep up-to-date with the best data warehousing and business intelligence practices and implement them fluidly into each iterative phase. This will substantially increase the development team's agility and keep the organization ahead of its competitors
2.6.4 Agile Methods [11]
Methods/Frameworks Description References
Adaptive software development (ASD)
It grew from Rapid Application Development. Follow the
principle that it’s normal to adapt continuously the process to the work at hand. “MESSY, EXCITING, AND ANXIETY-RIDDEN: ADAPTIVE SOFTWARE DEVELOPMENT” by Jim Highsmith
Agile modeling It’s a practice based
methodology to perform effective modelling and documentation of software based platform. http://www.agilemo deling.com/ Agile Unified Process (AUP)
It’s a simplified version of Rational Unified Process describing an easy way to
21 | P a g e develop business application
software Business analyst designer
method (BADM)
It’s a method for designing business change where there is significant change in IT system.
Heap,
Tony. "Business Analyst Designer Method".http://www .its-all-design.com/.
Crystal Clear Methods Methodology which prioritized
for project safety. Describes the methodology of the lightest, and most habitable kind that will produce good results.
Alistair Cockburn
Disciplined agile delivery Process decision framework that
enables simplified process decisions around incremental and iterative solution delivery.
Scott Ambler
Dynamic systems development method (DSDM)
DSDM is an iterative and incremental approach that follows Agile Development principles, including continuous user/customer involvement. Keith Richards, Agile project management: running PRINCE2 projects with DSDM Atern. OGC - Office of Government Commerce. The Stationery Office, 31 Jul. 2007
22 | P a g e
Extreme programming (XP) It’s a software development
methodology with the intention to improve software quality and responsiveness based on the change of customer requirements, Kent Beck Feature-driven development (FDD) FDD blends a number of industry recognized practices into a cohesive whole. It is also an Agile Method of Developing software and is lightweight in nature.
Jeff De Luca
Lean software development
It is a translation of lean IT principles and lean
manufacturing. More popular with startups who want to test the market.
Mary Poppendieck and Tom
Poppendieck
Kanban (development) This method focuses on
managing knowledge work and emphasizing on just-in-delivery.
David Anderson
Scrum Scrum defines a flexible, holistic
product development strategy where a development team works as a unit to reach a common goal.
Hirotaka
Takeuchi and Ikujir o Nonaka in the New Product Development Game.
Scrumban This methodology is more of a
hybrid of Scrum and Kanban.
Corey Ladas
23 | P a g e
2.7. Conclusion
We can come to conclusion that Big Data is a pretty important technology with immense potential. The need for proper analytics to uncover this hidden data field is extremely important. The key to this Pandora’s Box lies not in our hands but in the approach we follow to open it.
For Agile Analytics the managerial variables are clear while the technical ones are not yet addressed. But they should be, since the agile methodology typically involves both the components we will try to study about it in the next chapters with the primarily concern of trying to determine the technicalities which Agile Analytics can address and try to identify the different complexity problems that arises from reviewing of multi case studies and trying to propose methods by which we can improve the efficiency and solve these problems.
24 | P a g e
CHAPTER III. ANALYTICS & IT’S CASE
STUDIES
3.1 Introduction
Analytics is an integral part of the Big Data ecosystem, and it demands proper algorithms and modelling approaches to solve different issues. Efficiency at solving the problems and the importance of using the right set of approaches and tools determines the final outcome.
In this chapter we will try to focus on reviewing multiple case studies and would try to figure out the type of modelling approach they used. Also we will try to investigate the presence of Agile Methodology in all the cases.
3.2 A Detailed Description about Analytical modelling
[12] Why do we need Analytics in Big Data?The production of data from conventional enterprise and non-enterprise sources are revealing innovative new channels of utilization from the confluence of various factors.
i) Explosion of a new source of raw and unstructured data.
ii) New prescriptive analytic technologies using very lower price-points compute-intensive resources.
iii) Innovation opportunities are opening up from this vast treasure trove of data which is yet to be mined for its benefits.
To design a Big Data system, with the correct recommendation technology, lots of considerations are needed to segment this vast voluminous data of varied structure Only
25 | P a g e after this , proper action can be taken for every individual business scenario.
Fig.3.1 Components of Modelling
3.2.1 Descriptive Vs Prescriptive Modelling
Concepts of ‘Descriptive’ models versus ‘Predictive’ models are being used to design variables that define a client, systematically adequate to provide better predictive powers over the populations they represent. Descriptive analytics looks at past performance and comprehends that performance by mining past information to look for the motives behind previous success or failure. Nearly all structured reporting such as sales, marketing, operations, and finance, uses this kind of post-mortem analysis. Classical descriptive approaches (usually seen in data warehousing systems) like this are influential for describing the population but are limited in their predictive abilities with respect to the same population. Predictive models select major characteristics differently- i.e. while we may know a lot about our customers, we may not be able to precisely estimate what they will do next. In these instances applications of predictive models might help construct a list of clients for a study that will be more accurately target its lift ratio when applied to the real population.
Three elementary foundations of predictive analytics are:
26 | P a g e Prescriptive models though, take advantage of the data of descriptive models and the premise of predictive models and try to answer, not only what the client will do next, but why they will do so. This kind of cross analysis opens up investigations into questions not expected earlier in the design cycle, but need to be asked as the severe altering real-time requirements of the dynamic customer system.
3.2.2 Look-Alike Modeling
This is a specialized application of predictive modeling. It forces the sampling of a population such that the so-called ‘salient’ variables are selected as a means to represent the full population. Salient variables are those attributes of a customer that allows for accurate extrapolation with statistical rigor. Once a ‘good’ or behaviorally-predictable customer is identified, the objective is to find others like him. This is the basis of ‘Look-alike’ modeling where the target-marketed group (e.g. for a marketing campaign, product offering etc.) is an expanded list of members whose profiles look like the predictable member of the population. The considerations behind such modeling, is relaxing the variables to allow for a greater number of members into the ‘Look-Alike’ group without compromising the group’s salient characteristics. A diverse set of techniques/disciplines that can be used include:
o Real-time Decision-Making o Tree Map Analysis
o Cluster Analysis o Variable Selection o Multivariate Testing
27 | P a g e
3.3.1. Case studies of Analytical Data Solutions [13]
Company: Analytical Data Solutions are a data management consultancy company focused at delivering analytically efficient Customer-Market Intelligence solutions.
Location: London, United Kingdom
CLIENT BUSINESS ISSUE SOLUTION IMPACT ON BUSINESS CUSTOMER INTELLIGENCE US based high end luxury retailer of apparels. 1) Identifying most valuable customers within existing customers, on basis of their buying patterns. 2) Assess the profiles of such potential youth customers. Customer Segmentation based on identification of demographic and behavioral sweet spot and relationship quotient.
The case study helped to create not only the Best Customer Profile and characteristics, but also helped the retailer to create effective CRM program. Identifying Most Valuable Customer. Global Marketing Organization of leading personal Computer manufacturers PC manufacturer wanted to use market sentiments and buzzwords in social media during early launch days to predict growth of products Data crawled from various websites like Facebook, Twitter, Amazon, Google, to create predictive indices around the market The solution helped them to have initial insights on assessing performance of a product and react quickly using potential corrective actions. Prediction of New Product Sales Trajectory using Social Buzz and Media Sentiments.
28 | P a g e sentiments to determine a potential trajectory for the sales of the product.
Table 3.1 Case Studies of Analytical Data Solutions
3.3.2. COLOMBUS FOODS: CASE STUDY [14]
Company: Colombus Salame (Colombus Sausage Company, Colombus Foods, Inc) is a food processing company based in America who specializes in Salami and other sorts of processed meats. It was founded in San Francisco in 1917.
Location: Hayward, California
Business Issue: Colombus food was finding it pretty difficult to manage its procurement, inventory management, logistics and manufacturing. The only solution to solve this problem was to acquire timely information to in order to make good decisions. They needed quick information in order to perform effective decisions. Operational data was expected to be extracted from various systems. It would take upto two days to create a report to compare current inventory levels and production schedules against customer orders, and by the time information will be ready, it would be outdated.
OBJECTIVE: Improve response on Operational Services during attending client demands.
Approach: IBM TM1 Cognos had been used to analyze financial data and support the forecasting, planning and budgeting processes. Applied Analytix team was outsourced to solve the problem of Colombus Foods, and they used IBM Cognos TM1 to address and solve the business issues of Colombus Foods.
29 | P a g e INSTRUMENTED: Data from various business sectors like business, sales, procurement, manufacturing, inventory and logistics. These are collected and merged in IBM Cognos TM1.
INTERCONNECTED: Instant real time reports can be generated on stock levels, production schedules, order status, helping decision makers to improve their efficiency as per client demands.
INTELLIGENT: Forecasting the demands, preparing for delivery and production, and logistics to on-time delivery, order fulfillment and customer satisfaction.
Acceding to one of the employees of Colombus Foods, Dave Siegfried, “ Cognos TM1 helps us to avoid inventory shortfalls by forecasting customer demand based on historical analysis of buying patterns and integrating information from out sales teams to predict how much each customer is likely to order in the coming months”
CONCLUSION: With a better understanding of demand volumes and production scheduling, the company was able to improve and optimize its inventory management, this reduced the risk of manufacturing surplus products which needed to be stored for a longer periods and before getting scrapped.
3.3.3. CORONA DIRECT Insurance Company. [15]
Company: Corona Direct is considered as the second largest direct insurance company in Belgium. It has over 150 employees and generates revenues of $69.3 million in 2009. It’s a subsidiary of the Belgian-French banking and Insurance company called DEXIA. Corona Direct provides customers with products such as medical, fire, property and car insurance.
Location: Belgium
Business Issue: To sustain acquiring new customers in successive years from the revenues generated in the previous years to fund for the marketing campaigns. In the
30 | P a g e past the cost of acquiring new customers exceeded by 50% of its revenues making Corona Direct’s strategy at risk.
Solution: Corona Direct resorted to IBM SPSS predictive analytics software. The software helps them to efficiently create, optimize and execute their outbound marketing campaigns. Also using the predictive analytics, they could identify groups with the highest potential to respond to the campaigns. Along with this the company was able to perform profit-cost analysis-balancing growth targets against profit margins. Using all these points, Corona Direct was able to optimize its potential for growth.
Results: First year revenues covered campaign costs, enabling Corona Direct to adhere to its growth strategy.
1) Campaign costs reduced by 30%.
2) Long term customer profitability increased by 20%. 3) Product sales increased significantly.
4) Payback for the cost of implementation was achieved within six months.
The success of using IBM SPSS analytics has motivated Corona Direct to use predictive analytics to increase cross-selling within its call centers, thus creating profitable retention campaigns focusing on high-value customers. Also they plan to use past data to analyze and detect fraudulent claims, reduce false claim costs and eventually increase profits.
3.3.4. MEDIAMATH: CASE STUDY [16]
Company: Mediamath, first and largest, demand side platform (DSP) enabling company that enables advertisers to access and tap into 13 billion ad impressions daily. Software as a Service (SaaS) is provided in terms of automated media trading platform application, involving powerful analytical tools and simple workflow. They are the only Network Advertising Initiative (NAI) compliant DSP.
Business Challenges: Need best data analysts to enable the largest ad buyers to use all the information needed from every aspect for their ad campaigns. Requirement to select and deploy new solution within 3 months with minimal internal resources.
31 | P a g e Approach: MediaMath used and outgrew MySQL. They tried with Oracle Standard Edition with 5TB of data and yet couldn’t sustain the demand. According to one of the employees, Tom Craig, VP of Information Strategy at MediaMath, the code was fast but was difficult to maintain. They wanted something which was deployable very quickly as well as scalable to meet the demands of the business. From considering a set of software like Aster Data, Hadoop, Infobright, Oracle, Vertica, and Teradata, they finally decided to stick to Netezza.
This was because Netezza offered best return of investment with its ease of use. (The potential to use Agile Methodology was pretty much present so that the scalability in the future was absolutely prominent). Netezza provided multitude of rows and dimensions for analyzing the data.
Applications: MathClarity ™ interface was used for analytic insights, customer
segmentation and audience targeting. . Some of the features of Netezza are mentioned as follows:
Purchase funnel Analysis. Internal/Financial reporting.
Dynamic interval reach and frequency.
Fast decision making algorithms can be implemented. Near real time reporting and attribution
Deep site analysis and classification.
Conclusion: With Netezza which powers the algorithmic trading, MediaMath was symbiotic enough to listen and act on more of these opportunities for improving the campaign performance. The two delivers the impression of real time level bidding. It sees and knows where every impression originated and thus helps the data scientists to create effective machine learning algorithms coupled with the best performance in this DSP domain.
32 | P a g e
3.3.5. MUELLER INC: Case Study [17]
Company: Mueller Inc, founded in 1930s is a leading retailer and manufacturer of pre-engineering metal roofing and metal building products. Their customer base is mostly in the southwestern United States from Texas, Louisiana and Okhlahoma.
Location: Ballinger, Texas, United States.
Objective: Metal Construction manufacturer Mueller wanted to shift their business strategy from manufacturing to retail led manufacturing. They wanted to adopt a more retail oriented business model.
Approach: Mueller Inc worked with IBM to deploy their analytics software, IBM® Cognos® Business Intelligence. IBM Cognos Business Intelligence gave a clear picture of the transformation path against a common set of Key Performance Indicators [KPIs], along with Cognos Metric Studio helped to understand the analytics to improve the performance analytics part. Using Metric Studio in Cognos Business Intelligence, an idea about the team’s strategy performance was clearly visible.
The new Cognos gave the opportunity to customize interactive dashboard thus helping the analysts to have better insights into the business. Cognos TM1 gave a better understanding of the retail business, from ground zero. It helped Mueller Inc to understand what they needed to change in their immediate future to meet the growth targets. (This shows signs of implementing Agile Implementation) .
Presently the company plans to use IBM SPSS ® to tap into the Big Data Domain to mine enormous volumes of transactional data, which might reveal patterns and trends to help them predict the growth as well as expose unseen problems in the operations.
According to Mark Lack, in the past they needed to update a cube with new data by rebuilding it. With Dynamic Cube in Cognos Business Intelligence, they could build the cubes incrementally, so with each update only requires to lad new and changed data instead of rebuilding from the scratch. (Again signs of Agile Implementation)
CONCLUSION: The new IBM analytics software helped Mueller not only to adopt and be successful in their business model but also helped them to become a truly information
33 | P a g e driven enterprise. Being a Small Medium Enterprise, but working smarter helped them to gain amazing insights for implementing their business strategies.
3.3.6 .TOP TOY Case Study [18]
Company: Top-Toy is the largest toy business in the Northern European market. They have an annual turnover of €500 million and 4,000 employees, TOP-TOY operates approximately 300 retail stores under its BR brand in the Scandinavian countries, as well as the licensed Toys “R”.
Location: Tune, Denmark
Business Issue: Top-Toy wanted that its warehouses would be stocked with the most popular toys but the long lead times made it difficult to efficiently manage the inventory. Since they ship products from China, it is required to plan about stocking the inventory months ahead of the busiest seasons. ERP was used, along with basic Spreadsheet applications, which failed to provide deep insights about filling up the stocks and addressing this business issue. The main objective was to predict and overcome the demand forecasting challenges.
Solution: To gain better and deeper insights into the predictability, Top-Toy decided to go for IBM Cognos Business Intelligence. Shifting to IBM® Cognos ® Business Intelligence helped the company to improve its inventory forecasting and made them align their orders on basis of their customer demands, several months in advance. (Implementation of customer segmentation on basis of buying-selling patterns)
With IBM Cognos , Top-Toy was able to create a data warehouse for its historical ERP, and connected Cognos to its forecasting-demand systems.
If Cognos showed that a product is a big hit with customers, the various space management teams might even provide various promotional benefits on it, thus improving the sales.
34 | P a g e Conclusion: IBM Cognos Business Intelligence helped to resolve their business issue of meeting the customer demands and forecasting the demands for the inventory in the warehouses.
3.3.7. VAASAN FOOD GROUP CASE STUDY [19]
Company: VAASAN Group is one of the leading bakery operators in Northern Europe. Their business involves producing fresh bakery goods, crisp breads for sale in retail chains, restaurants and hotels as well various bake-off products. In 2011, VAASAN Group had employed 2,730 people, and achieved net sales of approximately €408 million. Location: Helsinki, Finland.
Business Issue: VAASAN Group wanted to deliver the right products to the right customers in the proper time across the Nordic region. This required the company to predict and be dynamic to the rapid customer demands, adjust production and delivery schedules accordingly. VAASAN faced a business risk due to not having a standardized customer demand to predict the fluctuations.
Approach: VAASAN OY decided to create a solution for its demand planning that would analyze data from multiple sources after combining them, including the ERP system of the company. VAASAN Oy outsourced their business problem to Invenco Oy to help them build a solution. It involved sophisticated IBM Cognos Data Manager. Business Benefits were seen to rise by 30% in Sweden. (They tapped into rapid and effective response to market changes and was able to react quickly to the demands. Agile Approach can be seen to have been used here)
VAASAN team worked closely with their customers to gain insights into the location, size, sales history and used these variables to model their demand forecasting solution into their existing demand planning model.
The solutions generated gave VAASAN ample lead time to plan ahead and adjust the manufacturing schedule at its bakeries. This significantly increased their production volume. According to their Development Director, Nina Tuomikangas, if the market
35 | P a g e situation changes, the modelled solution gives the production team an excellent understanding of changing the demand patters.
Conclusion : With the use of IBM Business Analytics solution, and implementing predictable models (with incorporating Agile Approach ), the company was able to solve their business issue of meeting the supplying demands on time.
3.3.8. CASE STUDY by Deloitte [20]
Company: Deloitte is a British Multinational company offering services in audit, tax, consulting, enterprise risk and financial advisory. With over 200,000 employees and a net revenue worth US$ 35.2 billion (2015), it is ranked as one of the best management consulting companies in the world.
Location: New York, USA.
Client: A major Telecom company.
Business Issue: The Company was struggling to process data of its customers for future analytical purpose. Previous attempts to migrate into Big Data technologies had failed. The company wanted a scalable big data and advanced analytics system in an efficient, cost effective way. The main challenge was to gain the fastest access into the data and deriving insights from it. :
Approach: The organization instead of migrating all of their systems into Big Data technologies at the same time, decided to select some Pilot projects and try out the potentiality of the system.
1) Leadership Alignment: The goal of the client was to align key stakeholders without getting caught up in details.
2) Selection of Big Data Analytics Pilot Projects: Deloitte helped to identify a mix of used business cases to demonstrate the big data insights and how it can improve the reduce costs.
36 | P a g e 3) Design and Execution: The teams adopted an Agile implementation Process, to meet and ensure the solutions that were being developed met the business needs.
Results: The team effectively implemented HADOOP as a solution. This enabled the team to easily process, analyze and even modify their data to access relevant information.
Conclusion: The pilot project were the first of a kind in the company. Now they are trying to develop advanced analytics program to help individuals much faster in order to take smarter business decisions.
3.3.9. Case Studies of PriceWater House Cooper (PwC) [21]
Company: PriceWater House Cooper is a multinational professional services company. Being one of the largest four auditors in the worlds. It has also been ranked as the most prestigious accounting firm in the world. Spanning over 157 countries, with more than 208,100 employees, PwC has total revenues worth $35.4 billion (2015).Location: London, United Kingdom
CASE I
Client: A large software company with tens of millions of users.
Business Issue: The client wanted to improve its products and customers’ online
experience. The company earlier depended on 3rd party organization for various key data
requirements, which were changing very fast .This unpredictable nature was the fundamental problem to modelling a predictable solution for keeping the products up-to-date and bringing important software upup-to-dates on time.
Client wanted to balance their data storage and processing using cloud-based services since, it would reduce cost on infrastructure maintenance. (Being a seasonal company, most of their infrastructure was kept unused throughout the year).
Client’s online product generated vast amount of data about the interactions with customers. They wanted to know ways to mine important information from these vast treasure trove of data to improve their product.
37 | P a g e Client sought the help of PwC regarding the feasibility of migrating to Big Data Technologies and gaining benefits from it.
Approach: PwC realized after assessing from Pilot stage project that the client’s data
architecture model would be necessary for modifications, as well as they needed a proper technology roadmap. PwC also recommended using open-source tools and techniques, which would add flexibility, resulting in shorter software development cycles and faster release speeds to the market (Agile Approach has been used here).
Conclusion: A 30% improvement in the speed-market. Improved technology infrastructure during peak hours. Lower costs in retiring of software licenses, and an improved user experience helped benefit a lot.
CASE II [22]
CLIENT: Canada’s one of the leading pension firm.
Business Issue: to plan and support their information management system with the 5 year road path in consideration. The company was interested in making its data analysis and business intelligence more efficient and robust.
They identified 2 functional areas:-
1) Employee Productivity
2) Monthly members and Pensioner’s report.
Company wanted to be able to explore and analyze data contained across systems, and view data on a time series basis, in order to see how metrics changed over time.
Solution:
PwC proposed Agile analytics to help the company address key issues related to the productivity measurement & monthly reporting. PwC provided the clients with working dashboards that addressed many of their immediate concerns.
38 | P a g e b) Establishing common toolset for data preparation and data visualization tools shared across business.
c) Embedding technical data analysts within business units.
Conclusion: The client was convinced with the results and decided to migrate to Agile Analytics Methodologies. They also recognized the factors needed to address in order to implement a proper sustainable agile analytics function within their company. The agile methodologies gave the client. Using Agile enabled a low risk of, “Fast Fail,” approach to develop solutions. It also reduced financial risks associated with developing systems, allowed stakeholders to provide their active feedbacks and implementing prototypes instead of mockups. In short the client stuck jackpot with this. They accomplished as much in 3 weeks as they would have normally accomplished in 3 years.
39 | P a g e
3.3.10. Case study of Thought Works. [23]
Company: ThoughtWorks is a global technology company who specializes in providing software design and delivery as well as pioneering tools and consulting services. They are closely linked with the usage of agile software development and has contributed to a vast array of open source products.
Client: GAP
Business Issue: GAP wanted to improve their databases systems. They preferred migrating to Big Data Technologies, like MongoDB to help them resolve their analytics and data warehouse problems. They sought the help of ThoughtWorks to consult them in this whole process of changing into Big Data Systems.
Approach: This case had been taken up by Ryan Murray of ThoughtWorks. It showcased the effects of enabling of agile engineering with MongoDB for fast and efficient productivity and better business intelligence.
Keynotes of the case:
In relational databases, for instance, if we are making a database based on purchase order, we split this into various sub-lists (We tend to do this to normalize databases)
Developer tends to solve on how to design the relational database instead out with relational database. This tends to destroy the flow. (Impedance mismatch to be avoided while creating purchase orders for GAP, using MongoDB)
Introduction of micro service. Service dedicated to one business capability. Developers will be more focused into working on these services.
Flexible Schemas: 1) Data comes in different shapes and formats. We should be able to store them transparently in the databases. This is Extreme Enabler, for Agile Development. [Design-Implement-Release]. Using Agile Methodologies, we continue to evolve the system with every release.
Using MongoDB, setting up the databases on basis of business requirements was easy. MongoDB accepts whatever type of data and dataset you throw at it. Once the Client
40 | P a g e (GAP Apparels in this case), visualizes it, gives their feedback, we incorporated it for the future releases with every iteration.
Flat data structure of BSON/JSON used in MongoDB is also easy to be understood by non-technical business consultants.
ThoughtWorks consultants had set up a 5 node cluster. It had 3 nodes for high availability and 2 disaster recovery nodes. These were all setup in a separate data center. Also they were able to setup a delayed replica set node. (If somebody fat fingered data, there was a real-time backup to retrieve and solve the mistake)
Final Output was: System in production was delivered in 25 months using MongoDB and implementing Agile Engineering methodologies. Constant scheme of migration wasn’t needed with Mongo DB and Agile Engineering.
Conclusion: ThoughtWorks was successfully able to implement the big data system using Mongo DB and Agile Analytics. GAP experienced high efficiency in its data storage, data processing as well as its analytics field of its business. With the inclusion of Agile Methodology, the relationship with the client improved since the feedbacks were very quickly implemented with every iteration. ThoughtWorks was able to prove the power of adapting to this new technology.
41 | P a g e
Company Client Business Issue Approach Technologies
Used Types of Analytics Industry Agile Analytical Data Solutions US Based Luxury Retailer
Identifying the most valuable customer. Customer Segmentation. (Recency, Frequency, Monetary) --- Predictive, Prescriptive. Retail no Global Marketing Organization of PC manufacturers Using sentiments and buzzwords in social media to predict growth of products
Data Crawling from social networking websites.
---- Predictive Electronics Signs were present. IBM Colombus Foods Improve response on Operational Services during attending client demands. Instrumented, interconnected and intelligent approach was used IBM Cognos TM1 Descriptive, Predictive, Prescriptive Food No
Corona Direct To acquire new customers using successful marketing campaigns. Using predictive analytics to identify the group with the highest potential to respond to campaigns IBM SPSS Predictive Analytics software. Predictive, Prescriptive Financial Services (Insurance) No
Mediamath Needed data analysts to enable the largest ad buyers for their ad campaigns.
Customer Segmentation, Audience Targeting, Deep Site Analysis,
Netezza, MathClarity ™ Predictive, Prescriptive, Descriptive Advertisement Yes
Mueller Inc shift business strategy from manufacturing to retail led manufacturing & adopt a more retail oriented business model
Audience Targeting IBM® Cognos® Business Intelligence. IBM SPSS ®
Predictive, Prescriptive
Manufacturing Signs were present.
Top Toy Customer demand forecasting. Implementation of customer segmentation on basis of selling patterns
42 | P a g e
Invenco Oy VAASAN VAASAN faced a
business risk due to not having a standardized customer demand to predict the
fluctuations.
Modelled the data forecasting system using variables like location, size, history, sales.
IBM® Cognos® Predictive, Prescriptive.
Food Yes
Deloitte A major
Telecom company
Company was trying to efficiently migrate to Big Data Technologies.
Leadership Alignment, Selection of Big Data Analytics Pilot Project, Design & Execution
HADOOP Prescriptive Telecommunicati ons Yes PriceWater House Cooper A large software company Client wanted to balance i) Data Storage and migrate to cloud based services. Ii) Client wanted to use advanced analytics to mine information from the vast data their customers generated.
Change in Data Architecture model, recommended using open source tools and techniques which would add flexibility Open source tools Predictive, Prescriptive Information Technology Yes Canada’s leading pension firm
The company was interested in making its data analysis and business intelligence more efficient and robust
PwC proposed Agile analytics to help the company address key issues .they gave the clients with working dashboards that addressed many of their immediate concerns.
--- Prescriptive Finance Yes
ThoughtWorks GAP GAP wanted to
migrate to Big Data Technologies to address various business issues much efficiently and effectively.
ThoughtWorks proposed to migrate and implement Mongo DB as the best solution for Big Data systems.
Mongo DB Predictive, Prescriptive
Apparel, Retail Yes
43 | P a g e
Fig 3.2 Geolocations of the countries on which the case studies were carried out
This is the heat map of the World. The highlighted portions denotes the areas where the case studies have been performed
.
44 | P a g e Fig 3.3 A Graphical comparison of the different sectors along with the type of modelling followed
The graph here represents a normalized comparison of the various industrial domains versus the types of analytics they are using in their business intelligence. To understand the context of the usage, I have taken into consideration (1 if present, 0 if absent for the cases of Prescriptive, Predictive & Descriptive, and for situations where Agile was used, have taken 1, and 0.5 if it was used in more than one case, and 0 if not used in the other.)
45 | P a g e
3.4 Conclusion
From the above cases, and also from the graph, we can see that the case study involving the domain Advertisement, has all the factors present needed for the research purpose of this thesis. Most of the cases have involved predictive and prescriptive approach, but a very less number of cases involved descriptive.
Also we saw that Agile Methodological approach wasn’t implemented by all the companies and this makes us realize that companies do not want to explore this unchartered territory. The ones who explored and exploited this approach did gain substantially in their final outcome after modelling. Also we can clearly see that the modelling approaches depends on the domain of the industry.
Without further ado, we will try to focus into Customer Segmentation and Clustering, and how the processes of Descriptive, Predictive and Prescriptive are involved in this scenario incorporating Agile Methodologies in the succeeding chapters.
46 | P a g e
CHAPTER IV. CUSTOMER SEGMENTATION,
CLUSTERING AND PROPOSED
METHODOLOGIES
4.1 What is Segmentation?
[24] The term “Market Segmentation” was first brought up by Wendell (1956), an
American Market Researcher. This concept was further promoted by various companies as well as many scholars. Presently a large number of research study is being done on this field of market segmentation to provide deeper insights into its potentials.
Market Segmentation has numerous advantages over mass marketing. It frequently provides the opportunity to expand a market by better satisfying the specific needs or wishes of particular consumers (MacQueen et al., 1967). Also, it increases the profitability or effectiveness of the organization to the extent that the economic benefits gained by providing to the consumers exceeds the cost of the segmentation process. Kotler believed that the company can create a more fine-tuned product or service offering and price it appropriately for the target segment (Kotler, 2000). As a consequence of this, the company can easily select the best distribution and communication channels, and easily have a clear picture the market competitiveness and competitors. [25] [26]
4.2 What is Clustering?
Clustering is a useful technique for the discovery or identification of some knowledge from a dataset. Classification problems often resort to clustering for their solution because of its explanatory methods. When little or no information is present about the category structure in a data body, the appropriate usage of clustering can be prominently visible then. The main objective of clustering is to sample cases under consideration of the same
47 | P a g e group, such that the member of the same group will have high degree of association while the association between members of other groups will be low.
Clustering is also called unsupervised classification, where no predefined classes are assigned (Tou & Gonzales, 1974).
4.3 Clustering Methods
The quality of a good cluster depends on the methods implemented to create them. A good clustering method is more likely to produce high-quality clusters with high intra-class similarities and low inter-class similarity. The quality of the clustering result depends on both the similarity measure used by the method and how it is implemented. It is measured by the ability of the system to discover and reveal new patterns from the datasets.
Clustering of datasets are based on two approaches, namely, Partitional and Hierarchical (Jain & Dubes, 1988; Jain, Murty, & Flynn, 1999). Over the last decades, there have been a high evolution in the domain of artificial intelligence and soft computing. This has led to a vast array of clustering methods being developed on various theories and techniques. [27] [28]
48 | P a g e
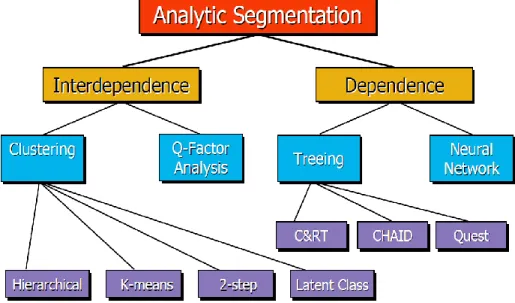
[29] [30] In quant segmentation, there are two different approaches: “Interdependence”
segmentation (or clustering) and “Dependence” segmentation (CHAID, or Chi-Squared Interaction Detection). Clustering is by far one of the most widely used interdependence procedures while CHAID method is subjected to individual preferences. In one way, the words “strategy” can be associated to the interdependence segmentation method, while the word “tactical” can be associated to the more dependence segmentation method.
“What do customers in this market want?”– Then a clustering approach is appropriate. In case of more tactical questions like, “What type of customers will explicitly purchase the product and how to reach them and prompt them to buy?” then CHAID is more fitting because of its dependence approach. So from this the practice that we can generalize is, for general strategy, we should consider interdependence segmentation and for specific tactics, we can go for dependence approach to segmentation.
4.4 K means Clustering & CHAID Clustering:
4.4.1 K means Clustering
[31] [32] K means clustering algorithm is one of the simplest algorithm used for solving clustering problems. In 1967, Mac Queen , proposed for the K- means algorithm for the first time.
During every iteration of the algorithm, each data is assigned to the nearest partition based upon some similarity parameters (as example Euclidean Distance measure). After the completion of every successive pass, a data may switch partitions, resulting in changing the values of the original partitions. Various steps of the standard K-Means clustering Algorithm are follows,
(1) The number of clusters is first initialized and accordingly the initial cluster centers are randomly selected.
(2) A new partition is then generated by assigning each data to the cluster that has the closest centroid.