Volume 2012, Article ID 208953,7pages doi:10.1155/2012/208953
Research Article
Impact of the
−
174 G
> C IL-6 Polymorphism on
Bioelectrical Parameters in Obese Subjects after
Laparoscopic Adjustable Gastric Banding
Laura Di Renzo,
1, 2Maria Grazia Carbonelli,
3Alessia Bianchi,
1Emidio Domino,
1Maria Rita Migliore,
1Guido Rillo,
1Leonardo Iacopino,
1Nicola Di Daniele,
4and Antonino De Lorenzo
1, 21Division of Human Nutrition, Department of Neuroscience, University of Rome Tor Vergata, 00133 Rome, Italy 2I.N.Di.M., National Institute for Mediterranean Diet and Nutrigenomic, 87032 Amantea, Italy
3Dietology and nutrition Unit, San Camillo-Forlanini Hospital, 00151 Rome, Italy 4Department of Internal Medicine, University of Tor Vergata, 00133 Rome, Italy
Correspondence should be addressed to Antonino De Lorenzo,[email protected]
Received 30 November 2011; Accepted 12 March 2012 Academic Editor: Natan Zundel
Copyright © 2012 Laura Di Renzo et al. This is an open access article distributed under the Creative Commons Attribution License, which permits unrestricted use, distribution, and reproduction in any medium, provided the original work is properly cited.
Background. Recent data demonstrated that the−174 G> C IL-6 polymorphism may account for differences in the therapeutic response to laparoscopic adjustable gastric banding (LAGB) surgery. Objective. We investigated the impact of−174 G > C IL-6 polymorphism on weight loss, body composition, and fluid distribution changes in obese subjects after LAGB. Design and
Outcome Measures. Twenty obese subjects were selected and studied at baseline and 3 months after LAGB. Genetic assessment of −174 G> C IL-6 polymorphism and anthropometric and bioelectrical impedance analysis were performed. Results. At baseline, C(+) carriers had a lower extracellular water (ECW) and higher intra-CW, phase angle (PA), reactanceXc, andXc/height. LAGB
surgery determined significant reductions in weight and BMI. After LAGB, in C(−) carriers, significant decreases in weight, BMI, and ECW and increases in BCM, BCMI, ICW, PA, andXc/H were highlighted. In C(+) carriers, significant reductions in weight,
BMI, ICW, and PA and increases in ECW, Na/K, resistance (R), and R/height were obtained. Significant higher reductions in BMI andXc/H were observed in C(+) with respect to C(−) carriers. Conclusions. Genotyping of genetic variants, for example, the −174 G> C polymorphism of IL-6, gives the opportunity to predict therapeutic response, in terms of body composition outcomes after LAGB.
1. Introduction
Assessment of body composition plays an important role in clinical evaluation and in monitoring absolute and relative changes during specific therapeutic regimens in obese subjects [1]. The weight losses induced by dietary or surgical treatment are more rapid in the first months and are associated with changes in body composition and fluid distribution [2]. Along with the increased acceptance of surgical procedures for weight loss in obesity, clinically
useful baseline and follow-up measures of body composition and fluid distribution are critical to evaluate interventional outcomes.
Bioelectrical impedance analysis (BIA) is an easy-to-use, rapid, and noninvasive method to assess nutritional status and body fluid composition [3]. Whole-body BIA allows the determination of the fluid distribution when using appropriate population, age- or pathology-specific BIA equations, and established procedures [4,5]. It makes use of formulas that estimate Total body water (TBW) on the basis
of the concept that the human body may be approximated to a cylinder of length equal to body height [6].
Previous data demonstrated that genetic factors which play an important role in the regulation of body weight may account for differences in the therapeutic response to LAGB [7]. The−174 G> C IL-6 polymorphism, which affects tran-scriptional regulation [8], may be sensed by the homeostatic feedback system that controls energy balance and may in turn contribute to some disturbances in weight regulation, particularly in a situation of negative energy balance, like induced weight loss [9]. We recently provided evidence that the promoter polymorphism of IL-6 (−174 G> C) gene is associated both with body composition and fluid distribution, in obese subjects, at baseline and at 6-month follow-up after LAGB, suggesting that LAGB was less effective if the subjects were carrying risk genotypes (C-carriers) for obesity [10].
The present study aims to investigate the impact of−174 G > C IL-6 polymorphism on nutritional and hydration status in obese subjects, evaluated by anthropometry and bioelectrical impedance analysis (BIA), at 3-month follow-up after LAGB surgery.
2. Methods
2.1. Patients’ Recruitment. The study group consisted of
40 Italian Caucasias with obesity, that is, grade II-III obesity according to the World Health Organization criteria [11], consecutively recruited at the San Camillo-Forlanini Hospital (Rome, Italy) from November 2008 to Novem-ber 2009. Patients desiring surgical intervention for the treatment of obesity were referred to the San Camillo-Forlanini Hospital experienced in the care of obese and bariatric patients to determine the patients’ eligibility for surgery on the basis of the international guidelines [12]. Only patients with BMI> 40 Kg/m2or with BMI> 35 Kg/m2
with comorbidities, in whom all appropriate nonsurgical measures failed to achieve or maintain adequate weight loss for at least 6 months, without any psychiatric prob-lem and/or drug or alcohol addiction were admitted to surgery. Exclusion criteria were secondary causes of obesity, pregnancy, antipsychotic medication, eating disorder, severe altered self-body image, and nonrealistic expectations about weight reduction. Psychiatric problems were evaluated on the basis of tests such as eating disorder examination, body dysmorphic disorder examination, and other tests related to general psychopathology [13]. The binge eating scale (BES), an easily administered 16-item questionnaire with a range between 0 and 42, was used to assess symptoms of binge eating. Higher scores indicate greater degree of binge eating severity [14]. Participation in the study included a complete medical history to gather information about health status, current medications history, including supplements of vitamins and minerals, social habits, like alcohol drinking and smoking, appetite, physical activity, and family history for chronic diseases.
Patients were instructed to not modify physical activ-ity during 3 months of follow-up after LAGB. None of
the patients was receiving drug treatments at the time of the assessment. If a subject was eligible, an operation was sched-uled after an informed consent was obtained. A total of 30 subjects were eligible and admitted to the intervention and underwent LAGB surgery, an adjustable gastric band (Lap-Band, Inamed, Santa Barbara, CA, USA). A multidisciplinary team (an internist, a cardiologist, an endocrinologist, a gastroenterologist, a psychiatrist, a sur-geon, a nutritionist) met each patient and provided an educational session regarding risk and benefits of bariatric surgery and a nutrition and meal-planning guidance. They gave consensus for the study assessments, completed the screening for anthropometry, body composition, and fluid distribution 3 months after surgery and were successfully genotyped for the−174 G> C IL-6 polymorphism. Twenty patients (10 females and 10 males) were selected for data analysis, to obtain homogeneous groups according to gender and IL-6 genotypes.
All patient assessments were conducted in collaboration between San Camillo-Forlanini Hospital and the University of Rome Tor Vergata, Human Nutrition Unit. The collection of DNA as well as the experiments was approved by the Ethical Commission of the University of “Tor Vergata,” Rome, Italy. A statement of informed consent was signed by all participants in accordance with principles of the Declaration of Helsinki.
2.2. Dietary Intervention following LAGB. A standardized
protocol for meal progression after LAGB was assigned to patients. The acute postoperative diet (first and second day) consisted of noncarbonated clear liquids with no calories, no sugar, and no caffeine. For the first month after LAGB, a semiliquid diet of 850 kcal/d was prescribed (33% proteins, 19% lipids, 48% carbohydrates). One month after LAGB, a solid diet was reintroduced, and the suggested diet was 1200 kcal/d; iron was supplemented on the basis of blood examinations performed during the second month. Diet included 48% carbohydrates (starch or bread), 33% proteins (fat-free parts of different animals and fish), and 19% lipids (olive oil); sweets, cakes, sweetened drinks, alcohol, and animal lipids were forbidden. Compliance of diet (and PA) was reviewed monthly by the multidisciplinary team.
2.3. Anthropometric Measurements. After a 12-hour
over-night fast, all subjects underwent anthropometric evaluation. Anthropometric parameters of all the partici-pants were measured according to standard methods (body weight (BW) and height) [15]. Subjects were instructed to take off their clothes and shoes before performing all the mea-surements. BW (kg) was measured to the nearest 0.1 kg, using a balance scale (Invernizzi, Rome, Italy). Height (cm) was measured using a stadiometry to the nearest 0.1 cm (Invernizzi, Rome, Italy). BMI was calculated using the formula: BMI=BW (kg)/height (m)2.
2.4. Bioelectrical Impedance Analysis (BIA). Resistance (R),
reactance (Xc), impedance, and phase angle (PA) at 50 kHz frequency (Single Frequency, SF) were measured using
Table 1: Description of study population according to genotypes. Parameters C(−) (n=10) C(+) (n=10) Age1 40.50±6.74 43.50±13.37
Gender (M/F) 5/5 5/5 Obesity of II degree (%) 10 9.1 Obesity of III degree (%) 90 89.9 IL-6 (pg/mL)1 3.27±0.41 2.85±0.44
BES1 2.17±0.98 2.60±0.70 1Values expressed as arithmeticx±SD. BES, Binge Eating Scale.
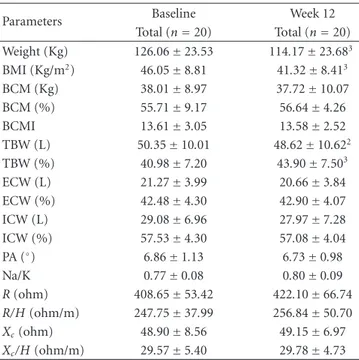
Table 2: Anthropometric and BIA parameters at baseline and week 12 after LAGB.1
Parameters Baseline Week 12 Total (n=20) Total (n=20) Weight (Kg) 126.06±23.53 114.17±23.683 BMI (Kg/m2) 46.05±8.81 41.32±8.413 BCM (Kg) 38.01±8.97 37.72±10.07 BCM (%) 55.71±9.17 56.64±4.26 BCMI 13.61±3.05 13.58±2.52 TBW (L) 50.35±10.01 48.62±10.622 TBW (%) 40.98±7.20 43.90±7.503 ECW (L) 21.27±3.99 20.66±3.84 ECW (%) 42.48±4.30 42.90±4.07 ICW (L) 29.08±6.96 27.97±7.28 ICW (%) 57.53±4.30 57.08±4.04 PA (◦) 6.86±1.13 6.73±0.98 Na/K 0.77±0.08 0.80±0.09 R (ohm) 408.65±53.42 422.10±66.74 R/H (ohm/m) 247.75±37.99 256.84±50.70 Xc(ohm) 48.90±8.56 49.15±6.97 Xc/H (ohm/m) 29.57±5.40 29.78±4.73 1
All values are arithmeticx±SD. BMI, body mass index; BCM, body cell mass; TBW, total body water; ECW; extracellular water; ICW; intra-cellular water; PA, phase angle;R, resistance; H, height; Xc, reactance.
2Reflects the significance of the differences between baseline and week 12
determined with a pairedt-test (P≤0.05).
3Reflects the significance of the differences between baseline and week 12
determined with a pairedt-test (P≤0.001).
a BIA phase-sensitive system (BIA 101S, Akern/RJL Systems-Florence, Italy). Measurements were taken on left side of the body, with injection and sensor electrodes placed on the hand and foot in reference position. TBW, extracellular water (ECW), intra-cellulat water (ICW), Na/K ratio, PA, body cell mass (BCM), and body cell mass index (BCMI) were calcu-lated from bioelectrical measurements and anthropometric data by applying the software provided by the manufacturer, which incorporated validated predictive equations [16–20].
2.5. DNA Genotyping. Volunteers were genotyped for the
−174 G> C IL-6 gene promoter polymorphism. Genomic leukocyte DNA was extracted from peripheral blood according to the standard procedure. The genotyping of
−174 G> C IL-6 polymorphism was performed by poly-merase chain reaction using primers previously published [21] and was followed by the single-strand conformation polymorphism analysis. The CC and the GC genotypes were grouped and indicated as C carriers (C+), and GG genotype was named as C noncarriers (C−). Among Europeans genotype frequencies are 50% of GG, 35% of GC, and 15% of CC (http://www.SNPedia.com/).
2.6. Statistical Analysis. Data are presented as group means±
SD or percentage. Data were analyzed to check assumptions about the distribution of the measured variables. Anχ2test
was also used to evaluate the Hardy-Weinberg equilibrium of the observed genotype frequencies with respect to the general population. Three genotype groups were first considered to check differences in considered variables between groups. Because a dominant or recessive effect existed, analysis was repeated comparing carriers (C+) versus noncarriers (C−) groups. Comparisons among genotype groups were performed using analysis of variance. A paired t-test was performed to evaluate differences before and after LAGB surgery. All tests were considered significant atP ≤ 0.05. Statistical analysis was performed using a computer software package (SPSS for Windows, version 13.0; SPSS, Chicago, IL, USA).
3. Results
Table 1 shows baseline characteristics of all the study pop-ulation according to−174 G/C IL-6 genotypes. According to WHO criteria of obesity, based on BMI evaluation, most of the subjects were obese of II degree at the starting point, before LAGB intervention. According to BES ques-tionnaire, no patients showed binge eating disorders. No association between−174 G> C 6 polymorphism and IL-6 plasma levels at baseline was observed. No postoperative complications occurred in selected patients. After surgery, a significant reduction in food intake was observed at the repeated dietary assessments, and the composition of the diet fits quite well with dietary prescriptions, with a good nutritional compliance (data not shown).
3.1. Effects of LAGB on Anthropometric and BIA Parameters.
We evaluated the efficacy of LAGB surgery and the effects on anthropometry and body composition by BIA analysis of patients after 12 weeks follow-up (Table 2). LAGB surgery determined significant reductions in weight (Δ%= −9.70±
4.39, P < 0.001) and BMI (Δ%= −10.31±5.11, P < 0.01). A significant decrease of TBW (L) and an increase of TBW (%) after intervention were observed.
3.2. Genotyping Assessment. The distribution of the IL-6
genotypes in the total screened population (n = 30) was compatible with the Hardy-Weinberg equilibrium. The C allele frequency was 35.0%, and the GG, GC, and CC genotype frequencies were 45%, 40%, and 15%, respectively. The study population (n=20) was subgrouped in 2 groups,
Table 3: Anthropometric and BIA parameters at baseline and week 12 after LAGB, according to genotypes1.
Parameters Baseline Week 12
C(−) (n=10) C(+) (n=10) C(−) (n=10) C(+) (n=10) Weight (Kg) 135.65±20.17 117.34±23.79 124.95±21.114 104.36±22.334,2bis BMI (Kg/m2) 48.86±9.29 43.25±7.74 44.97±9.204 37.67±5.914,2bis BCM (Kg) 37.68±8.29 38.27±9.89 40.31±8.652 35.60±11.03 BCM (%) 52.14±5.93 58.63±10.54 56.67±3.293 56.61±5.09 BCMI 13.32±2.50 13.85±3.54 14.33±2.183 12.96±2.71 TBW (L) 52.63±8.26 48.47±11.28 51.73±9.19 46.07±11.44 TBW (%) 40.17±8.20 41.64±6.60 43.30±9.203 44.38±6.222 ECW (L) 23.32±3.37 19.50±3.682bis 21.84±2.893 19.68±4.37 ECW (%) 44.69±3.51 40.66±4.152bis 42.64±3.462 43.11±4.672 ICW (L) 29.21±5.60 28.97±8.18 29.89±6.63 26.39±7.723 ICW (%) 55.31±3.51 59.34±4.142bis 57.36±3.462 56.85±4.613 PA (◦) 6.28±0.80 7.34±1.162bis 6.77±0.852 6.69±1.113 Na/K 0.79±0.10 0.75±0.05 0.79±0.09 0.81±0.082 R (ohm) 396.44±54.18 418.64±53.20 393.40±58.96 444.64±64.092,2bis R/H (ohm/m) 238.59±35.58 255.24±39.90 235.87±41.32 272.33±52.902,2bis Xc(ohm) 43.67±8.34 53.18±6.233bis 46.90±5.86 51.45±7.16
Xc/H (ohm/m) 26.18±4.58 32.35±4.442bis 27.99±3.062 31.39±5.292bis 1
All values are arithmeticx±SD. BMI, body mass index; BCM, body cell mass; TBW, total body water; ECW; extracellular water; ICW; intracellular water; PA, phase angle;R, resistance; H, height; Xc, reactance.
2Reflects the significance of the differences between baseline and week 12 determined with a paired t-test (P≤0.05). 3Reflects the significance of the differences between baseline and week 12 determined with a paired t-test (P≤0.01). 4Reflects the significance of the differences between baseline and week 12 determined with a paired t-test (P≤0.001).
2bisReflects the significance of the differences between genotypes at baseline and week 12 determined with an independent t-test (P≤0.05). 3bisReflects the significance of the differences between genotypes at baseline and week 12 determined with an independent t-test (P≤0.05).
that is, (C+) and (C−) carriers of the−174 G/C IL-6 gene polymorphism, as defined above.
3.3. Effects of LAGB on Anthropometric and BIA Parameters according to Genotypes. To investigate if genetic profile
affects changes occurring after LAGB surgery, we compared anthropometric and body composition changes in subgroup patients according to genotypes.Table 3shows the analysis of variance of all variables assessed in C(−) versus C(+) carriers, at baseline and at week 12. At baseline, C(+) carriers had a lower ECW (L, %) and higher ICW (%), PA,Xc, andXc/H. At week 12, a difference in weight, BMI, R, R/H, and Xc/H between C(+) and C(−) carriers was observed.
After LAGB, in C(−) carriers, significant decreases in weight, BMI, and ECW (L, %) and increases in BCM (L, %), BCMI, TBW (%), ICW (%), PA, andXc/H were highlighted.
In C(+) carriers, significant reductions in weight, BMI, ICW (L, %), and phase angle and increases in TBW (%), ECW (%), Na/K, R, and R/H were obtained.
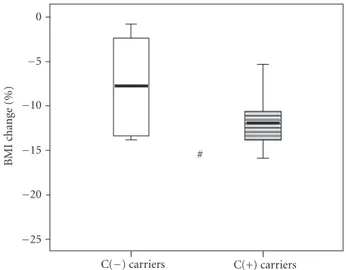
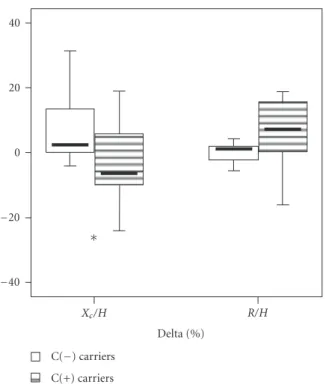
As reported in Figures1and2, we highlighted a strong variability in relative changes of BMI,Xc/H, and R/H, after
restrictive bariatric surgery, according to genotypes. Signifi-cant higher reduction in BMI (Δ% = −12.63±4.11 versus Δ% = −8.00±5.13; P ≤0.05), and Xc/H (Δ%= −2.79±
12.51 versus Δ% = 7.62±11.63; P≤0.05), was observed in C(+) with respect to C(−) carriers.
C(+) carriers 0 # BMI change (%) C(−) carriers −5 −10 −15 −20 −25
Figure 1: Relative changes of BMI 12 weeks after LAGB, according to genotypes. (Data are expressed as median, SD, and CI. SD, standard deviation; CI, confidence interval.#P ≤ 0.05 for C(−)
carriers versus C(+) carriers with independentt-sample test).
4. Discussion
Because of several, but not really exhaustive, data regard-ing the individual response to weight loss interventions,
40 20 0 ∗ Delta (%) C(−) carriers C(+) carriers −20 −40 Xc/H R/H
Figure 2: Relative changes of resistance over height (R/H) and reactance over height (Xc/H) 12 weeks after LAGB, according to
genotypes. (Data are expressed as median, SD, and CI. SD, standard deviation; CI, confidence interval. ∗P ≤ 0.05 for C(−) carriers
versus C(+) carriers with the Mann-Whitney test).
depending on genetic variants, such as the promoter−174 G > C polymorphism of IL-6, the aim of this study was to explore the relationships between body weight, body composition and fluid distribution, and the−174 G> C IL-6 polymorphism in obese subjects, before and 3 months after LAGB.
According to BMI, at baseline, only the 10% of the subjects were affected by obesity of II degree. However, for further investigation we considered the total population tak-ing in account the body composition rather than BMI. Any differences between C(−) and C(+) carriers were observed. The results show that a significant weight reduction in all the study population, 3 months after LAGB, was observed. However, not all subjects showed decrease in weight. On average, individuals who have bariatric surgery lose about 25% of their initial body weight within the first 12 months postoperatively [22, 23]. At 3 months after LAGB, only the 60% of total subjects lost at least 10% of initial body weight. More specifically, there was a higher number of no responders (less than 10% of body weight loss) between C(−) and C(+) carriers (60% versus 20%). Moreover, despite the no significant changes in body composition and fluid distribution, evaluated by BIA, in all the study population, a difference between IL-6 genotypes, both before and after LAGB, occurred. C(−) carriers, other than losing less weight with respect to C(+) carriers (Figure 1, i.e., Δ% of BMI), incurred in significant increases in BCM (Kg, %), BCMI, TBW (%), ICW (%), PA (◦), andXc/H (Figure 2, i.e.,Δ% ofXc/H). On the other hand, C(+) carriers showed a lower
ECW (%), and higher levels of ICW (%), PA (◦), Xc, and
Xc/H, at baseline. Differently from C(−) carriers, C(+)
carriers reduced ICW (%) and PA (◦), without affecting BCM (Kg, %), but increased ECW (%), R and R/H. Therefore, ICW reduction could be a consequence of lean cell shrinking, due to weight loss [1,2]. SF-BIA permits to estimate TBW, but cannot determine differences in ICW [4]. In fact, SF-BIA primarily reflects the ECW space, which represents a constant proportion of TBW in subjects without significant fluid and electrolyte abnormalities. These findings clearly demonstrate that the −174 G > C polymorphism of IL-6 has an impact on the response to weight loss induced by LAGB, in terms of body composition and fluid distribution outcomes, at 3 months after intervention.
It is important to note that previous studies have shown that during the first months after LAGB, the patients experienced the most dramatic weight loss, because they were very compliant to the administered diet. In this clinical situation, it is possible to reveal the true impact of given genetic polymorphisms or their combination on weight loss after LAGB. Thus, we aimed to explore the impact of−174 G > C IL-6 polymorphism 3 months after LAGB through anthropometry and BIA analysis.
Several mechanisms may explain the association of the
−174 G> C IL-6 polymorphism and body composition at baseline and changes after LAGB. IL-6 can regulate energy expenditure centrally, as it is expressed in hypothalamus, and adipose tissue homeostasis [24–28].
To the best of our knowledge, the effect of IL-6 (−174 G > C) polymorphism on body composition, fluid distri-bution after 3 months of LAGB has not been studied yet. Moreover, even if data on body composition changes after weight loss are numerous, only few studies investigated fluid modifications [1,2]. Sesti et al. reported that−174 G> C IL-6 polymorphism is associated with increased weight loss in morbidly obese subjects at 6-month follow-up after LAGB [7]. Poitou et al. in 2005 showed a relationship between
−174 G > C IL-6 polymorphism and circulating product in morbidly obese subjects, during weight loss after surgery [9]. In our previous study, at 6-month follow-up after LAGB surgery, according to IL-6 genotypes, no differences in fluid distribution were highlighted [10].
Limitations of the present study, which should be consid-ered, include the small sample size. On the other hand, our sample size of 20 subjects represented a very homogeneous group, according to gender and genotypes groups. Secondly, all subjects of the study group underwent the same bariatric intervention, that is, LAGB, associated to a well-balanced low-calorie diet.
Although larger study populations are needed to confirm this observation, this finding is comparable with our previ-ous study [10], which has reported the relationship between the −174 G > C polymorphism of IL-6 and therapeutic response to bariatric surgery.
In conclusion, we demonstrated that genotyping of genetic variants, such as the−174 G> C polymorphism of IL-6, gives the opportunity to predict therapeutic response of obese subjects, in terms of body composition outcomes, through bioelectrical evaluation.
Conflict of Interests
The authors declared no conflict of interests.
Acknowledgments
This study was supported by Grants from the Ministero Politiche Agricole e Forestali, Italy (PACB, D.M. 91567 Dic 29, 2004/2008). The authors thank Federica Fabiocchi, Anna-maria Di Dionisio, and Gaia Giugno for the contribution to the study.
References
[1] S. Savastano, A. Belfiore, C. Di Somma et al., “Validity of bioelectrical impedance analysis to estimate body composition changes after bariatric surgery in premenopausal morbidly women,” Obesity Surgery, vol. 20, no. 3, pp. 332–339, 2010. [2] G. Sergi, L. Lupoli, L. Busetto et al., “Changes in fluid
compartments and body composition in obese women after weight loss induced by gastric banding,” Annals of Nutrition
and Metabolism, vol. 47, no. 3-4, pp. 152–157, 2003.
[3] A. R¨osler, F. Lehmann, T. Krause, R. Wirth, and W. von Renteln-Kruse, “Nutritional and hydration status in elderly subjects: clinical rating versus bioimpedance analysis,”
Archives of Gerontology and Geriatrics, vol. 50, no. 3, pp. e81–
e85, 2010.
[4] U. G. Kyle, I. Bosaeus, A. D. De Lorenzo et al., “Bioelectrical impedance analysispart I: review of principles and methods,”
Clinical Nutrition, vol. 23, no. 5, pp. 1226–1243, 2004.
[5] U. G. Kyle, I. Bosaeus, A. D. De Lorenzo et al., “Composition of the ESPEN Working Group. Bioelectrical impedance analy-sispart I: review of principles and methods,” Clinical Nutrition, vol. 23, no. 6, pp. 1430–1453, 2004.
[6] A. De Lorenzo, R. P. Sorge, C. Candeloro, C. Di Campli, G. Sesti, and R. Lauro, “New insights into body composition assessment in obese women,” Canadian Journal of Physiology
and Pharmacology, vol. 77, no. 1, pp. 17–21, 1999.
[7] G. Sesti, L. Perego, M. Cardellini et al., “Impact of common polymorphisms in candidate genes for insulin resistance and obesity on weight loss of morbidly obese subjects after laparoscopic adjustable gastric banding and hypocaloric diet,”
Journal of Clinical Endocrinology and Metabolism, vol. 90, no.
10, p. 5810, 2005.
[8] D. Fishman, G. Faulds, R. Jeffey et al., “The effect of novel polymorphisms in the interleukin-6 (IL-6) gene on IL-6 transcription and plasma IL-6 levels, and an association with systemic- onset juvenile chronic arthritis,” Journal of Clinical
Investigation, vol. 102, no. 7, pp. 1369–1376, 1998.
[9] C. Poitou, J. M. Lacorte, M. Coupaye et al., “Relationship between single nucleotide polymorphisms in leptin, IL6 and adiponectin genes and their circulating product in morbidly obese subjects before and after gastric banding surgery,”
Obesity Surgery, vol. 15, no. 1, pp. 11–23, 2005.
[10] L. Di Renzo, M. G. Carbonelli, A. Bianchi et al., “Body composition changes after laparoscopic adjustable gastric banding: what is the role of −174 G > C interleukin-6 promoter gene polymorphism in the therapeutic strategy?”
International Journal of Obesity, vol. 36, pp. 369–378, 2011.
[11] World Health Organization, “Physical status: the use and interpretation of anthropometry: report of a WHO expert committee,” Tech. Rep. 854, 1995.
[12] NIH Conference, “Gastrointestinal surgery for severe obesity. Consensus development conference panel,” Annals of Internal
Medicine, vol. 115, no. 12, pp. 956–961, 1991.
[13] M. D. Marcus, M. A. Kalarchian, and A. P. Courcoulas, “Psychiatric evaluation and follow-up of bariatric surgery patients,” American Journal of Psychiatry, vol. 166, no. 3, pp. 285–291, 2009.
[14] G. Lo Coco, S. Gullo, L. Salerno, and R. Iacoponelli, “The association among interpersonal problems, binge behaviors, and self-esteem, in the assessment of obese individuals,”
Comprehensive Psychiatry, vol. 52, no. 2, pp. 164–170, 2011.
[15] T. G. Lohman, A. F. Roche, and R. Martorell, Anthropometric
Standardization Reference Manual, Human Kinetics,
Cham-paign, Ill, USA, 1998.
[16] L. Di Renzo, V. Del Gobbo, M. Bigioni, M. G. Premrov, R. Cianci, and A. De Lorenzo, “Body composition analyses in normal weight obese women,” European Review for Medical
and Pharmacological Sciences, vol. 10, no. 4, pp. 191–196, 2006.
[17] A. De Lorenzo, N. Candeloro, A. Andreoli, and P. Deurenberg, “Determination of intracellular water by multifrequency bio-electrical impedance,” Annals of Nutrition and Metabolism, vol. 39, no. 3, pp. 177–184, 1995.
[18] A. De Lorenzo, A. Andreoli, J. Matthie, and P. Withers, “Predicting body cell mass with bioimpedance by using the-oretical methods: a technological review,” Journal of Applied
Physiology, vol. 82, no. 5, pp. 1542–1558, 1997.
[19] J. Matthie, B. Zarowitz, A. De Lorenzo et al., “Analytic assessment of the various bioimpedance methods used to estimate body water,” Journal of Applied Physiology, vol. 84, no. 5, pp. 1801–1816, 1998.
[20] A. De Lorenzo, A. Noce, M. Bigioni et al., “The effects of Italian mediterranean organic diet (IMOD) on health status,” Current
Pharmaceutical Design, vol. 16, no. 7, pp. 814–824, 2010.
[21] L. Di Renzo, A. Bertoli, M. Bigioni et al., “Body composition and −174G/C interleukin-6 promoter gene polymorphism: association with progression of insulin resistance in normal weight obese syndrome,” Current Pharmaceutical Design, vol. 14, no. 26, pp. 2699–2706, 2008.
[22] L. Sj¨ostr¨om, A. K. Lindroos, M. Peltonen et al., “Lifestyle, diabetes, and cardiovascular risk factors 10 years after bariatric surgery,” The New England Journal of Medicine, vol. 351, no. 26, pp. 2683–2693, 2004.
[23] J. Karlsson, C. Taft, A. Ryd´en, L. Sj¨ostr¨om, and M. Sullivan, “Ten-year trends in health-related quality of life after surgical and conventional treatment for severe obesity: the SOS intervention study,” International Journal of Obesity, vol. 31, no. 8, pp. 1248–1261, 2007.
[24] V. Wallenius, K. Wallenius, B. Ahr´en et al., “Interleukin-6-deficient mice develop mature-onset obesity,” Nature
Medicine, vol. 8, no. 1, pp. 75–79, 2002.
[25] K. Wallenius, V. W. Wallenius, D. Sunter, S. L. Dickson, and J.-O. Jansson, “Intracerebroventricular interleukin-6 treatment decreases body fat in rats,” Biochemical and Biophysical
Research Communications, vol. 293, no. 1, pp. 560–565, 2002.
[26] G. Li, R. L. Klein, M. Matheny, M. A. King, E. M. Meyer, and P. J. Scarpace, “Induction of uncoupling protein 1 by central interleukin-6 gene delivery is dependent on sympa-thetic innervation of brown adipose tissue and underlies one mechanism of body weight reduction in rats,” Neuroscience, vol. 115, no. 3, pp. 879–889, 2002.
[27] T. Hirano, “Interleukin 6 and its receptor: ten years later,”
International Reviews of Immunology, vol. 16, no. 3-4, pp. 249–
[28] K. Eder, N. Baffy, A. Falus, and A. K. Fulop, “The major inflammatory mediator interleukin-6 and obesity,”