UNIVERSITÀ DI PISA
Scuola di Dottorato in Ingegneria “Leonardo da Vinci”
Corso di Dottorato di Ricerca in
ADVANCED VIBRATION ANALYSIS FOR
THE DIAGNOSIS AND PROGNOSIS OF
ROTATING MACHINERY COMPONENTS
WITHIN CONDITION-BASED
MAINTENANCE PROGRAMS
Corso di Dottorato di Ricerca in
INGEGNERIA DELL’INFORMAZIONE
Tesi di Dottorato di Ricerca
Sara Lioba Volpi
Autore:
Sara Lioba Volpi ………
Relatori:
Prof. Beatrice Lazzerini ………
Prof. Francesco Marcelloni ………
ADVANCED VIBRATION ANALYSIS FOR
THE DIAGNOSIS AND PROGNOSIS OF
ROTATING MACHINERY COMPONENTS
WITHIN CONDITION-BASED
MAINTENANCE PROGRAMS
Anno 2011 SSD ING-INF/05 UNIVERSITÀ DI PISA
Scuola di Dottorato in Ingegneria “Leonardo da Vinci”
Corso di Dottorato di Ricerca in INGEGNERIA DELL’INFORMAZIONE
Nunquam invenietur,
si contenti fuerimus inventis1.
- L.A. Seneca2
-1 Nothing would ever be found, if we felt satisfied with our discoveries. 2 Naturales Quaestiones, 6, 5, 2.
Acknowledgments
I would like to acknowledge my supervisor Prof. Beatrice Lazzerini, University of Pisa (Italy), who advised me during my Ph.D studies giving me full support in the development of my research and in my professional growth. I would really like to thank my co-supervisor Prof. Francesco Marcelloni for his support during my Ph.D studies.
I wish to express my sincere thanks to Prof. Oscar Cordón, Eu-ropean Centre for Soft Computing (ECSC, Mieres, Spain), who in-troduced me into the field of the cost-sensitive classification and gave me guidance and constructive suggestions during my visiting period in Mieres.
I owe my deepest gratitude to Prof. Dan C. Stefanescu, Suffolk University (Boston, U.S.), who contributed to a relevant part of my research on one-class classifier with valuable suggestions and discussions and generously spent his time and efforts to organize my visiting period in Boston.
I am very grateful to Prof. Piero Bonissone, Chief Scientist at GE Global Research (Niskayuna, NY, U.S.), Prof. Prof. Lakhmi Jain, University of South Australia, and Prof. Dan C. Stefanescu who kindly agreed to review my thesis and dedicated their time to provide deep feedbacks on the current work and valuable ideas for future extensions. During my Ph.D, I shared my working and my leasure time with many people at the department of Information Engineering at the Uni-versity of Pisa, at Suffolk UniUni-versity and at ECSC and, to them, go my deepest thanks. Thanks for the several discussions on topics not necessarily related to my research area which keep my mind open to different subjects. In particular I would like to thank Mario for his precious advices, Kate for her kindness and Charo for letting me know
how wonderful is Spain and the people who live there.
I would really like to thank Marco for his love. Thanks for the infinitive patience, costant support and encouragement that you gave and continue to give me every day of my life. Thank for always being there when I need you.
I am really grateful to my family for all the support they gave me all over my life.
I would like to express my thanks to all my friends and, especially, to Lorenzo for his precious friendship through so many years.
Finally, I wish to acknowledge Avio Propulsione Aerospaziale, via I Maggio, 99, Rivalta di Torino, Italy, for having provided the set of experimental data used for this work.
Sara Pisa, 28 February 2011
A hundred times every day I remind myself that my inner and outer life depend upon the labors of other men, living and dead, and that I must exert myself in order to give in the measure
as I have received and am still receiving. A. Einstein
-Vita
11-28-1983 Born, Castelfiorentino (FI), Italy 2011 Teaching Assistant
Department of Information Engineering University of Pisa, Pisa, Italy
2010 Research Scholar
European Centre of Soft Computing, Mieres, Spain Teaching Assistant
Department of Information Engineering University of Pisa, Pisa, Italy
2009 Senior Lecturer and Research Scholar Maths&Computer Science Department
Suffolk University, Boston (MA), United States Teaching Assistant
Department of Information Engineering University of Pisa, Pisa, Italy
2008 Teaching Assistant
Department of Information Engineering University of Pisa, Pisa, Italy
Second-level Degree in Engineering Final mark: 100/100 cum laude Sant’Anna School, Pisa, Italy
2007 Student Internship
Fermi National Accelerator Laboratory Batavia (IL), United States
Master Degree in Computer Engineering Final mark: 110/110 cum laude
University of Pisa, Pisa, Italy 2005 Student Internship
Internazionale Marmi e Macchine Carrara Spa Carrara (MS), Italy
Bachelor Degree in Computer Engineering Final mark: 110/110 cum laude
Publications
Books
1. S.L. Volpi, Introduction to Matlab and PRTools, ed. S.E.U., Pisa 2010.
Journals
1. B. Lazzerini, S.L. Volpi, Classifier ensembles to improve the ro-bustness to noise of bearing fault diagnosis, Pattern Analysis & Applications, pp. 1–17, 2011.
Conference proceedings
1. M. Cococcioni, E. D’Andrea, B. Lazzerini, S.L. Volpi, Short-time forecasting of renewable production energy in solar photovoltaic installations, Int. Conf. on Competitive and Sustainable Manu-facturing, Products and Services (APMS’10), Como, Italy, Octo-ber 2010.
2. S.L. Volpi, M. Cococcioni, B. Lazzerini, D. Stefanescu, Rolling el-ement bearing diagnosis using convex hull, IEEE World Congress on Computational Intelligence (WCCI’10), vol. 1, pp. 1–8, Barce-lona, Spain, July 2010.
3. B. Lazzerini, S.L. Volpi, Noise assessment in the diagnosis of rolling element bearings, Int. Conf. on Intelligent Computing and Cognitive Informatics (ICICCI’10), vol. 1, pp. 227–230, Kuala Lumpur, Malaysia, June 2010.
4. M. Cococcioni, B. Lazzerini, S.L. Volpi, Rolling element bear-ing fault classification usbear-ing soft computbear-ing techniques, IEEE Int. Conf. on Systems, Man, and Cybernetics (SMC’09), vol. 1, pp. 4926– 4931, Hyatt Regency Riverwalk, San Antonio, Texas, U.S., Octo-ber 2009.
5. M. Cococcioni, B. Lazzerini, S.L. Volpi, Automatic diagnosis of defects of rolling element bearings based on computational intel-ligence techniques, IEEE Int. Conf. on Intelligent Systems De-sign and Applications (ISDA’09), vol. 1, pp. 970–975, Pisa, Italy, November–December 2009.
6. S.L. Volpi, M. Antonelli, B. Lazzerini, F. Marcelloni, D. Ste-fanescu, Segmentation and reconstruction of the lung and the me-diastinum volumes in CT images, IEEE 2nd Int. Symp. on Applied Sciences in Biomedical and Communication Technolo-gies (ISABEL’09), vol. 1, pp. 1–6, Bratislava, Slovak Republic, November 2009.
7. S.L. Volpi, B. Lazzerini, D. Stefanescu, Time Evolution analy-sis of bearing faults, IASTED Int. Conf. on Intelligent Systems and Control (ISC’09), Cambridge, Massachusetts, U.S., Novem-ber 2009.
8. M. Cococcioni, B. Lazzerini, S.L. Volpi, Bearing condition mon-itoring using classifier fusion, IASTED Int. Conf. on Artificial Intelligence and Soft Computing (ASC’09), vol. 1, pp. 131–137, Palma de Mallorca, Spain, October 2009.
Abstracts, presentations and seminars
1. S.L. Volpi, Classifier ensembles to improve the robustness to noise of bearing fault diagnosis, Ph.D. Workshop, Advances in Com-puter Systems and Networks, Pisa, Italy, November 2010.
2. S.L. Volpi, The use of Matlab in decision support intelligent sys-tems, Faculty of Engineering, University of Pisa, April-May 2010.
3. S.L. Volpi, Intelligent systems in a Matlab environment, Faculty of Engineering, University of Pisa, March-April 2010.
4. S.L. Volpi, Automatic diagnosis and time-evolution analysis of rolling element bearings defects using soft computing techniques, Ph.D. Workshop, Advances in Computer Systems and Networks, Pisa, Italy, November 2009.
5. S.L. Volpi, Segmentation and reconstruction of the lung and me-diastinum fields in traditional CT and PET/CT images, Ph.D. Workshop, Advances in Computer Systems and Networks, Pisa, Italy, November 2008.
Theses
1. S.L. Volpi, Design and realization of a lung CAD system for PET/CT exams, Second-level Degree in Engineering, Sant’Anna School of Advanced Studies of Pisa, Pisa, Italy, 2008.
2. S.L. Volpi, Design and realization of the module for the extraction of the mediastinum and the lung area from DICOM images in a lung CAD system for CT exams, Master Degree in Computer Engineering, University of Pisa, 2007.
3. S.L. Volpi, Uniform Sampling Control, Bachelor Degree in Com-puter Engineering, University of Pisa, 2005.
SOMMARIO
I macchinari utilizzati nell’ambito industriale sono soggetti a dete-rioramento nel tempo e per l’uso, per cui risulta di estrema importanza l’attuazione di un programma di manutenzione allo scopo di evitare il verificarsi di guasti che possono portare a conseguenze anche disastrose. La letteratura si è focalizzata sullo sviluppo di strategie di manutenzione ottimali come la “condition-based maintenance” (CBM, manutenzione basata sull’evento) per aumentare l’affidabilità, evitare guasti e ridurre i costi legati alla manutenzione stessa. La CBM si propone di identificare in tempo la presenza e la gravità di un guasto, di stimare quanto tempo manchi prima che un guasto si verifichi all’interno di un macchinario e di individuare le componenti che si stanno deteriorando. La CBM è stata largamente ed efficacemente applicata ai macchinari rotanti che, generalmente, basano il loro funzionamento sui cuscinetti. Il funziona-mento continuo e affidabile dei cuscinetti è importante poiché il guasto di uno di essi può compromettere l’intero sistema. Quindi monitoraggio, prognosi e diagnosi di cuscinetti rappresentano task cruciali all’interno di programmi di manutenzione di tipo real-time.
In questa ricerca è stato effettuato uno studio completo delle tecniche di soft computing includendo la classificazione multi- e one-class e le strategie di combinazione basate su fusione e selezione di classificatori al fine di progettare e sviluppare metodologie accurate e robuste al rumore per la diagnosi e prognosi di guasti su cuscinetti a elementi rotanti.
Sono stati utilizzati segnali basati sulle vibrazioni registrati da quat-tro accelerometri su un dispositivo meccanico che includeva cuscinetti a elementi rotanti: i segnali sono stati registrati sia quando tutti i cu-scinetti nel dispositivo erano “sani” sia quando uno di essi era stato sostituito con un cuscinetto danneggiato artificialmente. Sono stati con-siderati quattro tipi di guasti e tre livelli di gravità.
Questa ricerca ha portato al progetto e sviluppo di nuovi classificatori che, grazie agli alti livelli di accuratezza raggiunti, hanno dimostrato di rappresentare una valida alternativa ai classificatori tradizionali. Inol-tre gli alti livelli di accuratezza e robustezza al rumore ottenuti dagli esperimenti provano l’efficacia delle metodologie proposte per effettuare automaticamente la prognosi e diagnosi delle componenti di macchinari rotanti all’interno di programmi di CBM.
ABSTRACT
Machines used in the industrial field may deteriorate with usage and age. Thus it is important to maintain them so as to avoid fail-ure during actual operation which may be dangerous or even disastrous. The literature has focused its attention on the development of optimal maintenance strategies, such as condition-based maintenance (CBM), in order to improve system reliability, to avoid system failures, and to decrease maintenance costs. CBM aims to detect the early occurrence and seriousness of a fault, to estimate the time interval during which the equipment can still operate before failure, and to identify the com-ponents which are deteriorating. CBM has been widely and effectively applied to rotating machines, which usually operate by means of bear-ings. The reliable and continuous work of bearings is important as the break of one of them can compromise the work of the system. Thus the monitoring, prognosis and diagnosis of bearings represent crucial and important tasks to support real-time maintenance programs.
This research has carried out a complete analysis of advanced soft computing techniques ranging from the multi-class classification to one-class one-classification, and of combination strategies based on one-classifier fu-sion and selection. The purpose of this analysis was to design and develop high accurate and high robust methodologies to perform the de-tection, diagnosis and prognosis of defects on rolling elements bearings. We used vibration signals recorded by four accelerometers on a me-chanical device including rolling element bearings: the signals were col-lected both with all faultless bearings and after substituting one faultless bearing with an artificially damaged one. Four defects and three severity levels were considered.
This research has brought to the design and development of new classifiers which have proved to be very accurate and thus to represent a valuable alternative to the traditional classifiers. Besides, the high accuracy and the high robustness to noise, shown by the obtained re-sults, prove the effectiveness of the proposed methodologies, which can be thus profitably used to perform automatic prognosis and diagnosis of rotating machinery components within real-time condition-based main-tenance programs.
Contents
Sommario i
Abstract iii
Introduction 1
1 Fundamentals of Pattern Recognition 5
1.1 Pattern Recognition concepts for supervised learning . . 9
1.1.1 Features . . . 9
1.1.2 Classes . . . 9
1.1.3 Data sets . . . 10
1.1.4 Classifiers . . . 11
1.2 Classification process . . . 11
1.2.1 Classification process steps . . . 11
1.2.2 Classification performance indexes . . . 13
1.2.3 Methods to test the classification system . . . 16
1.2.4 Validation set . . . 20
2 The rolling element bearing diagnostic and prognostic issues 23 2.1 State of the art . . . 25
2.2 Discussion on the state of the art . . . 28
3 Pattern recognition theory 33 3.1 Feature selection and feature extraction algorithms . . . 33
3.1.1 Forward Feature Selection algorithm . . . 34
3.1.2 Individual Feature Selection algorithm . . . 35
3.1.3 Principal Component Analysis algorithm . . . 35
vi Contents
3.2.1 Linear discriminant classifier . . . 35
3.2.2 Quadratic discriminant classifier . . . 38
3.2.3 Neural Networks . . . 38
3.3 Classifier ensembles . . . 43
3.3.1 Classifiers Fusion . . . 43
3.3.2 Classifier Selection . . . 45
3.4 One-class classification . . . 46
3.4.1 Density estimation based one-class classifiers . . 48
3.4.2 Boundary based one-class classifiers . . . 51
3.4.3 Convex hull classifier . . . 52
3.4.4 Snake operator classifier . . . 54
3.4.5 CSC classifier . . . 55
3.4.6 CSS classifier . . . 56
4 Rolling element bearing data set 59 4.1 Data set description . . . 60
4.1.1 Types of collected data . . . 60
4.1.2 Subdivision of the data into classes and subclasses 60 4.1.3 Data distribution . . . 62
4.2 Environment and software used . . . 63
5 Classification and diagnosis of rolling element bearings 65 5.1 First series of experiments . . . 67
5.1.1 Introduction to the first series of experiments . . 67
5.1.2 Classification of C1 and C6 . . . 67 5.1.3 Classification of C1, C3.1, C3.2, and C3.3 . . . . 70 5.1.4 Classification of C1, C2, C3, C4, and C5 . . . 71 5.1.5 Classification of C1, C2, C3.1, C3.2, C3.3, C4, and C5 . . . 73 5.1.6 Classification of C2 and C3.1 . . . 76
5.1.7 Conclusions to the first series of experiments . . 77
5.2 Second series of experiments . . . 78
5.2.1 Introduction to the second series of experiments . 78 5.2.2 Classification of C1 and C6 . . . 81
5.2.3 Classification of C1, C2, C3, C4, and C5 . . . 83
5.2.4 Classification of C3.1, C3.2, and C3.3 . . . 85
5.2.5 Classification of C1, C2, C3.1, C3.2, C3.3, C4, and C5 . . . 86
Contents vii 5.2.6 Conclusions to the second series of experiments . 89 6 Time evolution analysis of rolling element bearing faults 91
6.1 Methodology . . . 93
6.2 Experiments and Results . . . 95
6.2.1 Classification of C1 and C7 . . . 95
6.2.2 Classification of C1 and C6 . . . 96
6.2.3 Classification of C3.1.2, C3.1.3, and C3.1.4 . . . . 98
6.2.4 Time evolution of a defect . . . 102
6.3 Conclusions to the prognosis issue . . . 105
7 Noise Analysis 107 7.1 Noise signal creation . . . 107
7.2 First assessment of the robustness to the noise . . . 109
7.2.1 Introduction to the experiments for the first as-sessment of the robustness to noise . . . 109
7.2.2 Methodology . . . 110
7.2.3 First series of experiments . . . 113
7.2.4 Second series of experiments . . . 116
7.2.5 Third series of experiments . . . 119
7.2.6 Conclusion to the experiments for the first assess-ment of the robustness to noise . . . 121
7.3 Methods to increase the robustness to noise . . . 123
7.3.1 Introduction to the developed methods to increase the robustness to noise . . . 123
7.3.2 Methodology . . . 124
7.3.3 Experiments and results . . . 126
7.3.4 Conclusions to the developed methods to increase the robustness to noise . . . 150
8 The bearing diagnosis as a one-class classification prob-lem 151 8.1 One-class classification to perform bearing diagnosis . . 152
8.2 Methodology . . . 155
8.2.1 Signal representation . . . 155
8.2.2 Working domain and training and test sets creation155 8.2.3 Feature space dimensionality reduction . . . 156
viii Contents 8.4 One-class classifiers vs multi-class classifiers . . . 162
8.4.1 Introduction to the experiments to compare one-class with multi-one-class one-classifiers . . . 162 8.4.2 Experiments and results . . . 163 8.4.3 Conclusions to the experiments to compare
one-class with multi-one-class one-classifiers . . . 167 8.5 Traditional one-class classifiers vs proposed one-class
clas-sifiers . . . 168 8.5.1 Introduction to the experiments to compare
tra-ditional with proposed one-class classifiers . . . . 168 8.5.2 Experiments and results . . . 168 8.5.3 Conclusions to the experiments to compare
tra-ditional with proposed one-class classifiers . . . . 177
9 Conclusions 179
9.1 Future work . . . 180
Bibliography 181
List of Figures 197
Introduction
One of the most important aspects in the domestic and industrial fields is the reliability of the used equipment such as rotating machines, which are increasingly employed in these two contexts. Furthermore the as-sessment of these machines is becoming more and more strict as they should meet more and more demanding performance criteria [1]. Unfor-tunately, these systems and machines may deteriorate with usage and age [135] bringing even to the breakdown of the system [21, 76, 141, 142]. Failures in these systems may result into catastrophic consequences depending on the field in which they operate. The most critical fields include, for example, the nuclear one where problems on machine may bring to serious consequences on people and the environment [21, 22, 142]. In the manufacturing field, breakdown problems can bring to unscheduled downtime causing reduction in the product quality, loss in the production and thus loss of money from the customers [150].
It is, therefore, extremely important to maintain and, if necessary, to repair systems and machines so as to avoid failure during the actual operation [143]. For this reason the machine maintenance has became an integral part of industrial systems with the aim of reducing costly machine downtime and ensuring production quality.
Maintenance is the set of activities aimed at maintaining a system in operable condition [5]. Although maintenance has been generally regarded as an unnecessary cost in many industries and organizations [129], in the last few years it has been considered more and more a profit-generating activity and, thus, a strategic issue [5, 129, 136]. Ac-tually, a machine that is not properly maintained may result in speed losses, lack of precision, and reduction of the operating conditions up to the system breakdown [1, 4, 5]. Thus, the maintenance quality rep-resents a key factor of the operating and environmental conditions that influence machine life [3]. Besides, only an effective maintenance policy
2 Introduction can improve machine performance and product quality [5].
For these reasons, researchers have increasingly focused their at-tention on the development of optimal maintenance strategies so as to improve system reliability, to avoid system failures, and to decrease maintenance costs themselves [143]. In particular, maintenance pro-grams should guarantee that physical assets behave as expected at the minimum expense [129]. Thus, in the last years, the maintenance issue has been widely investigated in the literature [28, 90, 135, 143, 146, 151]. Maintenance activities can be classified in two main categories, namely corrective maintenance and preventive maintenance.
Corrective maintenance (CM), also called breakdown maintenance, refers to repairing faults after their occurrence. This kind of mainte-nance may imply high costs owing not only to the need of restoring the equipment operative condition, but also to possible production loss and/or safety consequences [129, 143]. All this is due to the fact that CM is not able to prevent any faults.
Preventive maintenance (PM), on the contrary, tries to prevent fault occurrence by identifying and correcting conditions that would cause breakdowns. When PM is performed through periodic inspections, it is called time-directed maintenance (TDM) [21, 129, 143, 154].
Although CM is usually considered more expensive than TDM, the indiscriminate use of overhaul or preventive replacement procedures in TDM programs may result in unnecessary waste of time and resources [129]. Furthermore no guarantee can be given regarding the proper work of the system between two subsequent checks.
To overcome the drawbacks of the above described maintenance pro-cesses another form of PM, called condition-based maintenance (CBM) [125, 129], has been widely adopted in the last years to detect the onset of a failure [21, 22, 23, 76, 141, 142]. CBM represents the ideal form of maintenance when a failure cannot be prevented, e.g., failures caused by random events. CBM is similar to TDM since it is performed at given intervals, however, since it is based on a continuous monitoring of the system, it needs to perform appropriate maintenance actions only when necessary. Thus, unlike TDM, CBM does not usually cause an intrusion into the equipment, and the actual preventive action is trig-gered by the detection of an incipient failure [129]. Therefore CBM aims to detect the early occurrence and seriousness of a fault, to
es-Advanced vibration analysis for CBM programs 3 timate the time interval during which the equipment can still operate before failure, and to identify the components (e.g., bearings) that are deteriorating [141]. In particular, CBM exploits condition monitoring information, which consists of the continuous or periodic measurement and interpretation of data that help assessing the operating condition of each system component [141, 146, 147].
In this dissertation we focused on the condition-based maintenance of rotating machines [21, 141]. Actually, condition monitoring, fault diagnosis and fault prognosis of rotating machinery have become more and more important in many industrial fields from the safety-critical ones to the manufacturing and production ones [58, 61, 77], in order to guarantee the survival of the machines and the reliability of the involved processes. Since fault occurrence cannot be avoided in these machines, early detection and diagnosis of incipient failures can help prevent the machine breakdown by identifying the presence of symptoms such as increased vibrations, noise and temperature [146]. Thus CBM has been widely and effectively applied to rotating machines. Such machines usu-ally operate by means of bearings, which represent a critical component whose state can be profitably used to represent the machine state [146]. The reliable and continuous work of all the bearings is very important as the break of one of them can compromise the proper work of the whole system [22, 23, 76, 141, 142]. However, bearings, even though well de-signed, often have to bear stress and heavy load which can deteriorate their performance [61] up to a point in which they can compromise the proper work of the machine inside which they are located, bringing to the system breakdown and possibly have catastrophic consequences de-pending on the field in which they operate [21, 76, 141, 142]. Besides, the faults occurring in rotating machines are often linked to bearing faults [77, 130]. For all these reasons the monitoring and the fault diag-nosis of bearings have been widely studied in the literature, in order to make the fault detection as automatic as possible and thus to be able to implement real time maintenance [22, 23, 61, 114, 115, 141].
In this work some methodologies to perform the robust diagnosis and the prognosis of rolling element bearing defects are proposed, rang-ing from the multi-class classification to the one-class classification, pay-ing attention to every “level” of a classification system. In particular, since there are four different approaches to build a classifier ensemble
4 Introduction [30, 73], namely, the data level where different data subsets are used, the feature level where different feature subsets are used, the classifier level where different base classifiers are used, and the combination level where different combiners are used [30, 73], the proposed methodologies make use of each of these approaches to create more robust and more accurate classification systems. Besides, some new developed one-class classifiers are introduced in this dissertation. The proposed classifiers have proved to be very accurate and to perform pretty better than the traditional multi-class and one-class classifiers, thus showing to be valuable alternatives to the traditional classifiers.
In this dissertation a real data set has been used. This data set has been provided by Avio Propulsione Aerospaziale (Rivalta di Torino, Italy).
This dissertation is organized as follows. Chapter 1 introduces an overview on the main elements of Pattern Recognition on which this thesis is based, Chap. 2 describes in details the issues dealt with in this dissertation as well as an overview on the state of the art on this field. Chapter 3 presents the designed and developed methodologies, algorithms and classifiers, Chap. 4 concerns the description of the used data set, while Chaps. 5–8 show the proposed methodologies and the related experimental results. In particular Chap. 5 refers to the classi-fication and diagnosis of rolling element bearing faults, Chap. 6 deals with the prognosis issue of rolling element bearing faults, Chap. 7 con-siders the problem of creating algorithms robust to noise, and, Chap. 8 copes with the diagnosis of bearing faults as a one-class problem. Fi-nally, Chap. 9 provides concluding remarks as well as a brief overview of the future work.
Chapter 1
Fundamentals of Pattern
Recogni-tion
We should make things as simple as possible, but not simpler.
A. Einstein
-The problem of searching for patterns in data is fundamental in the real life [73]. Pattern recognition (PR) is about assigning labels (classes) to objects (data) [32, 73, 138]. Each object is described by a set of measurements (attributes) defined in a certain space (a one-dimensional space or more generally a multione-dimensional space). These attributes are called features [73, 138]. The space defined by the set of features is called feature space [73].
There are two major types of pattern recognition branches: unsu-pervised and suunsu-pervised [73].
In the unsupervised category (known also as unsupervised learn-ing), the goal is to unravel the underlying similarities, and to discover the structure of the data set if there is any [32, 73, 152]. This usu-ally means that the aim of the learning process is to discover whether there are clusters in the data, and what characteristics make similar the objects inside the same cluster as well as different from the objects belonging to the other clusters [152]. In the literature, many cluster-ing algorithms have been and continue to be proposed for unsupervised
6 Fundamentals of Pattern Recognition learning [73]. The choice of an algorithm is basically guided by the designer’s preference, since different algorithms, even though starting from the same set of data, may lead to different results [10, 73]. The issue in this branch of PR is that there is no way to evaluate the results but the indication of the user, which means that the result interpreta-tion may also be based on subjective estimainterpreta-tions [73]. One of the most used unsupervised learning algorithm is the k-means algorithm [10, 73], whose steps are described in Fig. 1.1. Fig. 1.3 shows an application of the k -means algorithm to the data set represented in Fig. 1.2. Besides, inside the unsupervised PR category the one-class classification, which will be fully described in Chap. 3, is also included.
Figure 1.1 k-means algorithm steps.
Advanced vibration analysis for CBM programs 7
(a)k -means with k =2 (b)k -means with k =3
(c)k -means with k =5 (d)k -means with k =10 Figure 1.3 Unsupervised learning. Application of the k-means algorithm to the data set represented in Fig. 1.2. (a) k = 2, (b) k = 3, (c) k = 5, and (d) k = 10. Each cluster is identified by a specific symbol, so that samples belonging to the same cluster are represented by the same symbol while samples from different clusters are represented by different symbols.
8 Fundamentals of Pattern Recognition The supervised category [13, 73] (known also as supervised learning) differs from the unsupervised learning since a priori known knowledge is available. More precisely each object in the data set is associated to a preassigned label. Each label identifies a class, so that each class is identified by a different label. Intuitively, a class contains similar objects (all associated to the same label), whereas objects from different classes are dissimilar [13, 73]. In most cases the labeling process cannot be described in an algorithmic form, this is why we generally supply the classification system with learning skills [73]. More precisely we provide the classification system with a set of labels in order to allow the system to learn how to distinguish objects belonging to different classes. This process is called learning or training process. What is really important in the learning process is to obtain a classification model with good generalization capabilities, i.e., a model that accurately predicts the class labels not only of the objects seen during the learning process but also of unknown objects [122].
Fig. 1.4 shows an example of supervised learning dealing with a 2-class classification problem. The classification is performed by four classifiers: a 3-NN, a Linear Discriminant Classifier, a Quadratic Dis-criminant Classifier, and a Multi-Layer Perceptron Neural Network.
Figure 1.4 Supervised learning. 2-class classification problem. First class (red stars), second class (blue plus). Classification performed by four classifiers: 3-NN (green line), Linear Discrim-inant Classifier (black line), Quadratic DiscrimDiscrim-inant Classifier (blue line), Multi-Layer Perceptron Neural Network (red line).
Advanced vibration analysis for CBM programs 9
1.1
Pattern Recognition concepts for supervised
learning
1.1.1 Features
As stated above, objects are described by attributes called features. According to “The International Dictionary of Artificial Intelligence” [106] a feature can be defined as a (usually) named quantity that can take on different values. These values are the feature’s domain and, in general, can be either quantitative or qualitative [41, 73].
The branch of PR which operates with quantitative features is called statistical pattern recognition [73]. In this branch the features are rep-resented by numbers, such as integers or real numbers, for example the amplitude of a signal measured in dB. In particular numerical features values are arranged as an n-dimensional vector as represented in the following:
X = [x1, x2, . . . , xn] x ∈ Rn
where each element of the vector corresponds to a specific feature, while the whole vector represents an object of the data set. The real space Rn is called the feature space and each axis corresponds to a specific feature.
The choice of a good set of features is a basic point to obtain good performance in the pattern recognition process [23, 76].
In this dissertation we make use of quantitative features and we will explain how we manage to obtain these features to be later used in the classification process.
1.1.2 Classes
As stated above, a class should contain similar objects while objects from different classes should be dissimilar [73]. However, the concept of similarity and dissimilarity are not always perfectly clear, sometimes classes are well defined and, in the simplest case, the classes are mu-tually exclusive [73], such as in the handwriting recognition where the classification system receives and interprets intelligible handwritten in-put from a certain source (paper documents, photographs, or other devices). In fact each hand-written symbol corresponds to one and
10 Fundamentals of Pattern Recognition only one symbol stored in the computer, no matter if we are able to recognize the right matching symbol [73].
Nevertheless, in other classification problems, a distinct separation among the classes is not always simply identifiable. For example in the medical research there is an intrinsic variability that makes difficult to identify the classes, as well as to identify which are the most dis-criminant features [73]. Furthermore, there can be co-presence of more than one illness, which makes even more difficult to identify the specific illness we were interested in [73, 140].
1.1.3 Data sets
A data set is a collection of data (objects, elements, samples), usually presented in a matrix-like form, where each column represents a par-ticular feature, while each row (feature vector) corresponds to a given sample of the data set. Thus a data set can be represented by an N × n matrix where N is the number of rows which corresponds to the num-ber of objects composing the data set, and n is the numnum-ber of features describing each object of the data set.
Figure 1.5 Representation of a data set with N objects described by n features as an N × n matrix.
A data set is described by several parameters which include the following ones:
• the number and types of the features, • the number of samples,
• the number of classes,
• the vector of the class labels associated to each object.
Normally the order in which the samples are “listed” does not matter and thus the list of objects is unordered. Of course there are cases where the order is important such as in regression problems [19].
Advanced vibration analysis for CBM programs 11 Data sets can be obtained in many ways. Besides there exist some data sets made available on Internet which can be used as benchmarks in the PR field. One of these repositories of data sets is the UCI Machine Learning Repository Database [40] athttp://archive.ics.uci.edu/ ml.
In this dissertation a real data set is used. This data set has been provided by Avio Propulsione Aerospaziale, via I Maggio, 99, Rivalta di Torino, Italy.
1.1.4 Classifiers
A classifier can be described by any function F: F : Rn→ Ω
which, starting from the n-size vector of features values describing an object x (x ∈ Rn), identifies the class (ω
i ∈ Ω) to which x belongs. A
classifier can be considered as a set of discriminant functions F [117], each yielding a score (probability) for one specific class (thus one func-tion fi per each class ωi). Each discriminant function fi returns a value
when applied to an object. More precisely each function fi returns
a value which specifies the confidence of the function in assigning the specific object x to the class ωi [73]. Then, typically, the object x is
assigned to the class with the highest score. Ties are broken randomly. Thus the classifier is the result of the application of the maximum rule to this set of discriminant functions (see Fig. 1.6). Therefore, gener-ally, a classifier performs a mapping from an n-dimensional space Rn to a c-dimensional space, Rc, where c is the number of classes [32, 73].
An example of classification performed by a Quadratic Discriminant Classifier (QDC) is represented in Fig. 1.7 [73].
There exist many types of classifiers such as linear, quadratic, and neural networks classifiers. Besides, more classifiers can be appropri-ately combined. We will deal with the combination of classifiers in the next chapters.
1.2
Classification process
1.2.1 Classification process steps
To perform a classification process, first of all we need data, that means that we need to make measurements of what we are interested in. This
12 Fundamentals of Pattern Recognition
Figure 1.6 Classification process. The object is described by the features’ vector. The classifier has one discriminant function as-sociated to each class. The maximum rule determines the winner class, i.e., the class to which the object will be assigned.
Figure 1.7 2-class data set. First class: crosses, second class: points. Classification performed by a QDC classifier.
can be done using sensors which are a fundamental part of every clas-sification system.
Then the raw data, represented in a certain way depending on the type of the used sensors, should be processed in order to represent them in a more suitable way. For example transforming data from time to frequency domain by using the Fast Fourier Transform (FFT) [21, 22, 23, 76, 141, 142].
Once the data are preprocessed, we need to prepare the training set, i.e., to select/extract the objects to be used as training set. This process is called prototype selection/extraction depending on the type of algorithm used to perform this process [73].
Advanced vibration analysis for CBM programs 13 Then another process to eliminate useless information and retain the most important information as much as possible should be performed. More precisely, data are represented by a set of features (for example each element of the FFT), and, since features are not all equally rel-evant, we need to identify which of these features are really useful at the aim of the classification. The process which selects/extracts the best features to represent the data with classification purpose is called feature selection/extraction. This process should be able to represent the data in the best way, which means to retain the most information (the best features) while removing unnecessary noise (useless features) [21, 22, 23, 73, 76, 141, 142].
Once the data have been “cleaned”, they can be used to train a clas-sification system, which will be successively used to classify “unknown” data (test set). The classification system may be composed of only one classifier or more classifiers appropriately combined. The combination level represents another crucial step since the choice of the combination strategy can affect all the classification process. Besides each classifier should be trained appropriately and the algorithm used to train the classifier represents another parameter which can further affects the performance of the final classification system.
Data sampling, prototype selection/extraction (choice of the algo-rithm to be used and its related parameters), feature selection/extraction (choice of the algorithm to be used and its related parameters), training (choice of the classifier to be used, choice of the classifier training algo-rithm and, if needed, choice of the combination strategy,. . . ) compose the core of the supervised PR process.
The classification system can then be further tuned working on each of these steps but not necessarily all of them [73]. When a satisfactory accuracy on the training set has been reached, the training process can be stopped and the system can be used to process and classify new data [73]. Each of these subprocesses is fundamental to create the whole classification system. In the next chapters we will deal with all these subprocesses more in detail.
1.2.2 Classification performance indexes
Every time we train a classifier (classification system) we would like to know how good it is, i.e., to evaluate its performance, since we are interested in classifiers or better classification systems which are able
14 Fundamentals of Pattern Recognition to reach reasonable performance.
The performance of a classifier can be described by many perfor-mance indexes such as classification accuracy, confusion matrix, and others. Of course we have to identify which of these indexes are the most important for the specific problem we are dealing with. Probably the most important and used performance index is the accuracy. Classification accuracy
Generally the classification accuracy (shortly accuracy) is defined as the number of samples correctly classified divided by the total number of samples under classification as shown in eq. 1.1:
Accuracy = number of samples correctly classified
total number of classified samples (1.1) The classification error (shortly error ) is then obtained subtracting the classification accuracy from 1 as described in eq. 1.2:
Error = 1 − Accuracy = number of samples incorrectly classified total number of classified samples
(1.2) True positives, False positives, True negatives, False negatives There are other indexes related to the accuracy which are specific for 2-class data sets. When a 2-class data set is considered, generally, one class is called positive class (PC) while the other one negative class (NC). If we call
• class 1: Negative Class, NC (composed by the so-called negative samples),
• class 2: Positive Class, PC (composed by the so-called positive samples),
then, we can define the following four indexes:
• TN : True Negatives, i.e., the number of negative samples correctly classified,
• FP : False Positives, i.e., the number of negative samples incor-rectly classified as belonging to the positive class,
Advanced vibration analysis for CBM programs 15 • TP : True Positives, i.e., the number of positive samples correctly
classified,
• FN : False Negatives, i.e., the number of positive samples incor-rectly classified as belonging to the negative class.
Confusion matrix
The four indexes TP, TN, FP, FN can be represented in a confusion matrix. A confusion matrix [70] provides an easy, synthetic, and com-plete way to describe the knowledge about a classification system per-formance. It gives information about the true labels and the estimated labels assigned by a classification system to a specific data set. An example of a confusion matrix for a 2-class problem is represented in Fig. 1.8. Of course, a confusion matrix can be generalized to an N -class problem [138].
Figure 1.8 2-class confusion matrix.
In a 2-class problem, starting from the confusion matrix (considering the two classes having the same priority) the accuracy percentage can be evaluated as in eq. 1.3
accuracy = T N + T P
T N + T P + F N + F P (1.3)
consequently the classification error is expressed by eq. 1.4:
error = 1 − accuracy = F N + F P
T N + T P + F N + F P (1.4) Specificity and Sensitivity
Using TP, FP, TN, and FN we can derive other two performance in-dexes called sensitivity and specificity.
16 Fundamentals of Pattern Recognition In particular, sensitivity measures the proportion of actual positives which are correctly identified and is expressed by eq. 1.5.
sensitivity = T P
T P + F N (1.5)
while the specificity index measures the proportion of actual negatives which are correctly identified and is expressed by eq. 1.6.
specif icity = T N
T N + F P (1.6)
The theoretical optimal prediction is to achieve 100% sensitivity and 100% specificity. However, for any test, there is usually a trade-off between these two measures.
ROC curve
Finally another metric used to measure the performance of a classifier is the Receiver Operating Characteristic curve (ROC curve) [37].
The ROC curve is a graphical plot of the sensitivity vs “1 - speci-ficity”, for a binary classifier system as its discrimination threshold is varied.
The ROC curve is a tool which allows to select possibly optimal models while discarding suboptimal ones independently from the cost context or the class distribution.
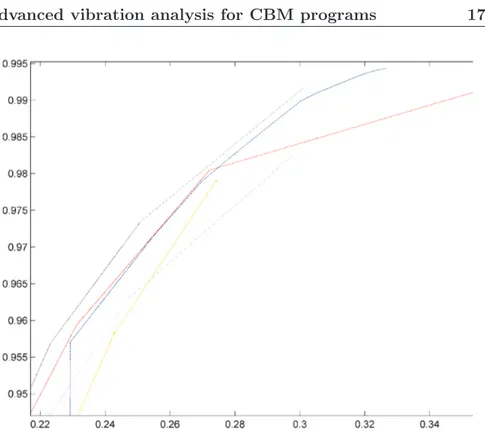
Fig. 1.9 shows some ROC curves related to different classifiers, each of which is represented by a different color.
1.2.3 Methods to test the classification system
If we were able to try the classifier on all possible input objects, we would know exactly how accurate the classifier is [73]. Unfortunately, this is hardly possible, since only a subset (generally a small subset) of all the possible inputs is available. Thus only an estimated accuracy can be evaluated [73]. When a classification process is performed the data are generally divided into two subsets, one called training set which is used during the training process to train the classifier and a test set which is used to evaluate the performance of the classifier on unseen data. There are a lot of different procedures to evaluate the performance of a classifier.
Advanced vibration analysis for CBM programs 17
Figure 1.9 ROC curves related to different classifiers, each of which is represented by a different color.
Resubstitution error method
Denoting with D the whole data set, the simplest procedure to eval-uate the performance of a classifier is based on the evaluation of the resubstitution error, i.e., the error on the training set. This procedure is called resubstitution error method (shortly R-method) and consists in training the classifier C using the whole data set D and then test the classifier again on D [73]. Thus the training and the test set coincide with D (Fig. 1.10).
Figure 1.10R-method to create training and test sets. The train-ing set coincides with the test set and both coincide with the whole original data set.
18 Fundamentals of Pattern Recognition Since training an algorithm and evaluating its performance on the same data may lead to an overoptimistic result [7, 75, 73], other testing methods were introduced such as the cross-validation (CV) algorithm. A general description of the CV strategy has been given by Geisser [43]. The basic idea is that a good estimate of the performance would be obtained using new data to test the classifier, i.e., data different from the training data [7, 43, 88]. The main idea behind CV is to split the data, once or several times, for estimating the performance of a specific model. Once split, a part of the samples is used to train the model, while the remaining samples are used to test the model and thus to estimate its performance. Compared to the R-method, CV avoids the overoptimistic result problem since the training samples are independent from the test samples. The major interest of CV lies in the universality of the data splitting heuristics. It only assumes that data are identically distributed, and training and test samples are independent, which can even be relaxed [7, 73]. This makes the CV algorithm suitable for many applications in many frameworks, such as regression [43, 118], density estimation [112, 118], and classification [8, 29] among many others. However, some CV procedures have been proved to fail for some model selection problems, depending on the goal of model selection, namely, estimation or identification [7, 73]. The issue of how to organize the training and test sets has been around for a long time [73, 131]. Hereafter we summarize some of the most used CV procedures.
Hold-out method
One of the simplest CV procedures is called Hold-out (shortly H-method) [29]. This method relies on a single split of the original data. Part of data (training set) is used for training the algorithm, and the remaining data (test set) are used to evaluate the performance of the algorithm [73]. However no study exists to define how to split the data, i.e., which is the optimal percentage of samples of the original data which should be used to create the training and the test sets (Fig. 1.11). However, generally, the training set is bigger than the test set [7, 73].
In most real applications, only a limited amount of data is avail-able, thus the single split can result in either a training or a test set too small to be significant [73]. This leads to the idea of splitting the data more than once. The idea is that a single data split yields a validation
Advanced vibration analysis for CBM programs 19
Figure 1.11H-method to create training and test sets. The orig-inal data set is split once. One part forms the training set and the other one the test set.
estimate of the performance, then averaging over several splits yields a cross-validation estimate [7]. For example considering the H-method, we can average the performance results related to several experiments based on the H-method, where each experiment corresponds to a dif-ferent data split [7].
K-fold cross-validation
K -fold cross-validation is one of the most used test procedure. The algorithm consists in choosing an integer K (preferably a factor of N , where N is the number of samples in the original data set D) and randomly divide D into K subsets of size NK. Of the K subsets, one is retained as test set, while the others are used as training set. This procedure is repeated K times choosing, each time, a different subset as test set. At the end the whole accuracy is evaluated as the average of the K estimated accuracies.
The question of how to select K is still open, even though indications can be given towards an appropriate choice [73]. When the goal of model selection is estimation, it is often reported that the optimal K is between 5 and 10 [7, 49, 73]. Fig. 1.12 provides an example of K-fold CV with K = 3.
Leave-one-out
Leave-one-out [2, 43, 73, 118] is the most classical exhaustive CV pro-cedure [7].
It consists in a K -fold cross-validation with K = N where N rep-resents the number of objects in the original data set D [73].
20 Fundamentals of Pattern Recognition
Figure 1.12 K-cross validation method to create training and test sets (example with K = 3). The original data set D is ran-domly divided into 3 subsets of size N3, with N the number of objects of the data set. Of the 3 subsets, one is retained as test set, while the others are used as training set. The procedure is re-peated 3 times choosing, each time, a different subset as test set. The whole accuracy is evaluated as the average of the 3 estimated accuracies.
Dietterich’s 5x2cross validation
The Dietterich’s 5x2cross validation method [30] consists in 5 repeti-tions of a 2-fold cross validation. This gives 10 pairs of error (accuracy) estimates which can be successively averaged to compute the final error (accuracy) [73].
1.2.4 Validation set
It is now becoming a common practice to divide the original data set into three sets instead of two [13, 73]:
• training set, • validation set, • test set.
As before, the test set remains unseen during the training process, while the validation data set acts as pseudo-testing.
Advanced vibration analysis for CBM programs 21 Considering for example the training of a neural network classifier, the use of the validation set means to continue the training process until the performance improvement on the training set is no longer matched by a performance improvement on the validation set [13, 73]. At this point the training should be stopped so as to avoid overtraining. Fig. 1.13 represents the typical “evolution” of the training and validation errors of a neural network with the increase of the number of epochs in which the network is trained.
However, not all the data sets are large enough to allow for a vali-dation set to be cut out [73].
Figure 1.13 The training process aims to reduce the resubsti-tution error. When a validation set is used, the training can be stopped when the performance improvement on the training set is no longer matched by a performance improvement on the valida-tion set. The line composed by crosses represents the error on the training set while the line composed by points represents the error on the validation set. In the figure, at a certain point, while the error on the training set is still decreasing, the error on the validation set starts to increase.
Chapter 2
The rolling element bearing
diag-nostic and progdiag-nostic issues
In the middle of difficulty lies opportunity.
A. Einstein
-One of the most important aspects in the domestic and industrial fields is the reliability of the used equipment such as rotating machines which are increasingly used inside these two fields. Furthermore the assessment of these machines is becoming more and more strict as they should meet increasingly demanding performance criteria [1].
Unfortunately, these systems and machines may deteriorate with usage and age [135] bringing even to the breakdown of the system [21, 76, 141, 142]. For these reasons, the maintenance of these systems represents a crucial process and thus the machine maintenance has became an integral part of industrial systems with the aim of reducing costly machine downtime and ensuring production quality.
In the last years, the maintenance issue has been widely investi-gated in the literature [28, 90, 135, 143, 146, 151] and in particular the condition-based maintenance (CBM) [125, 129] has been introduced and widely adopted to detect the onset of a failure [21, 22, 23, 76, 141, 142]. CBM represents the ideal form of maintenance when a failure cannot be prevented, e.g., failures caused by random events. Besides, CBM does not usually cause an intrusion into the equipment, and the actual
24 The bearing diagnostic and prognostic issues preventive action is triggered by the detection of an incipient failure [129]. CBM aims to detect the early occurrence and seriousness of a fault, to estimate the time interval during which the equipment can still operate before failure, and to identify the components (e.g., bearings) that are deteriorating [141].
In particular, CBM exploits condition monitoring information, which consists of the continuous or periodic measurement and interpretation of data that help assess the operating condition of each system compo-nent [141, 146, 147].
In this dissertation we focus on the CBM process of rotating ma-chines [21, 141]. Actually, condition monitoring and fault diagnostics of rotating machinery have become more and more important in many industrial fields from the safety-critical ones to the manufacturing and production ones [58, 61, 77], in order to guarantee the survival of these machines and the reliability of the involved processes. Since fault occur-rence cannot be avoided in the machine, early detection and diagnosis of incipient failures can help prevent the machine breakdown by iden-tifying the presence of symptoms such as increased vibrations, noise and temperature [146]. Thus CBM has been widely and effectively ap-plied to rotating machines [22, 61, 114, 141]. Such machines usually operate by means of bearings, which represent a critical component of the machines themselves so that their state can be profitably used to represent the machine state [146]. The reliable and continuous work of all the bearings is very important as the break of one of them can compromise the proper work of the whole system [22, 23, 76, 141, 142]. However, bearings, even though well designed, often have to bear stress and heavy load which can deteriorate their performance [61] up to a point in which they can compromise the proper work of the machine inside which they are located, bringing to the system breakdown and possibly have catastrophic consequences depending on the field in which they operate [21, 76, 141, 142]. Besides, the faults occurring in rotating machines are often linked to bearing faults [77, 130]. For all these reasons the monitoring and the fault diagnosis of bearings have been widely studied in the literature, in order to make the fault detection as automatic as possible with the purpose of implementing real time maintenance programs [22, 23, 61, 114, 115, 141].
Advanced vibration analysis for CBM programs 25 classification of faults, machine prognosis concerns the automated esti-mation of how soon and likely a failure will occur, including the forecast of the remaining operational life, future state, or probability of reliable operation of an equipment based on the collected condition monitoring data [53, 128]. Prognostics is vital in order to significantly reduce ex-pensive downtime, maintenance costs and safety hazard conditions [53]. However, prognostics is a very wide and new research area which has been little studied [53, 116] compared to the diagnosis issue.
2.1
State of the art
Several methods for the detection and diagnosis of faults in bearings have been developed in the last years [21, 22, 23, 76, 91, 114, 115, 141, 142]. These studies mainly focus on three issues, namely,
1 the choice of the data (i.e., signals) to be collected,
2 the feature selection/extraction algorithm to be adopted to appro-priately decrease the dimensionality of the signal representation space,
3 the classification system used to distinguish between signals cor-responding to faultless bearings and signals associated with faulty bearings, possibly identifying also the specific types and severity levels of defects.
The aim of the first issue is to find the signals that convey useful information regarding early indications of changes in the bearing state [4, 5]. As far as this issue is concerned, the literature presents stud-ies such as vibration analysis, which uses vibration signals emitted by the mechanical system to trace the state of the system itself [120], and infrared thermography, which measures emissions of infrared energy in order to determine the operating condition of the system [125]. Vibra-tion analysis is, however, the most used methodology, probably because it provides the most information from the collected data [58]. Besides, bearings are the best point in the machine where we can measure ma-chine vibrations since they are the place where the basic dynamic loads and forces are applied [143]. Besides, as stated in [80], states vibration analysis is widely used in the bearing diagnosis field for the following reasons [78, 80]:
26 The bearing diagnostic and prognostic issues condition of the machine giving:
• continuous information on the machine state, • continuous information on the machine bearings, • incipient faults are quickly detected,
• it is economically justified,
• the equipment to collect vibration signals, i.e., mainly sensors, is relatively small and portable and thus not intrusive,
• it is generally accurate and reliable.
The three most commonly applied vibration techniques for bearing performance analysis [93] include time domain analysis [114, 115, 143], frequency domain analysis [21, 22, 23, 61, 76, 141, 142], and time-frequency domain analysis [91, 125].
Time domain analysis is usually based on performance indexes such as Root Mean Square (RMS), Kurtosis, and Crest Factor [56, 125], while frequency domain analysis is generally based on the Fast Fourier Transform (FFT) technique [24]. A mixture of the two is adopted in the time-frequency domain allowing for the analysis of signals which are transient or non-stationary. Time-frequency domain methods include Short Time Fourier Transform [68], the Wigner-Ville Distribution [79] and the Wavelet Transform [158].
The main advantage of frequency domain analysis over time domain analysis is its ability to easily identify and isolate certain frequency components of interest, such as the theoretical characteristic frequencies of the defects [20, 61]. Besides indexes such as Crest factor and Kurtosis start to increase as the spikiness of the vibration increases, but, as the damage increases, the vibration signal becomes more random and the values for the Crest factor and Kurtosis reduce to levels that are typical of normal bearings. Thus, the statistical analysis approach based on Kurtosis and Crest factor fails in detecting bearing defects at later stages of their development [92].
The second issue on which the literature has focused its attention is the choice of the most appropriate set of numeric characteristics, or features, used to represent the signals. For good classification, feature selection/extraction is a crucial step as the features represent the con-dition indicators in the classification process. Besides, not all features are meaningful and provide significant information about the machine
Advanced vibration analysis for CBM programs 27 condition. Some of them may be useless or irrelevant [9, 146]. In particular feature selection/extraction aims to find the set of features with the highest discriminant power for classification purposes. Several methods have been proposed including Forward Feature Selection (FFS) [21, 22, 23, 76, 141, 142], genetic algorithms [57, 114, 115, 146], decision trees [120, 146], and Principal Component Analysis (PCA) [56, 121].
As regards the third issue related to the choice of the classifica-tion system, several methods have been adopted including statistical classifiers [21, 22, 23, 141], neural networks (e.g., Multi-Layer Percep-tron neural networks (MLPs) or Radial Basis Function neural networks (RBFs)) [21, 22, 23, 76, 141], Support Vector Machines (SVMs) [109, 110, 157, 159], one class classifiers (e.g., convex hulls) [142], fuzzy-logic-based classifiers [72, 119], and decision tree (such as C4.5) [56, 119].
Besides classifiers can be appropriately combined using mainly two approaches which either select a classifier in a classifier ensemble (clas-sifiers selection strategies) or appropriately combine all the clas(clas-sifiers in the ensemble (classifiers fusion strategies) [22].
As far as the prognostic issue is concerned, even though the litera-ture on this area is continually growing [53], it still presents fewer works [53] compared to the diagnostic issue. Some works and reviews to help clarify this issue can be found in [15, 46, 53, 61, 116, 134, 153], where prognosis has been considered in several different fields and different types of machines, such as paper making machines [15], aircraft engines [153], rotating machines [53, 141].
Of course, prognostics can be considered superior to diagnostics in the sense that prognostics can prevent faults, and if impossible, be ready for the problems in terms of human resources and spare parts, and thus save extra unscheduled maintenance cost [61]. However, prog-nostics cannot completely replace diagprog-nostics since in the reality there are always some types of fault which are not predictable [61]. In addi-tion, prognostics, like any other prediction techniques, cannot be 100% trusted [61]. In the case of unsuccessful prediction, diagnostics rep-resents a useful complementary tool to provide maintenance decision support [61]. Besides, diagnostics can be helpful to improve prognos-tics, i.e., the diagnostic information can be useful for preparing more accurate event data and hence building better CBM models for prog-nostics [61].
28 The bearing diagnostic and prognostic issues In the literature the methods for predicting rotating machinery fail-ures can be grouped into the following three main categories [53]:
1 traditional reliability approaches, 2 prognostics approaches,
3 integrated approaches.
In particular, the first category, traditional reliability approaches, includes the event data based prediction approaches, in the second cat-egory, prognostics approaches, we can find the condition data based prediction methods, while the third category, integrated approaches, in-cludes the prediction based on both event and condition data [53].
2.2
Discussion on the state of the art
Most diagnostic methods found in the literature consider the bearing fault diagnosis as a 2-class problem, since they just distinguish between faultless and damaged bearings independently of the type and/or the severity of the defect. However the knowledge of the type and severity level of the defect can bring valuable information to perform better and defect-oriented maintenance programs. This is why in this dissertation we propose classification techniques which are defect-oriented, i.e., able to recognize both the type and the severity level of the defect.
While the diagnostic problem represents a crucial issue in the main-tenance process, also the prognostic problem represents a very impor-tant task. Actually, even though the diagnostic expert engineers have significant information and experience about machine failure and health states by continuously monitoring and analyzing the machine condition, in the literature, little attention has been paid to the study of the evolu-tion of a defect, that is how a defect evolves over time if a fault compo-nent (such as a bearing) is not repaired or substituted by a faultless one [66, 123, 141]. An effective prognostics program gives the maintenance engineers more time to schedule a maintenance activity to repair and to acquire replacement components before the system further decreases its “health” state [66, 141]. This is the reason why we propose the study of the evolution of a defect as time passes in order to identify how the vibration signals change. This analysis can be profitably used to define prognostic program to detect as soon as possible any incipient defects, as well as to determine the time within which the maintenance, i.e., the substitution of the faulty bearing, should be performed before the
Advanced vibration analysis for CBM programs 29 defect gets too serious.
Furthermore, many methodologies proposed in the literature are not tested on noisy data, so that several diagnostic techniques can perform well in a noise-free environment but very poorly in the presence of noise like in a real environment. For this reason, not only we test our classification techniques on noisy data in order to analyze their robustness to noise, but we also propose some techniques to increase the robustness to noise of the classification systems.
Finally, we also present a one-class classification study on the rolling element bearing diagnosis issue. In fact, in the literature, little atten-tion has been dedicated to the main challenging problem regarding the diagnosis of mechanical equipment: the lack of a significant set of dam-aged data. In general, bearings can develop several types of faults that can be further divided in classes according to the level of severity. It is difficult to collect all types of faults and severities and, then, use them to train a classification system, since it is not possible to identify all the possible types of faults and severity levels, for example an indenta-tion on the roll can be posiindenta-tioned in different parts of a roll and thus it may produce different (vibration) signals. Furthermore, as shown in [141], (vibration) signals can change as time passes making thinner and fuzzier the division of faulty bearings into categories. Thus it is impos-sible to collect and “catalog” an infinite number of faults and severities. Moreover it is often difficult or even impossible to collect data from faulty bearings as it requires to put damaged bearings into the rotat-ing machine causrotat-ing unwanted consequences. For all these reasons the creation of a training set for the damaged samples can be either expen-sive or impractical and thus difficult to achieve. On the other hand, it is relatively cheap and simple to obtain measurements from faultless bearings and thus from a normally functioning machine.
However, most of the techniques presented in the literature deal with the bearing fault diagnosis as a two-class problem involving only data associated to pre-specified faults and severities regardless of all the “possible” types of fault and levels of severity they were not able to collect. Unfortunately, in real and practical cases, it is quite un-likely that a trained classification system will have to cope with only the known faults and severities (i.e., faults and severities used to train the classification system). On the contrary, it is very common that the
30 The bearing diagnostic and prognostic issues classification system will have to cope with unknown faults and sever-ities (i.e., faults and seversever-ities not used during the training process). Thus, even though some techniques can achieve very high accuracies on known faults/severities, they may perform very poorly on unknown faults/severities as shown in [142]. This is why, in contrast with most of the approaches proposed in the literature, we decided to develop a classification system which is able to generalize the problem and thus correctly classifies also damaged samples belonging to types of fault and levels of severity not used during the training process. For this reason we have decided to approach this classification problem as a one-class classification problem. This way, we achieve independence from the spe-cific damaged samples we were able to collect to train our classification system and, thus, we are able to develop a more general classifier that can reach a good accuracy not only for known but also for unknown faults/severities.
Finally, as far as the prognostic issue is concerned, since prognosis involves projecting into the future and that the future cannot be de-termined with absolute certainty, assumptions and simplifications are generally inevitable when prognostics models are designed [53]. How-ever, these assumptions should be carefully checked [53].
While the study of the bearing prognosis has been concentrated in finding out how to forecast the state of the machine basing the study on more or fewer assumptions, little attention has been given to analyze how faults can develop through the time, that is how a defect evolves over time if the damaged bearing is not substituted by a faultless one. This issue is extremely important since the presence of a fault does not necessarily means that the machine is not able to continue to work, at least for another amount of time, thus is can be useful to start from a condition in which we already know that the bearing is damaged and then use this information to forecast within which amount of time the bearing must be changed in order to avoid the machine downtime.
Thus, in this dissertation we will aim to find out how the vibration signals coming from a faulty bearing evolve if the bearing itself is not substituted immediately. This means, e.g., to study if the severity level of the bearing increases and, possibly, after how much time. Besides, we wish to analyze if, after a certain amount of time in which a damaged bearing continues to work, we can consider it equivalent to a bearing