Scuola Dottorale EDEMOM
European Doctorate in Electronic Materials, Optoelectronics and Microsystems
Doctor of Philosophy Course In Electronic Engineering - XXV Ciclo
Hylemetric Techniques for Data and
Information Security
Dr. Lorenzo Cozzella
Tutor
Prof. Giuseppe Schirripa Spagnolo
Coordinator
Prof. Giuseppe Schirripa Spagnolo
Acknowledgments
This work is dedicated to my family, always present and near to me, giving me the necessary force to go ahead along this hard walk. In particular I want to dedicate all the results to my wife Carla, who has made this journey with me, sharing all the successes and the defeats.
A special thanks to my Professor, and Tutor Schirripa Spagnolo, whom has given to me this opportunity and all his effort to support me in this adventure, becomes, in over ten years of collaborations, part of my family, allowing me to reach these professional goal, which I try to obtain with force and, sometimes, obstinacy. In particular I have to thanks the patience of Professor Schirripa when hundreds times I’ve requested to recheck formulas, figures and strange ideas which jump out of my mind.
Abstract
The proposed research is based on past years studies on innovation in biometric systems, which has led to verifying how, in all the biometry approach, exists a similar approach, defined in the research Biometry Paradigm, which is based on the identification and utilization of particular characteristics, having the properties to be univocal and measurable. Typical examples are fingerprint, iris, retina, hand geometry, face and so on. Starting from this consideration, we have tried to verify if a similar approach could be applied to valuable objects, such as banknotes, artworks, identification documents and, in general, to all the objects which have the necessity to be verified to fight against their counterfeiting. The research work was based on the identification of some characteristics, which can be measured in a non-destructive way, inside some notable case studies, such as banknotes, passports, drug packages, lithography, with the aim to create a method, starting from the past experience in the biometric analysis, which allows to verify with a great accuracy objects’ authenticity. The methods developed in this research have been defined as Hylemetric Authentication, from Greek words ὕλη (hyle), for inanimate objects and μετρον (metros) for measurement.
The study started from the analysis of the existing solutions adopted to put in secureness banknotes, documents, artworks’ certificates and drug packages. Starting from this analysis, in each case study, has been possible identify a set of different security systems and approach. In particular it is possible define two categories of security approach:
Overt Authentication/Identification System, visible at human eye and verifiable in a simple manner by the final utilizer.
under particular environmental conditions and/or using particular instrumentations.
Typical examples of overt systems are holograms and intaglio printing on banknotes, shifting and changing inks, used on pharmacologic packages. Covert systems are typically ultraviolet inks, infrared patterns and so on, used always on banknotes.
Sometimes are also proposed mixed systems, such as 1D and 2D barcodes, which at first analysis can be considered as overt systems, but the necessity to use dedicated and sometimes also complex decoding systems, allows to catalogue it as mixed system; in fact its presence is sometimes considered as proof of originality, but in reality the originality can be proven only analyzing the content of the barcode, which sometimes results encrypted.
Focusing on research case studying, banknotes presents both overt and covert solutions, whereas drugs packages are in general characterized by overt or mixed ones. Lithography and artworks in general have been authenticated using only paper certificate of authenticity, without any automatic or semi-automatic verification system. In any case this approach can be categorized as overt, because the presence of a Certificate of Authenticity with signature and stamp on it, is generally considered sufficient to be sure on the artwork originality.
Starting from this state-of-art, the research has tried to verify the possibility to apply the biometric approach to these case studies, with the aim to enforce the authentication and anti-counterfeiting process with an innovative solution. For making this, the first step is the identification, for each case study, of at least one univocal characteristic, present on the analyzed object at priori (e.g. Banknotes security fibres), or added on it (e.g. white light speckles added on drug packages), which has the requested requirements to be categorized as Hylemetric
Hylemetric approach, has to have the following basic properties:
Uniqueness: every objects should be identifiable and distinguishable from all others;
Consistency: feature vector should be verifiable by multiple parties over the lifetime of the object;
Conciseness: feature vector should be short and easily computable;
Robustness: it should be possible to verify the feature vector even if the object has been subjected to harsh treatment;
Resistance to Forgery: it should be very difficult and costly, or impossible for an adversary, to forge a document by coercing a second object to express the same feature vector as the original one.
For any of the case study analyzed during the research course, it has been possible to identify proper characteristics which have all these properties. The acquisition of them changes from object to object, has in biometry paradigm, depending on the object physical characteristics, but the verification approach is similar for all the analyzed ones.
In banknote case, we have used metallic security fibres as Hylemetric characteristic. They have the physical property to shine in the visible spectrum when illuminated by ultraviolet light at a precise wavelength. We have acquired the fibres distribution, creating a unique identification pattern based on them. This pattern has been encrypted and then coded in a bidimensional barcode, based on DataMatrix ECC 200 Standard. The proposed encryption has been made by means of Elliptic Curve, to reduce dimensions of pattern encrypted version and cope with DataMatrix maximum storage constraint.
For artworks in general, we have made some experiments on lithography and then on oil and statue. The proposed approach has to modify the Certificate of
digital version of it. All the modifications are based on the extraction of an Hylemetric characteristic from the artwork. In Lithography case, the typical stone impression leave a unique grain pattern, acquirable using a digital camera. For oil paints and statue using particular image manipulations and filters is possible from the acquired image obtaining a speckle-like pattern from the object structure. Analyzing the pharmacologic products packaging, we have decided to add on them the Hylemetric characteristic, using the so called White Light Speckle technique. We have used ultraviolet ink sprayed on a package’ particular area. In this way each package has been stamped with a different Speckle Pattern.
In any studied cases, independently from the acquired characteristic, has been possible defining a Hylemetric Template, which allows to authenticate the related object. In some cases the defined template has been converted into a 2D Barcode to be directly put on the object (e.g. banknotes, drug packages), or has been codified to be inserted in a Digital Certificate of Authenticity (e.g. artworks). In the case of barcodes, we have used both standard DataMatrix, or a new 2D Barcode based on Computer Generated Holograms, defined HoloBarcode. In some case the barcode has been proposed to be put on the object using infrared ink, to maintain the original object aspect and to increase the system security as well. The usage of infrared ink starting from the necessity to put it on banknotes, plenty of visible and invisible security artefacts. The infrared band is empty on over the 80% of the banknote surface in both sides and it is possible to find the proper area where to put the barcode.
Otherwise, the introduction of a non-standard bidirectional barcode, based on CGH, has been proposed in such cases where the object to be analysed can be heavily manipulated and ruined. HoloBarcode has the great advantage to be highly resistant to loss of information (i.e. loss of part of the barcode area) and to offer
barcode. However, the storage capacity of these barcodes is very poor, if compared with standard 2D Barcodes with same dimensions.
In conclusion, during this research we have analysed the state-of-art of security features applied to valuable objects. Then, starting from a biometric approach, has been proposed an Hylemetric paradigm, which allows to authenticate objects starting from their intrinsic characteristics. We have made tests on different type of objects, such as banknotes, passports, lithography, oil paints, drug packages, obtaining in any case the correct definition of a Hylemetric Procedure, similar in any case, and a Hylemetric Template to be used in verification phase. After that we have also proposed a new bi-dimensional barcode, based on Synthetic Holograms, to be used in particular cases instead of Standard ones to store the Hylemetric Template for offline verification activities.
Author’s Bibliography
The following bibliography lists all the papers written with the author contribution during PhD course. It is subdivided into two sections: papers strictly related to research activities, published on International Journals, International Congresses or National Journals as well; papers written with Author contribution, but on arguments near or out of the scope of the PhD research activities.
PhD Related Pubblications
G. Schirripa Spagnolo, L. Cozzella, C. Simonetti, “Hylemetry versus Biometry: a new method to certificate the lithography authenticity”, Proceedings SPIE, 8084, 80840S, 2011.
G. Schirripa Spagnolo, L. Cozzella, and C. Simonetti, “Banknote security using a biometric-like technique: a Hylemetric approach”’, Meas. Sci. Technol., Vol. 21, 055501, 2010.
G. Schirripa Spagnolo, L. Cozzella, and C. Simonetti, “Currency Verification by 2D Infrared Barcode”, Meas. Sci. Technol., Vol. 21, 107002, 2010.
L. Cozzella, C. Simonetti, and G. Schirripa Spagnolo, “It is possible to use biometric techniques as authentication solution for objects? Biometry vs.. Hylemetry”, IEEE Proc. of 5th International Symposium on Communications Control and Signal Processing (ISCCSP), 10.1109/ISCCSP.2012.6217753, 2012.
M. De Santis, L. Cozzella, G. Schirripa Spagnolo, “New 2D Barcode solution based on Computer Generated Holograms: Hologhaphic Barcode”, IEEE Proc.
Processing (ISCCSP), 10.1109/ISCCSP.2012.6217831, 2012.
L. Cozzella, C. Simonetti, and G. Schirripa Spagnolo, “Banconote verifica tramite approccio biometrico”, ICT Security Gennaio 2011, 2011.
Lorenzo Cozzella, Carla Simonetti, and Giuseppe Schirripa Spagnolo, “Drug packaging security by means of white-light speckle”, Optics and Lasers in Engineering, Vol. 50(11), 1359–1371, 2012.
G. Schirripa Spagnolo, C. Simonetti, and L. Cozzella, “Watermarking di immagini tramite olografia sintetica”, Proc. Elettrottica 2004, Pavia 15-17 giugno 2004, pp. 298-301, 8° convegno nazionale AEI “Strumentazione e metodi di misura elettroottici” Elettroottica 2004, 2004.
G. Schirripa Spagnolo, C. Simonetti, and L. Cozzella, “Fragile digital watermarking by synthetic holography”, Proc. Optics/Photonics in Security and Defence SPIE Symposium, London 24-28 October 2004, Proc. SPIE vol.5615, 173-182, 2004.
G. Schirripa Spagnolo, C. Simonetti, and L. Cozzella, “Image authentication by means of fragile CGH watermarking”, Proc. Optics and Optoelectronics SPIE Conference, Warsaw 29 August 2-September 2005, Proc. SPIE vol.5954, 2005.
Other Pubblications
G. Schirripa Spagnolo, C. Simonetti, L. Cozzella, “IR Fringe Projection for 3D Face Recognition”, Proceeding of International Conference on Advanced Phase Measurement Methods in Optics and Imaging, Locarno, 2010.
G. Schirripa Spagnolo, C. Simonetti, L. Cozzella, “Autenticazione di documenti di identità tramite watermarking fragile”, Safety and Security, 2010.
binary diffractive optical elements for beams performing”, Proc. SPIE 8306, 83060X, 2011, doi:10.1117/12.912311
G. Schirripa Spagnolo, D. Papalillo, A. Martocchia, L. Cozzella, “Simple educational tool for digital speckle shearography”, Eur. J. Phys. 33 733 doi:10.1088/0143-0807/33/4/733, 2012.
G. Schirripa Spagnolo, C. Simonetti, and L. Cozzella, “Superposed strokes analysis by conoscopic holography as an aid for a handwriting expert”, J. Opt. A: Pure Appl. Opt. 6, 869-874, 2004.
G. Schirripa Spagnolo, C. Simonetti, and L. Cozzella, “Content fragile watermarking based on a computer generated hologram coding technique”, J. Opt. A: Pure Appl. Opt. 7, 333-342, 2005.
G. Schirripa Spagnolo, L. Cozzella, and C. Simonetti, “Un Laser per il riconoscimento delle firme”, ICT Security Luglio-Agosto 2009, 19-23, 2009. G. Schirripa Spagnolo, L. Cozzella, and C. Simonetti, “Determination of the
sequence of line crossings by means of 3D laser profilometry”, SPIE Conference, Warsaw 29 August 2-September 2005, Proc. SPIE vol.5954, 2005. G. Schirripa Spagnolo, L. Cozzella, and C. Simonetti, “Measurement of mass diffusion coefficients by digital moiré”, SPIE Conference, Warsaw 29 August 2-September 2005, Proc. SPIE vol.5954, 2005.
Giuseppe Schirripa Spagnolo, Lorenzo Cozzella, Carla Simonetti, “Linear Conoscopic Holography as aid for Forensic Handwriting Expert”, Optik, Available online, 2012, doi: 10.1016/j.ijleo.2012.06.097.
Giuseppe Schirripa Spagnolo, and Lorenzo Cozzella, “Laser speckle decorrelation for fingerprint acquisition”, J. Opt., Vol. 14(9), 094006, 2012, doi:10.1088/2040-8978/14/9/094006
Table of Contents
ACKNOWLEDGMENTS I ABSTRACT III AUTHOR’S BIBLIOGRAPHY IX PHDRELATED PUBBLICATIONS IX OTHER PUBBLICATIONS XTABLE OF CONTENTS XIII
LIST OF FIGURES XIX
LIST OF TABLES XXIX
LIST OF ACRONYMS XXXI
CHAPTER 1 MOTIVATIONS 33
1.1 INTRODUCTION 34
1.1.1 TERMINOLOGY 37
1.1.1.1 Physical and Logical Access 37
1.1.1.2 Authentication and Identification 38
1.1.1.3 Physical and Behavioral Biometry 39
1.1.1.4 Interactive and Passive Biometry 39
1.1.1.5 Positive and Negative Verification 40
1.2.3 IDENTIFICATION PHASE 44
1.3 PERFORMANCE EVALUATION 44
1.3.1 FRR,FAR AND ROCCURVE 45
1.3.2 USER TYPOLOGY 48
1.3.3 EQUAL ERROR RATE (ERR) 49
1.3.4 IDENTIFICATION RATE RK 54
1.4 KINDS OF BIOMETRIC SYSTEMS 55
1.4.1 FINGERPRINTS 55 1.4.2 FACE 56 1.4.3 HAND GEOMETRY 57 1.4.4 PALMPRINT 57 1.4.5 IRIS 58 1.4.6 RETINA 59 1.4.7 KEYSTROKE 60 1.4.8 SIGNATURE 60 1.4.9 VOICE 61 1.4.10 GAIT 62 1.4.11 BIOMETRY COMPARISON 63
1.5 BIOMETRIC PARADIGM APPLIED TO LIFELESS MATTER 65
CHAPTER 2 STATE OF THE ART 71
2.1 INTRODUCTION 72
2.1.1 OVERT (OR DIRECT)SECURITY 73
2.1.2 COVERT (OR INDIRECT)SECURITY 74
2.2 BANKNOTE AND DOCUMENT SECURITY SOLUTION 74
2.2.1 PAPER WATERMARKING 76
2.2.2 SECURITY PRINTING 79
2.2.2.1 Intaglio Printing - Latent Image Effect 79
2.2.2.2 Letterpress 81
2.2.2.6 Microprint 86
2.2.2.7 UV-Print 86
2.2.2.8 See-Through Register 87
2.2.2.9 Digital Security Print in a Photograph 88
2.2.3 PERFORATION 89
2.2.3.1 Mechanical Perforation and Laser Perforation 89
2.2.3.2 Micro-Perforation 90
2.2.3.3 Perforated Picture 91
2.2.4 DIFFRACTIVE SECURITY ELEMENTS 91
2.2.4.1 Holographic Elements 92
2.2.4.2 Kinegram® 94
2.2.5 SECURITY ELEMENTS INSERTION 95
2.3 ARTWORKS SECURITY 96
2.4 DRUG PACKAGE SECURITY FEATURES 98
2.4.1 OVERT (OR DIRECT)SECURITY SOLUTIONS 100
2.4.1.1 Holograms 101
2.4.1.2 Colour-Shift Inks 102
2.4.1.3 Barcoding 103
2.4.1.4 Radio Frequency Identification (RFId) 104
2.4.2 COVERT OR INDIRECT SECURITY SOLUTIONS 105
2.4.2.1 UV Inks and Print 105
2.4.2.2 Colour and UV Micro-text Print 106
2.4.2.3 Taggant Authentication 107
2.4.2.4 Laser Surface Authentication – LSA 108
2.4.2.5 Physical Unclonable Function – PUF 109
2.4.3 COMBINING OVERT AND COVERT TECHNOLOGIES 110
CHAPTER 3 HYLEMETRIC PARADIGM 111
3.1 INTRODUCTION 111
3.4 BIDIMENSIONAL BARCODE 116
3.4.1 PDF417BARCODE 118
3.4.2 AZTEC CODE 122
3.4.3 QRCODE 130
3.4.4 DATA MATRIX ECC200 137
3.4.4.1 Technical Characteristics 139
3.4.4.2 Error Correction in ECC 200 145
CHAPTER 4 HYLEMETRIC APPLICATIONS 147
4.1 INTRODUCTION 147
4.2 BANKNOTE VERIFICATION BY HYLEMETRIC APPROACH 148 4.2.1 BANKNOTE VERIFICATION ENHANCEMENT BY IRBARCODE 164
4.3 ARTWORKS HYLEMETRIC AUTHENTICATION 173
4.3.1 OIL PAINTING AUTHENTICITY CASE STUDY 182 4.3.2 LITHOGRAPHY DIGITAL CERTIFICATE OF AUTHENTICITY CASE STUDY 186
4.4 DRUG PACKAGE AUTHENTICATION 203
4.4.1 WHITE LIGHT SPECKLE HYLEMETRY 205
4.4.1.1 UV Speckle PUF Template 210
4.4.1.2 Verification Phase 217
4.4.1.3 Analysis and Results 220
4.4.2 HOLOGRAPHIC BARCODE 229 4.4.2.1 Experimental results 235 CHAPTER 5 CONCLUSION 241 5.1 INTRODUCTION 241 5.2 FUTURE PERSPECTIVES 242 APPENDIX A BIBLIOGRAPHY 243
List of Figures
FIGURE 1.1–BIOMETRIC PROCESS SCHEMA.ENROLLMENT, IDENTIFICATION AND AUTHORIZATION PHASES ARE CLEARLY REPORTED AND LINKED EACH OTHER. ... 42 FIGURE 1.2–BIOMETRIC SYSTEM PERFORMANCE CAN BE SUMMARIZED USING DET AND ROC CURVES.IN THESE TWO EXAMPLES ARE SHOWN IN (A) A DETCURVE RELATED TO FRR VS..FAR, AND, IN (B) THE SAME RATIO EXPRESSED USING A ROCCURVE ON LINEAR SCALE.THE TWO EXAMPLES ARE RELATED TO FACE-G MATCHER SCORES PERFORMANCE TEST USING NISTBSSR1 DATABASE [11] ... 48 FIGURE 1.3–PROBABILITY DISTRIBUTIONS FOR IMPOSTORS AND GENUINE USERS.IT HAS PUT IN EVIDENCE THAT,
GIVEN A THRESHOLD Φ, IT IS POSSIBLE TO DEFINE THE GENUINE USERS PERCENTAGE REFUSED BY THE SYSTEM (FRR CYAN AREA) AND THE PERCENTAGE OF IMPOSTOR USERS WHICH GRANT ACCESS TO THE SYSTEM (FAR ORANGE AREA).THE INTERSECTION POINT BETWEEN THE TWO PROBABILITY CURVES IDENTIFIES THE THRESHOLD VALUE ABLE TO GIVE THE EER.ALSO D-PRIME (OR D’) IS CLEARLY
IDENTIFIED IN THIS FIGURE. ... 53 FIGURE 1.4–IN (A)FAR AND FRR ARE SHOWN AT THRESHOLD Φ VARYING.IT HAS TO BE NOTED THAT THE TWO
CURVES INTERSECTION IDENTIFIES THE ERR, WITH THE RELATED ΦEER THRESHOLD VALUE.IN (B) THE ROC CURVE RELATED TO THE PREVIOUS FAR AND FRR CURVES IS SHOWN. ... 53 FIGURE 1.5–IRIS IMAGES ACQUIRED USING DIFFERENT SENSORS.IT HAS TO BE NOTED THE DETAIL OF THE HIGH
DISTINCTIVE IRIS PATTERN. ... 59 FIGURE 1.6–BANKNOTE IMAGE ACQUIRED UNDER ULTRAVIOLET ILLUMINATION.IT HAS SIMPLE TO NOTICE THE
RANDOM SECURITY METALLIC FIBRE S DISTRIBUTION INSIDE THE IMAGE. ... 67 FIGURE 2.1–MODERN DANDY ROLL EXAMPLE USED FOR PRINTING WATERMARKS ON PAPER IN LIGHT WAY. ... 78 FIGURE 2.2–PAPER WATERMARKING EXAMPLES.IN PARTICULAR IN (B)50EURO BANKNOTE WATERMARK IS
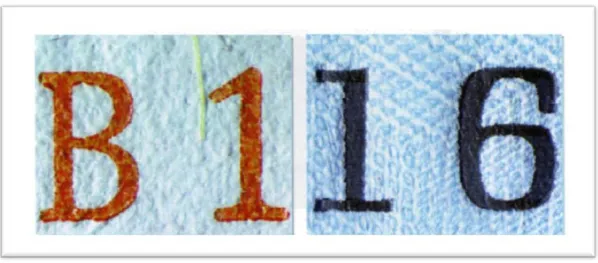
FIGURE 2.3–EXAMPLE OF INTAGLIO PRINTING SHOWS A CLEARLY VISIBLE AND PHYSICALLY PERCEPTIBLE INK COATING. ... 80 FIGURE 2.4–THE USE OF A CORRESPONDING DESIGN IN ASSOCIATION WITH INTAGLIO PRINT ALLOWS THE PRINTING
AND, AS A RESULT, THE DETECTION OF A PICTURE OR TEXT, WHICH WOULD OTHERWISE REMAIN HIDDEN (LATENT IMAGE/ TILT EFFECT IN A CZECH REPUBLIC PASSPORT). ... 81 FIGURE 2.5–PICTURE OF A “NOVEL” NUMBERING BOX. ... 82 FIGURE 2.6–TYPICAL LETTERPRESS CHARACTERISTICS ARE DOT FRINGES (LEFT) AND/OR THE RELIEF-LIKE IMPRESSION
IN THE PAPER (RIGHT). ... 82 FIGURE 2.7–GUILLOCHES ON A SWISS BANKNOTE. ... 83 FIGURE 2.8–RAINBOW PRINT ALLOWS A SMOOTH TRANSITION OF COLOURS. ... 84 FIGURE 2.9–THE €50 BANKNOTE'S DENOMINATION FIGURE, PRINTED IN OVJ® INK, REFLECTS DIFFERENT COLOURS
DEPENDING ON THE ANGLE OF THE OBLIQUE LIGHT. ... 85 FIGURE 2.10–SPECIFIC CHARACTERISTIC OF IRISAFE® IS THE PEARLY SHINE; SEEN HERE IN AN EXAMPLE OF THE SWISS
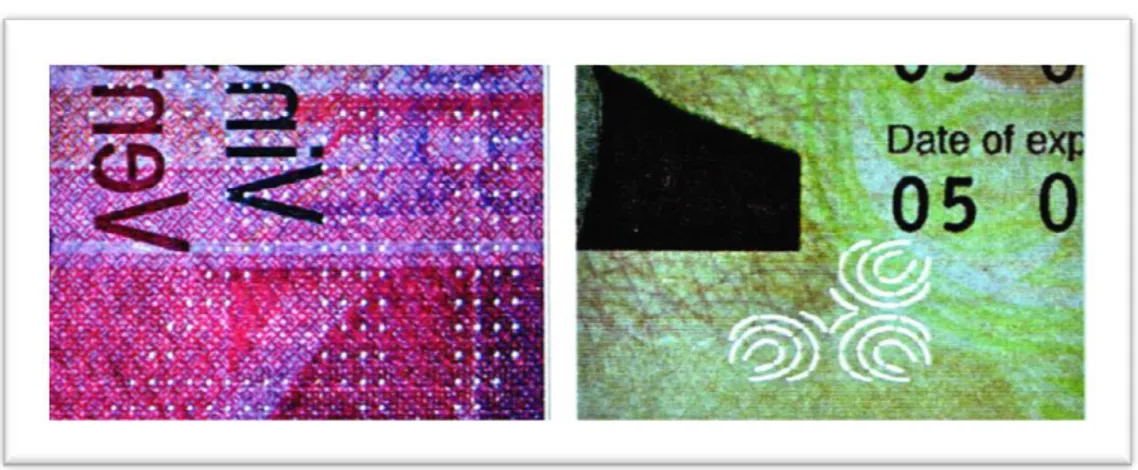
VEHICLE REGISTRATION DOCUMENT. ... 85 FIGURE 2.11–EXAMPLES OF A MICROPRINT IN KINEGRAM®(LEFT) AND IN INTAGLIO PRINT (RIGHT). ... 86 FIGURE 2.12–THE FLUORESCENT OVERPRINT IS OFTEN POSITIONED OVER THE BIOGRAPHICAL ENTRIES, TO HELP
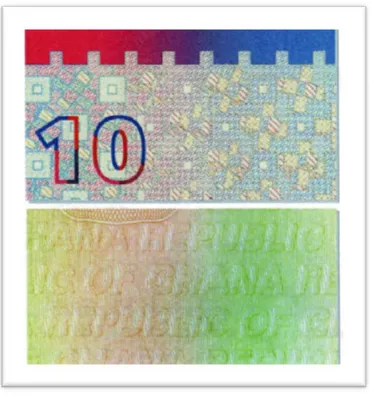
RECOGNITION OF SPOT MANIPULATIONS.HERE A PHOTO OF THE SWISS ID CARD IN DAYLIGHT (LEFT) AND UNDER UV-LIGHTING (RIGHT). ... 87 FIGURE 2.13–THE FRONT PART OF THE SUBJECT UNDER NORMAL LIGHT (ABOVE LEFT) IS PRINTED PRECISELY OVER.
THE BACK SIDE (BELOW LEFT) THUS CREATING A WHOLE MOTIF.THIS IS VISIBLE UNDER TRANSMITTED LIGHT (RIGHT). ... 88 FIGURE 2.14–A SPECIAL DIGITAL PRINT ALLOWS DATA TO BE ENCODED INTO AN IMAGE.WITHOUT THE USE OF A
SPECIAL DEVICE, THE INFORMATION IS NOT SEEN ( LEFT).USING A DECODING LENS, THE INFORMATION BECOMES VISIBLE (RIGHT) ... 89 FIGURE 2.15–THE PERFORATED NUMBERS ARE PUNCHED OUT (LEFT) OR LASERED (RIGHT) INTO THE DOCUMENT IN
FIGURE 2.16–IMAGES OF A SWISS BANKNOTE WITH MICROPERFTM(LEFT) AND A BRITISH PASSPORT WITH
DESTRIPERFTM(RIGHT) SEEN UNDER TRANSMITTED LIGHT. ... 90 FIGURE 2.17–THE PERFORATED IMAGE IS A VERY SOPHISTICATED SECURITY ELEMENT WHICH IS SIMPLE TO VERIFY IN
TRANSMITTED LIGHT.THE SWISS PASSPORT BIOGRAPHICAL PAGE IN AN OVERVIEW (LEFT) AND IN A CLOSE-UP OF THE IMAGEPERFTM PICTURE (RIGHT). ... 91 FIGURE 2.18–EXAMPLE OF 100€ BANKNOTE HOLOGRAM.(A) IS THE IMAGE OF THE BANKNOTE AREA AND (B) IS THE
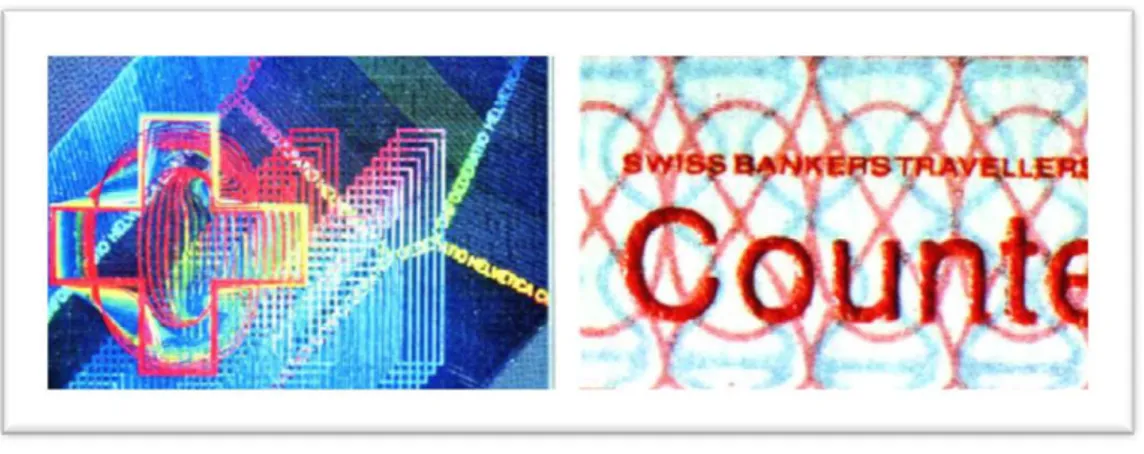
SAME AREA WITH THE HOLOGRAM HIGHLIGHTED, AFTER BANKNOTE ILLUMINATED WITH A DIFFERENT ANGLE. ... 93 FIGURE 2.19–TYPICAL FOR THE HOLOGRAM IS THE SUBJECT'S THREE-DIMENSIONAL REPRODUCTION.THE
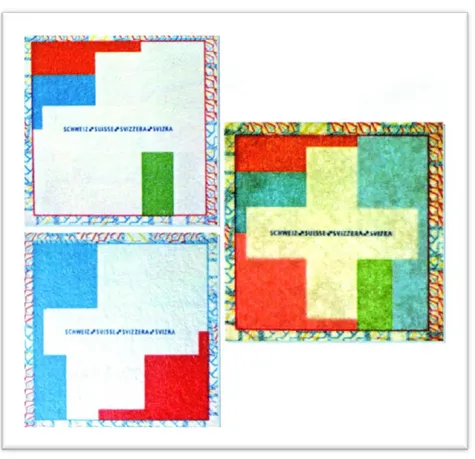
MASTERCARD EXAMPLE SHOWS AN ADDITIONAL COLOUR CHANGE WHEN THE ANGLE OF DIRECT LIGHT IS VARIED. ... 93 FIGURE 2.20–METALLIC KINEGRAM® IN AN EXAMPLE OF THE SLOVENIAN PASSPORT. ... 94 FIGURE 2.21–BY CHANGING THE ANGLE OF INCIDENT LIGHT OR VIEWING, A TWO-DIMENSIONAL PICTURE OF MOVING STRUCTURES AND CHANGING COLOURS CAN BE DEPICTED. ... 95 FIGURE 2.22–THE DIFFERENCE BETWEEN REAL COLOUR SECURITY FIBRE S IN A CANADIAN PASSPORT (A) AND
IMITATIONS IN THE FORGERY (B) CAN BE EASILY SEEN BY USING A MAGNIFYING GLASS. ... 96 FIGURE 3.1–EXAMPLE OF QR CODE. ... 117 FIGURE 3.2–EXAMPLE OF PDF417 CODEWORDS AREAS. ... 120 FIGURE 3.3–(A)EXAMPLE OF AZTEC BARCODE;(B) THE CORE OF THE FULL AZTEC CODE IS COMPOSED BY 40 BITS
BETWEEN THE ORIENTATION MARKS FOR ENCODING PARAMETERS CODEWORDS AREAS. ... 123 FIGURE 3.4–EXAMPLE OF CREATION OF AZTEC BARCODE DATA: MESSAGE DATA ARE PLACED IN A SPIRAL PATTERN
AROUND THE CORE.THE MODE MESSAGE BEGINS “01011100”, INDICATING 01₂+12 LAYERS, AND 011100₂+1=29 DATA CODEWORDS (OF 6 BITS EACH). ... 126 FIGURE 3.5–6-LAYER (41×41)AZTEC CODE SHOWING REFERENCE GRID. ... 129 FIGURE 3.6–EXAMPLES OF DIFFERENT SIZE QRCODES:(A)21X21;(B)33X33;(C)57X57;(D)177X177. ... 132 FIGURE 3.7–EXAMPLE OF QR CODE PRINTED ON PAPER AND RUINED.IT IS STILL POSSIBLE EXTRACTING INFORMATION FROM IT, DUE TO THE LEVEL OF ERROR CORRECTION. ... 134
FIGURE 3.8–QRCODE GRID CREATION TO DETERMINE ERROR CORRECTION LEVEL PATTERN ORIENTATION AND SCALE AND PATTERN MASK. ... 135 FIGURE 3.9–CHARACTER POSITION INSIDE QRCODE MATRIX. ... 136 FIGURE 3.10–MANAGEMENT OF GREAT DIMENSION SYMBOLS INSIDE THE QR CODE MATRIX, WITH THE RELATED
ERROR CORRECTION CODES. ... 137 FIGURE 3.11–(A)FINDER PATTERN USES FOR DETERMINE POSITION, ORIENTATION AND SCALE;(B) DATA PATTERN
ENCODED FOLLOWING ECC200 STANDARD. ... 139 FIGURE 3.12–QUANTITY OF DATA ENCODED IN A SQUARE DATA MATRIX IN RELATION TO THE BARCODE DIMENSION.
... 141 FIGURE 3.13–SYMBOL SIZE VS..DATA REGION DIMENSION. ... 144 FIGURE 4.1–EXPERIMENTAL SETUP FOR DETECTION OF METALLIC COLOR FIBRES. ... 151 FIGURE 4.2–10EURO BANKNOTE IMAGE ACQUIRED USING UV LIGHT SOURCE.IT IS POSSIBLE TO SEE THE RANDOM
DISTRIBUTION OF METALLIC SECURITY FIBERS. ... 152 FIGURE 4.3–PARTICULAR OF THE SAME 10EURO BANKNOTE, WITH SUPERPOSED A CONTROLLING GRID.THE
ALGORITHM ASSIGNS A VALUE OF 1 TO EACH CELL IN WHICH IS PRESENT ONE OR PART OF A FIBRE. .. 154 FIGURE 4.4–FFR AND FAR CURVES;EER IDENTIFIES THE THRESHOLD TO BE USED IN THE VERIFICATION PROCEDURE.
IT HAS TO BE NOTED THAT THE FAR CURVE SEEMS TO HAVE A NON STANDARD SLOPE BECAUSE OUR STUDIES ARE LIMITED AT TEMPLATE DIFFERENCE UNDER 2%. ... 156 FIGURE 4.5–SPECIMENS USED IN TEST STEP:(A)5EURO BANKNOTE WITH SECURE FIBERS HIGH DENSITY;(B)10
EURO BANKNOTE WITH SOME SHADOWS;(C)20EURO BANKNOTE WITH HIGH EXPOSURE;(D)50EURO BANKNOTE WITH SECURE FIBERS MEDIUM DENSITY. ... 159 FIGURE 4.6–(A) A 20€ NOTE UV IMAGE IN GRAYSCALE;(B) THE OUTPUT OF THE MORPHOLOGIC TRANSFORMATION
ON THE PREVIOUS IMAGE;(C) THE RELATED CONTROLLING GRID AND (D) THE SUPERPOSITION OF IMAGE (B) AND (C). ... 160 FIGURE 4.7–A10EURO NOTE WITH THREE INCREASING RUINED AREAS:(A) AND (B) ARE STILL RECOGNIZED DUE TO
FIGURE 4.8–TWO DIFFERENT 20EURO NOTE WHICH SHOW HOW DIFFERENT CAN BE THE SECURITY FIBERS
DISTRIBUTION IN SIMILAR BANKNOTES. ... 163 FIGURE 4.9–20EURO BANKNOTE IMAGE ACQUIRED USING UV LIGHT SOURCE WITH SUPERPOSED THE CONTROL GRID AND THE RESULTING DECIMAL TEMPLATE. ... 167 FIGURE 4.10–VIRTUAL EXAMPLE OF 20EURO BANKNOTE WITH TWO IR2D BARCODE SUPERPOSITION. ... 169 FIGURE 4.11–SUMMARIZATION OF ALL THE DESCRIBED METHOD STEPS, BOTH FOR CREATING THE 2D BARCODE AND
VERIFYING BANKNOTES. ... 171 FIGURE 4.12–THE LOSS OF THE SINGULAR HIGHLIGHTED FIBER LEADS TO A DIFFERENT TEMPLATE, IN ONE OR MORE
ELEMENTS, FROM THE INFORMATION EXTRACTED BY IR BARCODE.IN THIS SITUATION, THE BANKNOTE CAN BE RECOGNIZED AS GENUINE OR NOT IN RELATION WITH THE SELECTED VERIFICATION THRESHOLD. ... 172 FIGURE 4.13–(A) OIL PAINT;(B) STONE LITHOGRAPHY (C) SCULPTURE.ARE HIGHLIGHTED THE RELATED VERIFICATION AREAS AND THE EXTRACTED HHPS. ... 175 FIGURE 4.14–(A) OIL PAINTING WITH HIGHLIGHTED THE SELECTED VERIFICATION AREA;(B) AUTHENTICATION AREA
WITH TRUST POINTS;(C) AREA ACQUIRED DURING VERIFICATION PHASE, WITH HIGHLIGHTED USED TRUST POINTS;(D)HYLEMETRIC HASH PATTERN RELATED TO (C) AFTER GEOMETRICAL CORRECTIONS. ... 177 FIGURE 4.15–COMPLETE SCHEMA SHOWING THE ARTWORK VERIFICATION PHASE. ... 181 FIGURE 4.16–EXAMPLES OF EXTRACTED HHPS.(A) IC IMAGE;(B)IT IMAGE;(C)HPPC;(D) HPPT;(E)2D
CORRELATION BETWEEN HHPC AND HHPT WITHOUT GEOMETRICAL CORRECTION;(F)2D
CORRELATION BETWEEN HHPC AND HHPT WITH GEOMETRICAL CORRECTION. ... 183 FIGURE 4.17–EXAMPLE OF 2D CORRELATION OBTAINED WITH TEST IMAGE UNDER “IMPORTANT” GEOMETRIC
DISTORTIONS.IT IS POSSIBLE TO OBSERVE THAT THE GEOMETRIC CORRECTIONS ALLOW, ALSO IN THIS CASE, TO CORRECTLY CALCULATE THE CROSS-COVARIANCE. ... 185 FIGURE 4.18–LITHOGRAPHY USED FOR TESTING OUR AUTHENTICATION METHOD.THESE WERE MADE BOTH IN 1984
BY MICHELE CASCELLA (FAMOUS ITALIAN CREPUSCULAR LANDSCAPIST;1892-1989).THE
FIGURE 4.19–IN (A) IT IS HIGHLIGHTED THE AREA USED FOR CERTIFICATION IMAGE (B) AND TEST IMAGE (C).ON CERTIFICATION AND TEST IMAGES ARE ALSO HIGHLIGHTED THE USED TRUSTED POINTS. ... 189 FIGURE 4.20–COMPLETE SCHEMA SHOWING THE LITHOGRAPHY VERIFICATION PHASE.IT IS HIGHLIGHTED THE
EXECUTION OF VERIFICATION PROGRAM IN A SECURE MEMORY SPACE.THE DATA OUTSIDE SECURE MEMORY SPACE OR SECURE DEVICE ARE ENCODED FOR NOT ALLOWING COPY ATTACK. ... 195 FIGURE 4.21–CERTIFICATE IMAGE (A) AND TEST IMAGE (B).IT COULD BE NOTED THAT TEST IMAGE IS A COUNTER
CLOCKWISE ROTATED AND TRANSLATED VERSION OF (A). ... 197 FIGURE 4.22–EXAMPLE OF VERIFICATION RESULT WITH SALT AND PEPPER NOISE ADDITION.(A)CERTIFICATE IMAGE;
(B)ROTO-TRASLATED TEST IMAGE WITH GAUSSIAN NOISE ADDED (0.3 DISTRIBUTION VALUE);(C) CORRELATION RESULT WITHOUT TEST IMAGE GEOMETRICAL CORRECTION;(D)CORRELATION RESULT AFTER TEST IMAGE GEOMETRICAL CORRECTION USING TWO TRUST POINTS. ... 198 FIGURE 4.23–(A)CASCELLA’S ALBERO DI ARANCIO CERTIFICATION IMAGE;(B);TEST IMAGE SCALED BY 80% IN
BOTH DIRECTIONS;(C)RESULTING EQUAL TO 14.84 WITH GEOMETRICAL TRANSFORMATION. ... 201 FIGURE 4.24–(A)TEST IMAGE ROTATE OF 9 DEGREE CLOCKWISE AND SCALED BY 20% IN BOTH DIRECTIONS;(B);
TEST IMAGE AFTER GEOMETRICAL CORRECTION;(C)RESULTING EQUAL TO 1.28 IN CASE OF NO GEOMETRICAL TRANSFORMATION;(D)RESULTING EQUAL TO 24.01 IN CASE OF GEOMETRICAL TRANSFORMATION. ... 202 FIGURE 4.25–IN (A),DRUG PACKAGE UNDER WHITE LIGHT ILLUMINATION IS SHOWN, WHILE IN (B) THE SAME
PACKAGE IS ACQUIRED UNDER UV ILLUMINATION, SHOWING THE SPECKLE PATTERN. ... 207 FIGURE 4.26–NINE DIFFERENT SPECKLE PATTERNS ACQUIRED FROM NINE DIFFERENT DRUG PACKAGES (BAYER®
ASPIRIN©).THE SPECKLE PATTERNS ARE CREATED WITH THE SAME METHOD, USING A UV SPRAY INK FROM A DISTANCE OF 10 CM, SPRAYED FOR 1 SECOND.THE SPECKLE PATTERNS REPORTED IN THE NINE IMAGES DIFFER IN NUMBER, DIMENSION AND DISTRIBUTION INSIDE A SIMILAR PACKAGE AREA. ... 209 FIGURE 4.27–THE SPECKLE PATTERN SAMPLE SHOWN IN FIG.2(A) IS NOW SUBDIVIDED INTO 64 BLOCKS, USING A
GRID WITH 128X128 PIXELS CELLS. ... 211 FIGURE 4.28–(A)ACQUIRED IMAGE WITH TRUST POINTS SUPERPOSITION.THE USAGE OF TEN POINTS ALLOWS
IMAGE UNDER UV ILLUMINATION;(C) ACQUIRED IMAGE WITH DATAMATRIX REFERENCE BOUNDING BOX SUPERPOSITION.THE USE OF THE DATAMATRIX BOUNDING BOX ALLOWS CORRECTION OF THE GEOMETRICAL DISTORTIONS WHEN THE ORIGINAL STANDARD REFERENCE INFORMATION IS KNOWN. 212 FIGURE 4.29–THE SCHEMA FOR CREATING AN ENCODED 196 BIT STRING STARTING FROM A BLOCK IMAGE IS
REPORTED.STARTING FROM A SPECKLE IMAGE BLOCK, A HISTOGRAM IS CREATED WITH INDICATION OF THE PERCENTAGE FOR EACH SIZE INTERVAL.EACH PERCENTAGE IS CONVERTED TO A 4 BIT STRING USING THE CONVERSION IN TABLE 2, CREATING A 32 BIT STRING RELATED TO THE SINGLE BLOCK.AFTER THAT, THE 32 BIT STRING IS ENCODED IN A 196 BIT STRING USING AN ECC PRIVATE KEY. ... 215 FIGURE 4.30–FOUR DIFFERENT IMAGE BLOCKS ARE SHOWN IN (A),(B),(C) AND (D) TO SHOW THAT ANY BLOCK
REPRESENTS A DIFFERENT SPECKLE PATTERN WITH A DIFFERENT SPECKLE STATISTIC, EVEN BETWEEN TWO CONTIGUOUS BLOCKS.EACH STATISTIC, AS USED IN THIS PAPER, IS REPORTED IN (E),(F),(G) AND (H) RESPECTIVELY. ... 216 FIGURE 4.31–(A)ORIGINAL SPECKLE PATTERN;(B)SPECKLE PATTERN AFTER GEOMETRICAL DISTORTION PRODUCED
BY ROTO-TRANSLATION AND PERSPECTIVE ERROR;(C)DISTORTED IMAGE REPORTED IN (B) AFTER AUTOMATIC GEOMETRICAL CORRECTION BY MEANS OF THIRD ORDER POLYNOMIAL TRANSFORMATION; (D) CORRELATION PEAK BETWEEN ORIGINAL IMAGE (A) AND CORRECTED ONE (C). ... 219 FIGURE 4.32–(A)ORIGINAL SPECKLE PATTERN IMAGE;(B) ACQUIRED IMAGE WITH PERSPECTIVE DISTORTION;(C)
CORRELATION RELATED TO (A) AND (B) WITHOUT GEOMETRICAL CORRECTION.THE CORRELATION VALUE IS EQUAL TO 0.06 RELATED TO A STATISTICAL THRESHOLD OF 0.2;(D) CORRELATION RELATED TO (A) AND (B) WITH GEOMETRICAL CORRECTION.THE CORRELATION VALUE IS EQUAL TO 0.68 RELATED TO A STATISTICAL THRESHOLD OF 0.25. ... 221 FIGURE 4.33–(A),(B) AND (C) SHOW THREE CONTIGUOUS BLOCKS EXTRACTED FROM SPECKLE PATTERN REPORTED IN
FIGURE 4.26(A).IN (D), THE CORRELATION BETWEEN (A) AND (C) IS REPORTED; THE CORRELATION VALUE IS EQUAL TO 0.009 FOR A THRESHOLD OF 0.25.IN (E), THE CORRELATION BETWEEN (A) AND (B) IS REPORTED; THE CORRELATION VALUE IS EQUAL TO 0.008 FOR A THRESHOLD OF 0.25.(F) SHOWS THE CORRELATION BETWEEN (B) AND (C); THE CORRELATION VALUE IS EQUAL TO 0.008 FOR A THRESHOLD OF 0.25. ... 222
FIGURE 4.34–(A) REPORTS THE ORIGINAL DRUG PACKAGE, AS SHOWN IN FIGURE 4.26(I);(B) THE SAME PACKAGE WITH A CLOCKWISE ROTATION OF 5 DEGREES;(C) SAME PACKAGE WITH A TRANSLATION OF 20 PIXELS DOWN AND 20 PIXELS RIGHT;(D) SAME PACKAGE WITH REDUCED SCALE OF 10% IN BOTH DIRECTIONS; (E) SAME PACKAGE WITH PERSPECTIVE ERROR OF 7 DEGREES MODIFICATION ON BOTH DIRECTIONS AND 8 DEGREES ROTATION. ... 224 FIGURE 4.35–(A)DRUG PACKAGE REPORTED IN FIGURE 4.26(A) WITH A HOLE IN IT;(B)DRUG PACKAGE REPORTED
IN FIGURE 4.26(B) WITH RIGHT BORDER FOLDED;(C)DRUG PACKAGE REPORTED IN FIGURE 4.26(C) WITH MASSIVE INK WRITING;(D)DRUG PACKAGE REPORTED IN FIGURE 4.26(D) FOLDED ALONG HORIZONTAL AXIS IN THE CENTRE OF THE PACKAGE;(E)DRUG PACKAGE REPORTED IN FIGURE 4.26(E) WITH BLUE BALL PEN WRITING;(F)DRUG PACKAGE REPORTED IN FIGURE 4.26(G) WITH BLUE GEL PEN WRITING. ... 227 FIGURE 4.36–FAR AND FRR CURVES EXTRACTED FROM STATISTICAL ANALYSIS.THE TWO THRESHOLDS USED DURING THE ARTICLE ARE HIGHLIGHTED. ... 228 FIGURE 4.37–HOLOBARCODE GENERATION AND SUBSEQUENTLY STRING EXTRACTION.TO IMPLEMENT THESE TESTS
HOLOBARCODE HAS BEEN POSITIONED INSIDE A FINDER PATTERN, EQUAL TO THE ONE USED IN THE ECC 200DATA MATRIX, WHICH IS NECESSARY FOR LOCATING THE DATA AREA. ... 234 FIGURE 4.38–(A)DATA MATRIX CODE WITHOUT DAMAGE,(B)READABLE DATA MATRIX WITH DATA LOSS
CORRECTION ,(C) AND (D) NOT READABLE DATA MATRIX CODE. ... 235 FIGURE 4.39–(A)HOLOBARCODE WITHOUT DAMAGE,(B)HOLOBARCODE WITH DATA LOSS AND DATA CORRECTLY
RECOVERED,(C) AND (D)HOLOBARCODE READABLE, DATA PARTIALLY RECOVERED... 236 FIGURE 4.40–RECOVERED DATA FROM HOLOBARCODES OF FIGURE 4.39 ... 237 FIGURE 4.41–(A) AND (B) READABLE DATA MATRIX,(C) AND (D) ENCODED INFORMATION NOT READABLE. ... 238 FIGURE 4.42–(A),(B) AND (C)HOLOBARCODE READABLE WITHOUT LOSS OF ENCODED INFORMATION,(D)
HOLOBARCODE WITH INFORMATION PARTIALLY RECOVERED. ... 239 FIGURE B.1–LEE HOLOGRAM PHASOR DECOMPOSITION SCHEMA.IT SHOWS A REAL AND IMAGINARY COMPONENTS
FIGURE B.2–LEE HOLOGRAM PHASOR DECOMPOSITION SCHEMA.IT SHOWS A REAL AND IMAGINARY COMPONENTS RELATED TO A SINGLE CELL TO BE TRANSFORMED. ... 267
List of Tables
TABLE 1.1–COMPARISON AMONG MAIN BIOMETRY.THE RELATED CHARACTERISTIC LEVEL IS INDICATED WITH CHAR H (HIGH),M(MEDIUM), AND L(LOW), BASED ON AMERICAN STANDARD SCALE FOR BIOMETRIC SYSTEM EVALUATION. ... 63 TABLE 1.2–IN THIS TABLE FAR AND FRR RESULTS FOR THE MOST USED BIOMETRY, FINGERPRINT, FACE, AND IRIS,
ARE REPORTED.THE EVALUATED ACCURACY IS FUNCTION OF SOME FACTORS: SENSOR CHARACTERISTICS, USED ACQUISITION PROTOCOL, ENVIRONMENTAL CONDITIONS, SUBJECTS NUMBER, NUMBER OR ACQUIRED SAMPLES FOR EACH SUBJECT, SUBJECT HABITS, TIME BETWEEN EACH ACQUISITION AND SO ON. ... 64 TABLE 3.1–VARIOUS POLYNOMIAL FUNCTIONS USED FOR LAYERS AND MESSAGE INSIDE AZTEC CODE. ... 126 TABLE 3.2–NUMBER OF MAXIMUM CHARACTERS NECESSARY IN RELATION TO CODE TYPE. ... 131 TABLE 3.3–NUMBER OF MAXIMUM CODEWORDS THAT COULD BE RESTORED IN RELATION TO THE REED-SOLOMON
ERROR CORRECTION LEVEL. ... 133 TABLE 3.4–TABLE OF DATA MATRIX ECC200SYMBOL ATTRIBUTES (SQUARE FORM). ... 141 TABLE 4.1–RELIABILITY OF THE SYSTEM VS.. BANKNOTES TYPE AND BANKNOTES MANIPULATION. ... 164 TABLE 4.2–TYPE OF TRANSFORMATION IN RELATION TO DISTORTIONS [SEE REF.107]. ... 192 TABLE 4.3–CORRELATION VALUES FOR DIFFERENT ADDED NOISE, WITH RELATED NOISE PARAMETERS.IT HAS TO BE
NOTED THAT STATISTICAL THRESHOLDS ARE CONSTRUCTED USING CORRELATION FUNCTION MEAN VALUE AND STANDARD DEVIATION AND ARE NOT DIRECTLY CONNECTED TO ANY NOISE FUNCTION MEAN VALUES AND VARIANCES. ... 199 TABLE 4.4–SPECKLE SIZE INTERVAL DEFINITION.ALL SPECKLE INSIDES A SPECKLE FIELD ARE ANALYZED AND
SUBDIVIDED INTO 10 INTERVALS IN RELATION TO THEIR SIZE, WHICH IS EXPRESSED IN PIXELS.THEN, THE INTERVALS IDENTIFIED WITH 0 AND 9 ARE REMOVED FOR ROBUSTNESS. ... 212
TABLE 4.5–PERCENTAGE CONVERSION.EACH PERCENTAGE RELATED TO A SPECKLE SIZE INTERVAL IS CONVERTED TO A 4 BIT CODING FOLLOWING THIS TABLE. ... 213 TABLE 4.6–HAMMING’S DISTANCES BETWEEN THE NINE SPECKLE PATTERNS REPORTED IN FIGURE 4.26. ... 223 TABLE 4.7–HAMMING’S DISTANCES BETWEEN SPECKLE PATTERNS AND THEIR RUINED VERSIONS.THE FIRST COLUMN
REPORTS THE VALUES RELATED TO THE RUINED SPECKLE PATTERN ACQUIRED FROM THE ACQUISITION SYSTEM THE SECOND COLUMN REPORTS THE SAME VALUES FOR THE GEOMETRICALLY CORRECTED VERSIONS. ... 225 TABLE 4.8–SYMBOLS USED FOR TRANSFORMING A BINARY STRING INTO A BITMAP IMAGE ... 230
List of Acronyms
AFIS Automatic Fingerprint Identification System
CAS Covert Authentication System
CGH Computer Generated Holograms
CMC Cumulative Match Characteristic
DET Detection Error Trade-off
ECC Elliptic Curves Cryptography
EER Equal Error Rate
FAR False Accept Rate
FFT Fast Fourier Transform
FRR False Rejection Rate
FTA Failure To Acquire
FTC Failure To Capture
FTE Failure To Enroll
GAR Genuine Accept Rate
HCCB High Capacity Colour Barcode
IR Infrared
OAS Overt Authentication System
PUF Physical Uncloneable Feature
QR Quick Response (Code)
SH Synthetic Hologram
SHW Synthetic Hologram Watermarking
Chapter 1 Motivations
1.1 INTRODUCTION 34
1.1.1 TERMINOLOGY 37
1.2 BIOMETRIC PROCESS PHASES 41
1.2.1 BIOMETRIC DATA REGISTRATION (ENROLLMENT) 42
1.2.2 AUTHENTICATION PHASE 43
1.2.3 IDENTIFICATION PHASE 44
1.3 PERFORMANCE EVALUATION 44
1.3.1 FRR,FAR AND ROCCURVE 45
1.3.2 USER TYPOLOGY 48
1.3.3 EQUAL ERROR RATE (ERR) 49
1.3.4 IDENTIFICATION RATE RK 54
1.4 KINDS OF BIOMETRIC SYSTEMS 55
1.4.1 FINGERPRINTS 55 1.4.2 FACE 56 1.4.3 HAND GEOMETRY 57 1.4.4 PALMPRINT 57 1.4.5 IRIS 58 1.4.6 RETINA 59 1.4.7 KEYSTROKE 60 1.4.8 SIGNATURE 60 1.4.9 VOICE 61 1.4.10 GAIT 62 1.4.11 BIOMETRY COMPARISON 63
1.5 BIOMETRIC PARADIGM APPLIED TO LIFELESS MATTER 65
1.1 Introduction
Physical characteristics are used since human origin to identify each other. Face, voice, posture, are all typical and ancestral types of identification method, developed in the human history. Alphonse Bertillon [1], chief of Paris’ Police crime identification division, has developed and used the idea to identify possible criminals by means of measurable physical characteristics, during investigation phase, since half of nineteenth century.
When his idea were starting to grow in popularity, it was obscured by a more simple and efficient solution, proposed in the same period: the measurable differences between fingerprint of different people [2]. This approach allowed (and allows also today), to clearly identify people, with a very low possibility to have two fingerprints, belong to two different people, so similar to be confused each other.
In very few time the majority of Police Department in different Nations started to collect criminal fingerprints, creating something similar to the modern database, but made on paper. In this way could be possible verifying the presence on the crime scene of a well-known criminal, comparing the acquired fingerprints with the collected ones.
From that time ahead, the usage of physical characteristics to identify people started to spread all around the world, first with the necessity to secure access to highly confidential information areas, than spreading to the consumer market, composed by non-government subjects, wide public and private institutions, law enforcement entities, but also to common people to access their personal data at home, without using pin and or password.
During the evolution of the physical characteristic usage for logical and physical security, it has been coined a new term, used to identify this approach:
Biometry. This term derives from two Greek words : βιος (bios), which means
life, and μετρον (metron), which means measurement, so it is possible to be translate has measurement of life, such as of life characteristics, which allows to take apart one individual to another one.
Theoretically any human characteristic, both physical or behavioral, can be qualified as discriminant to identify a person. In practice a human characteristic can be considered as biometric discriminant only if cope with the following properties [3]:
Universality: al the person should have the characteristic; Permanence: the characteristic should not vary over time;
Distinctiveness: samples corresponding to different persons should be as different as possible, that is, the inter-class variability should be as large as possible;
Robustness: samples corresponding to the same person should be as close as possible, that is, the intra-class variability should be as small as possible;
Accessibility: the sample should be easy to present to the acquisition device;
Acceptability: it should be perceived as nonintrusive by the user;
Hardness to circumvention: it should be hard for an impostor to fool the system.
Some of these properties are not directly related to the physical characteristic, but to the acquisition system, in particular for acceptability and hardness to circumvention.
Nowadays, the complex international situation and the growing in security awareness, have introduced an enforcement in security controls on common citizens, promoting actions related to area and border control, based on biometric systems. The usage of biometry as security enforced is demonstrated by international initiatives, such as electronic passport, e-Visa and electronic personal identification documents (CIE – Carta di Identità Elettronica). All these solutions will have a common denominator the usage of biometric identifiers. New investments are also foreseen to empower AFIS (Automatic Fingerprint Identification System), based on fingerprint database to be used by international anti-crime structures (e.g. FBI, Interpool, CIA)
A Biometric Identification System is essentially based on the verification of claimed identity (Authentication), or on the individuation of an identity among a set of registered ones (Identification), matching an homogeneous set of data, extracted during verification phase, with the similar set of data maintained in a database. The two different phase in which a person gives its personal data to the
acquisition system are called enrollment and matching. The set of characteristics will be generated starting from the acquisition, and subsequent elaboration, of physical characteristics data (e.g. fingerprint, iris, hand geometry, retina), or behavioral data (e.g. posture, gait, keystroke, voice). In some cases, with the aim to increase identification/authentication system robustness, it is possible using different biometric characteristics, creating a multi-modal biometric system. Some examples are identification system based on fingerprint, palmprint and hand geometry, fingerprint and iris scan. This approach request the definition of a homogeneous score, to be used for confronting different biometry in a unique system.
1.1.1 Terminology
In the following common definition are reported, which can be applied to all the biometric’ families. In addition the definition for Enrollment and Verification phases are reported, with a sensor-independent approach, with the aim to arrive at the final definition of Biometric Template [3], such as, a uniform and unique data agglomeration, created by means of acquired biometric data, and used for easily verify person authentication.
1.1.1.1 Physical and Logical Access
In the biometric-based identification/authentication system study, exists two recurrent terms:
Physical Access: verification procedure with the aim to check the authorization of a person to enter in a particular site, room, or building; Logical Access: verification procedure with the aim to check authorization
of a person to use a particular information resource.
1.1.1.2 Authentication and Identification
One of the most important distinction in the biometric process is between authentication and identification.
In the Authentication Process, also called “one-to-one”, acquired data have to been compared with a unique biometric datum, gave from the same person during registration (i.e. Enrollment) Phase, and stored in a centralized Database. This procedure allows to verify if a person is whom she/he says to be. Frequently this kind of checking is made using also a support user identification token, such as personal id, password, username, pin and so on.
In the Identification Process, the biometric acquired data are checked against an entire Database, to verify if exists at least one person with the “same” biometric template. This process is also called “one-to-many”, and it does not requires additional information.
Sometimes, when it is not possible specifying if the verification phase is related to an authorization, or an identification process, it is used the term “Biometric Identification”.
1.1.1.3 Physical and Behavioral Biometry
Referring to the generic term of biometric identification, it is possible distinguish among two different biometric families:
Physical Biometry, based on the usage of physical characteristics, such as fingerprint, iris, hand geometry, face, retina and so on;
Behavioral Biometry, based on the usage of characteristics not strictly related to individual properties, such as, keystroke velocity, gait, voice, signature and so on.
In the following some information related to the more important and diffused biometric techniques will be reported, for sake of completeness.
1.1.1.4 Interactive and Passive Biometry
Biometric identification processes can be applied both in interactive way, or in passive one.
In the first case the interested person is aware of the system operability and gives her/his biometric data on voluntary basis (Interactive Biometry).
In the second case, the biometric data are acquired without person awareness and interaction with the system (Passive Biometry).
Typical examples of the first case is the fingerprint acquisition, whereas the second case is the gait or face at distance acquisition. Obviously the Passive Biometry is more linked with Identification problem, where Interactive one with Authentication processes.
1.1.1.5 Positive and Negative Verification
A Biometric system can work both in positive or negative identification; in the first case person declares (also implicitly) to be part of a well-known user group; in the second case person declares (also implicitly) to be not part of a well-known user group.
In a Positive Identification process it is clear the link between the person under biometric verification, with an identity present in the system, and the user request a positive process, such as a verification that she/he is whom he claim to be, referring to the selected user group1. In this approach both authentication and identification can be used. In case of correspondence between the acquired biometric data and the registered ones, an acceptance will be declared, otherwise a rejection. Typical examples are physical and logical access controls.
Negative identification has the aim to establish if a subject under identification
does not belong to a well-known user group in the system. Some examples are the presence in the police databases, or if she/he has just one driving license. This procedure is the most used in USA Governance scope. This approach has been proposed to avoid the usage of different identities from a single person. In this case if the system find a correspondence in the databases, between the analyzing biometric data and all the available biometric templates, this become a rejection, whereas in negative case, the system gives an acceptance (i.e. the person requesting a document can have it, because she/he has not another one).
1
Obviously the real user identity has to be clearly verified during registration phase, using also common paper documents and using identification processes not strictly related to biometric ones.
It has to be noted that, if positive verification can be made with or without biometric systems, negative verification can be carried out only using biometric data [5]. Negative identification can be made only with a one-to-many approach, where the “many” part can be or the entire content of a set of databases, or only one or more short lists.
1.2 Biometric Process Phases
Biometric process can be synthetized as a set of precise phases, independently from the type of biometry and the nature of the acquired data as clearly reported in Figure 1.1.
Figure 1.1 – Biometric Process schema. Enrollment, identification and authorization phases are clearly reported and linked each other.
1.2.1 Biometric Data Registration (Enrollment)
User’s biometric data registration, also called Enrollment, is the first phase of the biometric paradigm. A user, which would be grant to access to a system or site, has to register her/his biometric characteristics, using an appropriate acquisition system.
Generally the acquired sample has to be undertake a set of quality checks; in case of negative quality results, the Enrollment process has to be reiterated. After this stage, the system has to perform a procedure known as “feature extraction”, which is based on the extraction, from the acquired sample, of some numerical characteristics, which will be used to create a uniform numerical set called
Biometric Template. Registration phase is concluded with the template storage on
a secure database. Sometimes could happen that the storage biometric data is not a numeric template, but the acquired image itself.
In the following, to take into consideration both the proposed situation, we refers to “biometric identifier” or “biometric data”, instead of biometric template.
1.2.2 Authentication Phase
Authentication phase starts with the acquisition of a new biometric sample, in the same way used during Enrollment one, but not necessary using an identical acquisition system. After that the biometric features have been extracted and compared with the one stored in the database(s), or in a storage media, such as a smart card (match on card example).
The verification result is in true/false form or in percentage of similarity (matching score) between the extracted template and the stored one.
1.2.3 Identification Phase
During identification phase the user cannot use storing media, nor insert an identification information (e.g. pin, username, token), but the system checks the acquired template with all the templates present in its databases. The verification result is a set of matching scores, one in the best case, assuring that the person has been identified or can belongs to a set of possible identity, or a “not-identified” message.
All the verification phases are made on the basis of the existence of a matching threshold. The presence of a threshold is due to the differences that can be exist between the acquired image in Enrollment phase and in verification one. These differences can be due to different sensors, different environmental conditions, different acquisition conditions (e.g. rotated fingerprint), and so on. In the following more details on the verification threshold selection and related verification errors will be explained.
1.3 Performance Evaluation
Biometric system performance evaluation i based on statistical analysis, related on the number of correct identification respect with total number of tentative identification. In the following the main performance statistics are reported.
1.3.1 FRR, FAR and ROC Curve
A classical access system, based on a pin, password or token, request a perfect match between the claimed characteristic and the stored one. In a Biometric system this situation is near impossible and the verification is based on similarity instead of identity. This assertion is more valid more the biometric system is
open. With the term open is identified a biometric system where acquisition
sensors can have different capabilities and performance, environmental characteristics can widely change and so the acquired sample can differs a lot from the registered one. In addition, greater the storage database is, greater the probability to fail the identification/authorization is.
It ha also to be taken into consideration that the near impossibility to have two biometric data set identical is on the basis of the anti-replay technique in biometric systems. If a set identical to the registered one is submitted to the system, it is automatically discharged, because is considered not secure.
All the differences presented till now, can lead to a distinction between the possible template variations, known in literature as intra-class variations, such as differences inside the same biometric characteristic belonging to the same person, acquired in different time.
Differences related to the same biometric characteristic belonging to different people are called inter-class variations. A biometric dataset to be used in a authentication/identification system should have a low intra-class variation value and a high inter-class one. In this way the differences among different acquisition
of the same characteristic from the same person are minimized, whereas the difference among the same characteristic of different people are maximized. In this way it is also achieved the aim to minimized the false negatives (rejections of authorized people), and to maximized false positive (acceptance of unauthorized people).
The similitude grade between two biometric datasets (i.e. biometric templates) is valorised using a similitude score, or simply score. To determine if a score is sufficient to grant the user authentication/identification, it is necessary define a threshold φ. If it is defined “Genuine Score” the value S associated to the G
matching between two different templates belong to the same person and “Impostor Score” the valueS , associated to two templates belong to two different I
person, it is possible writing:
if Genine User correctly recognized if Genuine User erroneusly rejected if Impostor correctly rejected if Impostor erroneusly recongized
G G I I S S S S (1.1)
The False Accept Rate (FAR), also defined False Match Rate (FNMR)2 is the percentage of impostor users recognized by the system as genuine ones (i.e.
I
S ), calculated on the total number of verification attempts.
2
It has to be noted that FMR and FNMR are not exactly synonyms of FRR and FAR (see [9] and [10]), but in this work we will refer to FRR and FAR in this meanings, due to the fact that this choice, even if not completely correct, does not alter the proposed results and considerations.
Similarly , the False Reject Rate (FRR), also called False Non Match Rate (FNMR) of an identification system, can be considered the percentage of genuine scores which fail the correct identification (i.e. SG ).
The Genuine Accept Rate (GAR), is the part of genuine scores which are over the selected threshold (i.e. SG ) and is equal to:
GAR 1 FRR. (1.2) It is simple saying that, analysing Eq. (1.1) and the above-reported definitions, that varying the threshold value φ, it is impossible that both FAR and FRR increase or decrease together.
The FAR and FRR variation analysis varying φ can be made by means of the so called DET (Detection Error Tradeoff) Curves [7],which represent the FRR referred to FAR, varying the threshold φ in a normally deviated reference scale. When the used scale is linear, logarithmic or semi-logaritmic, the resulting curves are called Receiver Operating Characteristic (ROC) Curve [8]. In many cases ROC curves represents GAR vs.. FAR, instead of FRR vs.. FAR.
The main difference in the usage of ROC curve instead of DET ones is the necessity to use a linear or logarithmic scale, instead of a normally deviated one.
Figure 1.2 – Biometric system performance can be summarized using DET and ROC curves. In these two examples are shown in (a) a DET Curve related to FRR vs.. FAR, and, in (b) the same ratio expressed using a ROC Curve on linear scale. The two examples are related to Face-G matcher scores
performance test using NIST BSSR1 database [11]
1.3.2 User Typology
An interesting analysis is the distribution of false positive and false negative among the entire user typologies. Doddington [12] has made a study demonstrating that all the users can be divided in four categories and the distribution of false positive and negative is not uniform among all of them.
These four categories are based on the “recognisability” of a user. In particular the four recognisability category proposed by Doddington in relation with their intrinsic characteristics are3:
3
Even if this categorization has been thought to be applied to voice, it can be applied to all the biometric system, independently from the used characteristics.
Sheep: ir represents users with a biometric dataset highly distinctive, with a related low intra-class variation values, and related high inter-class variation values. This category presents a low value in both false acceptance and false rejection.
Goats: it represents all the users prone to high FRR values due to their intrinsic characteristics, having high values of intra-class variations.
Lambs: it represents users having biometric datasets highly superposed to the ones belong to different people. These sets show low values of inter-class variations, lead to high FAR values.
Wolf: are people which have success to manipulate their biometric data (in particular the behavioural ones) with the aim to pretend to be another person, regularly registered the system. In this way this typology of person, try to gain access at the system in fraudulent way. This lead to artificially increase the FAR value.
1.3.3 Equal Error Rate (ERR)
In addition to the FAR and FRR, a biometric system can be characterised on the basis of other error categories.
The Failure to Acquire (FTA) rate, also known as Failure to Capture (FTC) is the percentage of a biometric acquisition system to fail the user biometric data acquisition. This kind of errors happen when the system is not able to acquire a
signal with an adequate quality (e.g. user face in a too much dark environment, fingerprint with low level of details).
The Failure to Enroll (FTE) rate is the percentage of users which fails to register in the system using a specified acquisition sensor.
A trade-off exists between the FTE, which requests a system with a low accuracy, and the FAR/FRR, which request the contrary. Typically errors having an high impact on FTE happen when the system has an high threshold and refuse low quality acquired images. Consequently, having a high quality threshold leads to have a database containing only templates related to high quality images. In this way the system accuracy is increased and the FAR and FRR both decrease, because are reduced the verification error possibility. Having a low quality threshold, allows to have templates related to poor quality images, increasing the possibility to have false positive and false negative results.
Due to quality (FTE, FTC) and accuracy (FAR, FRR) factors dependency, it is important define a unique threshold value, which has the capability to summarise Biometric Systems performances. This value is called Equal Error Rate (EER). ERR corresponds to the point on DET Curve where FAR and FRR are equal. Value lower than EER are related to more accurate systems.
It is also interesting note that low threshold values lead to maximize the FAR values, because also biometric data very different from original ones will be recognized as genuine, but minimize the FRR, because became very difficult to be not recognised. Otherwise high values of threshold leads to an high percentage of false negative, but also to a low percentage of false positive. A system with a high
threshold is useful for the access to strictly reserved areas, where is better having a false rejection, when an unauthorised person that grants illegal access. Low threshold values can be useful for end-user systems, which grants access to the authorised person with an high rate is more important when data reservation.
Another value used to evaluate system performance is the so called d-prime
(d’). It measures the separation between the median values of genuine and
impostor probability distributions, calculated in standard deviation units:
2 2 2 ' genuine impostor genuine impostor d , (1.3) where μ and σ are the median and standard deviation values respectively. Higher values of d indicates better performance systems, because the two ' distributions are more distant and only few cases can be misinterpreted by the system (i.e. few false acceptance and false rejections).
If the two distributions have a normalized Gaussian profile, with equal variance (this last hypothesis is not so common in biometric system), then d is equal to the ' standard deviation [13].
Poh and Bengio have introduced [14] another value for measuring system performances, knows as F-ratio, and defined as:
genuine impostor genuine impostor F ratio , (1.4) If the two distributions are Gaussian-like, a relation exists between ERR and F-ratio:
1 1 2 2 2 F ratio EER erf , (1.5) where 2 0 2 x t erf x e dt . (1.6)
In Figure 1.3 classical individual distributions are shown, with highlighted also the ERR Threshold value and the d-prime distribution distance. In Figure 1.4 (a) are shown FAR and FRR distributions related to Threshold variation, with highlighted the related ERR. In In Figure 1.4 (b) the ROC curve of the same distributions is reported. It is possible notice has the ERR in the ROC curve is equal to the secondary diagonal.
Figure 1.3 – Probability distributions for Impostors and Genuine Users. It has put in evidence that, given a threshold φ, it is possible to define the genuine users percentage refused by the system (FRR cyan area) and the percentage of impostor users which grant access to the system (FAR orange area). The intersection point between the two probability curves identifies the threshold value able to give the
EER. Also d-prime (or d’) is clearly identified in this figure.
Figure 1.4 – In (a) FAR and FRR are shown at threshold φ varying. It has to be noted that the two curves intersection identifies the ERR, with the related φEERthreshold value. In (b) the ROC curve
1.3.4 Identification Rate Rk
In case of identification, the acquired biometric dataset is compared with all the templates resident in the database, with the aim to determine the “Best Match”. The best match can be determine comparing all the obtained matching scores and reporting only the best one, such as the most one related to the most similar data sets. The Identification Rate is the percentage of correct identification made by the system for a particular user. This analysis is made using the rank-k RK, which
indicates the percentage of correct identification made by the system inside the range of maximum scores achieved, for the k-esim user. For better understanding if a particular user is correctly identified 100 times, and the maximum score range is between 96% and 100% of similitude, with a threshold of 90% of similitude, the rank-k will be not 100, but the number of times, among these 100, where the identification score was equal or greater than 96. SO, for example the rank.k in this case could be 20, indicating that only in the 20% of cases the identification has been made in the proper way. Greater the rank-k is, better the system works, for that user.
To define the performance of the system referring to all the k users, it is possible referring to the Cumulative Match Characteristic (CMC) curve, which represents the value Rk with k from 1 to M, where M is the number of users registered in the database [15].
Relation between CMC curves and ROC/DET curves has been widely described in literature by Grother and Phillips [16] and by Bolle and others [17].