DOCTORAL DISSERTATION
GEOHISTORY OF THE
CENTRAL ANATOLIAN PLATEAU SOUTHERN MARGIN
(SOUTHERN TURKEY)
PhD Student: Giuditta Radeff
Supervisors
Prof. Domenico Cosentino – Roma Tre University
Prof. Manfred R. Strecker – Potsdam University
Co-supervisor
Taylor F. Schildgen, PhD – Potsdam University
Roma Tre University – Department of Science in Cotutelle de Thèse with
Potsdam University - Institute of Earth and Environmental Science
Scuola Dottorale in Geologia dell’Ambiente e delle Risorse
Sezione Geologia dell’Ambiente e delle Risorse Ciclo XXVI
DOCTORAL DISSERTATION
GEOHISTORY OF THE
CENTRAL ANATOLIAN PLATEAU SOUTHERN MARGIN
(SOUTHERN TURKEY)
PhD Student: Giuditta Radeff
Supervisors
Prof. Domenico Cosentino – Roma Tre University
Prof. Manfred R. Strecker – Potsdam University
Co-supervisor
Taylor F. Schildgen, PhD – Potsdam University
Director of the Doctoral School
Prof. Claudio Faccenna
Reviewers
Dr. Gian Paolo Cavinato
IGAG – CNR
Prof. William B. Ryan
Columbia University
To Mrs. Conci, who taught me the meaning of “important”
To Mr. Christian, Mrs. Floriana and Miss Elisabeth, my idea of happiness
Wann immer einen die Dinge erschreckten, sei es eine gute Idee, sie zu messen. “Die Vermessung der Welt”, Daniel Kehlmann
Quando si ha paura delle cose, bisogna misurarle. “La misura del Mondo”, Daniel Kehlmann
TABLE OF CONTENTS
Preface 1
1. SEDIMENTARY EVIDENCE FOR LATE MIOCENE UPLIFT OF THE SE MARGIN OF THE CENTRAL ANATOLIAN PLATEAU: ADANA BASIN, SOUTHERN TURKEY
1.1. Preface 3
1.2. Tectonic setting of the Central Anatolian Plateau and the Adana Basin 6
1.3. The Messinian Salinity Crisis 8
1.4. Stratigraphy of the Adana Basin 10
1.5. Methodology 12
1.5.1. Seismic Interpretation 12
1.5.2. Volume Calculation 12
1.5.3. Provenance Analysis 12
1.5.4. Evolution of the drainage system 13
1.6. Results 14
1.6.1. Seismic stratigraphy 14
1.6.2. Volume Calculation of the late Lago-Mare facies (Handere Formation) 17
1.6.3. Provenance analysis 18
1.6.3.1. The Handere Formation sampling sites 18
1.6.3.2. Provenance analysis of the clasts in the late Lago-Mare conglomerates of the Handere
Formation 20
1.6.4. Evolution of the drainage system 22
1.6.4.1. Present-day catchments versus present-day provenance 22
1.6.4.2. Present-day catchments versus Handere Formation clasts provenance 23
1.7. Discussion 25 1.8. Conclusions 28
2. DIFFERENCES AND SIMILARITIES IN THE LATE MIOCENE SUBSIDENCE HISTORIES OF THE MUT AND ADANA BASINS (SOUTHERN TURKEY): A RECORD OF SURFACE UPLIFT OF THE SE MARGIN OF THE CENTRAL
ANATOLIAN PLATEAU
2.1.
Introduction 302.2. Tectonic setting of the Mut and Adana basins 33
2.3. Stratigraphy 35
2.3.1. Surface stratigraphy for the Adana Basin 35
2.3.2. Surface stratigraphy for the Mut Basin 36
2.3.2.1. Lower megasequence (early Oligocene-early Miocene p.p.; Rupelian-late Aquitanian)
38
2.3.2.2. Middle megasequence (early Miocene p.p.-late Miocene p.p.; late Burdigalian-late Tortonian)
39
2.3.2.3. Upper megasequence (early Pliocene-early Pleistocene; late Zanclean-Calabrian).
40
2.4. Data and Methods 42
2.4.1. Seismic interpretation 42
2.4.2. 3D surfaces, isopach maps & volume calculation 42
2.4.3. Subsidence curves 43 2.5. Results 43 2.5.1. Seismic interpretation 43 2.5.1.1. Seismostratigraphic units 44 2.5.1.1.1. MS1 44 2.5.1.1.2. MS2 44 2.5.1.1.3. MS3 45 2.5.1.1.4. MS4a 45 2.5.1.1.5. MS4b 47 2.5.1.1.6. MS5 47
2.5.1.2. Seismostratigraphic surfaces 47 2.5.1.2.1. U1 47 2.5.1.2.2. U2 48 2.5.1.2.3. MES 48 2.5.1.2.4. MES2 48 2.5.1.2.5. P 49
2.5.2. 3D surfaces & Isopach maps 49
2.5.3. Volume calculations and deposition rates 52
2.6. Subsidence Curves 53
2.6.1. Subsidence curve for the Adana Basin 53
2.6.2. Subsidencce curve for the Mut Basin 54
2.7. Discussion 55
2.8. Conclusions 61
3. PRESENT DAY SEISMICITY AND STRUCTURAL SETTING OF THE ADANA BASIN (SOUTHERN TURKEY)
3.1. Introduction 63
3.2. Geological setting 65
3.3. Methodology 67
3.4. Data and results 68
3.4.1. Spatial distribution, depth, magnitude and focal mechanisms solution of the earthquakes 68
3.4.2. Fault measurements 71
3.4.2.1. Discontinuity trends on the macro- and meso-scale 71
3.4.2.2. Direction Analysis of the measured faults 72
3.4.2.3. Kinematic Analysis of the measured faults 73
3.5. Discussion 80
1 Preface
This work is the result of a 3 years doctoral project, within the framework of a “Cotutelle de Thèse” between Roma Tre University and Potsdam University.
The project is about the Adana Basin (southern Turkey). The position of the basin, located at the southeastern margin of the Central Anatolian Plateau and close to the Arabia-Eurasia collision zone, is ideal to record fundamental Neogene topographic and tectonic changes in the easternmost Mediterranean realm.
The thesis is organized in three chapters, each one constituting a preliminary draft for a publication.
The first chapter focuses on the study of a very well time-constrained sedimentary unit constituted by an alternation of conglomerates and marls bearing a brackish-water fauna and deposited during the latest stage of the Messinian Salinity Crisis (Lago-Mare stage ~5.45 – 5.33 Ma). I interpret 34 seismic lines, calculate the volume of the sedimentary body and I perform a provenance analysis by means of clast counting the conglomeratic portion and measuring paleocurrent directions. My first goal is to find a trace of the Central Anatolian Plateau southeastern margin uplift recorded in the sediments of the Adana Basin. I furthermore suggest a possible mechanism leading to the uplift of the plateau margin and to the subsidence in the Adana Basin.
The second chapter focuses on the comparison between the Adana Basin and the Mut Basin, another mainly Neogene basin located on top of the Central Anatolian Plateau southern margin. Differences and similarities on the stratigraphy, present elevation of the sediments and subsidence curves of the two basin are described and commented. I apply stratigraphy, seismic stratigraphy, 3D-surface restoration, isopach map reconstruction, and volume calculation to describe the evolution of the Adana Basin and its subsidence history. I integrate the data from a field-work carried on by Prof. Domenico Cosentino (Roma Tre supervisor) with data from literature in order to reconstruct the subsidence curve for the Mut Basin. The first aim is to better define the uplift history of the Central Anatolian Plateau southern margin.
The third chapter presents new structural data collected along the NW and SE margin of the Adana Basin and integrate them with the present seismicity of the area. The analysis of the spatial and temporal variation of the deformation coupled with the analysis of the present seismotectonic setting help to better define the
2
tectonic evolution of the Adana Basin and to furthermore comment the possible mechanism leading to subsidence in the basin.
3
1.
SEDIMENTARY EVIDENCE FOR LATE MIOCENE UPLIFT OF THE SE MARGIN OF THE CENTRAL ANATOLIAN PLATEAU: ADANA BASIN, SOUTHERN TURKEY
1.1. Introduction
Orogenic plateaus are areas of high mean-surface elevation that exert a fundamental influence on climate, erosion, and sedimentation (e.g. Molnar et al. 1993; Li et al. 1997; Zhisheng et al. 2001; Carrapa et al. 2006; Strecker et al. 2007). Understanding the timing and the mechanisms leading to the uplift of these major topographic features is therefore an outstanding topic that can help improve our understanding of the connection between geodynamic processes, changes in sedimentary supply, and climate evolution. Sedimentary rocks preserved within and along the margins of orogenic plateaus provide first-order information about the spatiotemporal development of these morphotectonic provinces (e.g. Vandervoort et al. 1995; DeCelles et al. 1998; Chung et al. 1998; Metivier et al. 1998; Najman and Garzanti 2000; Wörner et al. 2002; Carrapa et al. 2006; Uba et al. 2007; Strecker et al. 2009; Decou et al. 2011). Nonetheless, it is often difficult to obtain a detailed and reliable chronostratigraphic framework for these sedimentary sequences, and to link the stratigraphic record unambiguously to major changes in topography.
The Central Anatolian Plateau, which is characterized by a well dated sedimentary record capping its southern margin (Cosentino et al. 2012; Schildgen et al. 2012b) and a thick succession of sediments bordering its south and southeastern margin, provides an optimal setting to investigate the local interactions among tectonics, climate, erosion, and surface uplift, and possibly also uplift mechanisms at the plateau margin (Schildgen et al. 2012a and b; Lüdecke et al. 2013; Mazzini et al. 2013).
The Anatolian Plateau is an integral part of the western reaches of the Himalayan orogenic belt, formed during the Cenozoic by accretion of different lithospheric plates as a result of closure and suturing of the northern and southern branches of the Neotethys Ocean (Şengör and Yılmaz 1981; Görür et al. 1984; Robertson and Dixon 1984; Şengör et al. 1984; Biryol et al. 2011). The current westward motion of the Aegean-Anatolian plate with respect to Eurasia along two major transform faults, the North Anatolian and
4
East Anatolian faults (Fig. 1A; Ketin 1948; McKenzie 1978; Şengör 1979; Dewey and Şengör 1979; Şengör et al. 1985), appears to be controlled by the combined effects of the retreat of the Hellenic trench and the continental collision of the Arabian and Eurasian plates. Based on different deformation styles throughout this complex region, the Anatolia has been subdivided into four principal tectonic provinces (Şengör 1985): the Northern Anatolian province, separated from the other three by the North Anatolian Fault; the predominantly extensional Western Anatolian province(McKenzie 1970, 1978; Le Pichon and Angelier 1979; Jackson and McKenzie 1984; McClusky et al. 2000; Reilinger et al. 1997, 2006); the largely contractional Eastern Anatolian province with the Eastern Anatolian Plateau (EAP; McKenzie 1970, 1978; Şengör 1980; Jackson and McKenzie 1984; Jackson 1992; McClusky et al. 2000; Reilinger et al. 1997 2006), and the Central Anatolian province, which is transitional between the Eastern Anatolian and Western Anatolian provinces (Fig. 1A; Barka and Reilinger 1997; Bozkurt 2001).
v
Although much attention over the past several decades has focused on the evolution of the Aegean/Western Anatolian province with respect to slab retreat (Le Pichon and Angelier 1979, 1981; Faccenna et al. 2006; Jolivet et al. 2013) and the growth of the Eastern Anatolian plateau associated with
Figure 1. Location map of the study area and tectonic setting. [A] Regional setting: the study area is located in the central Anatolian province, between the western Anatolian extensional province (WAEP) and the eastern Anatolian compressional province (EACP). The Adana Basin is located beside the SE flank of the Central Anatolian Plateau, close to the Arabian – Eurasian collision zone. Westward extrusion of the Aegean-Anatolian microplate is accommodated along the North Anatolian Fault (NAF) and the East Anatolian Fault (EAF); DSF: Dead Sea Fault; Hellenic T.: Hellenic Trench; Cyprus T.: Cyprus Trench. [B] Close up of the study area. The Central and Eastern Taurus Mountains correspond to the SE margin of the Central Anatolian Plateau, constituting the NW margin of the Adana Basin. Misis Mountains border the SE flank of the basin, separating the Adana Basin from the Iskenderun Basin.
5
continental collision and deeper lithospheric processes (Meissner and Mooney 1998; Şengör et al. 2003; Keskin 2003, 2006), only recently has attention been focused on the timing and mechanisms of topographic development in Central Anatolia (Cosentino et al. 2012; Schildgen et al. 2012a, 2012b, in press; Cipollari et al. 2013a and b). Given that the evolution of the Central Anatolian Plateau (CAP) is likely to have been influenced by the geodynamics of its bordering regions, studying the temporal and spatial evolution of the CAP surface uplift is crucial for understanding i) the style and timing of crustal deformation; ii) the tectonic setting of the central Anatolian province; and iii) the mechanisms leading to vertical and lateral growth of the plateau.
Mantle delamination and slab break-off following continental collision have been suggested as the likely trigger mechanisms for volcanism and uplift in Eastern Anatolia (Pearce et al. 1990; Şengör et al. 2003; Keskin 2003, 2006; Göğüş and Pysklywec 2008; Kuscu and Geneli 2010). These interpretations were based on the moderate crustal thickness of the plateau (Zor et al. 2003), which is insufficient to explain the strongly negative Bouguer gravity anomalies (Ates et al. 1999).
Break-off of the Tethyan slab is also inferred for the southern margin of Central Anatolia based on mantle tomography (Gans et al. 2009; Biryol et al. 2011) and seismicity studies (Kalyoncuoğlu et al. 2011; Imprescia et al. 2012), which indicate the absence of a slab east of Cyprus. Coupled with the broad pattern of uplift involving regional warping of late Miocene marine sediments, the current evidence points to a deep-seated uplift mechanism for this region (Cosentino et al. 2012; Schildgen et al. 2012a, 2012b, in press). However, critical for testing the likelihood of slab break-off versus other potential mechanisms of uplift, such as crustal thickening through accretion (e.g. Fuller et al. 2006), is quantifying the pattern, timing, and rate of uplift throughout the region.
Based on biostratigraphy and magnetostratigraphy of the late Miocene marine sediments capping the southern margin of the CAP, the maximum age constraint on the start of surface uplift is ~8 Ma in the vicinity of the Ermenek Basin (Cosentino et al. 2012) or 6.7 Ma farther west (Schildgen et al. 2012b). However, a minimum age for the start of uplift has not yet been defined. Fortunately, the south and southeastern margins of the CAP are flanked by the Cilicia-Adana basin complex, an areally extensive depocenter of late Oligocene to recent sediments and potential archive of tectono-sedimentary processes for
6
the southern margin of the CAP (Fig. 1 A and B; Schmidt 1961; Görür 1979; Yetiş 1988; Ünlügenç et al. 1991; 1993; Gürbüz and Kelling 1991, 1993; Yetiş et al. 1995; Gürbüz andÜnlügenç 2001). A well established stratigraphy, precise age constraints on the late Miocene deposits (Cosentino et al. 2010b; Cipollari et al. 2013a; Faranda et al. 2013), and proximity to the plateau border make the Adana Basin a promising target for investigating changes in sedimentation patterns and rates that may signal topographic growth of the SE margin of the CAP.
In this study, we use provenance analysis and seismic stratigraphic observations to calculate the volume of a sedimentary unit that potentially documents plateau-margin growth. Moreover, our comparison of regional patterns of vertical crustal motions, i.e., between uplift of the CAP and sedimentation/subsidence in the Adana Basin, provides additional observations to help test hypotheses concerning geodynamic mechanisms responsible for this relatively young phase of plateau development.
1.2. Tectonic setting of the Central Anatolian Plateau and the Adana Basin
The Central Anatolian Plateau (CAP) lies within the Aegean-Anatolian plate, with its northern and southern margins defined by the Pontide and Tauride orogenic belts (Fig. 1A). The CAP is the result of a multi-phase deformation history. Convergence between the African-Arabian and Eurasian plates led to the accretion of the Pontide and Tauride fold-and-thrust belts, after the closure of the Paleotethyan Ocean in the Eocene and the Neotethyan Ocean in the Eocene to middle Miocene (e.g. Şengör and Yılmaz 1981; Şengör et al. 1984; Robertson and Dixon 1984; Robertson et al. 1996; Yılmaz et al. 1998; Görür et al. 1984, 1998; Gökten and Floyd 1987; Gökten 1993). A late Eocene – early Miocene extensional tectonic phase, probably linked to retreat of the African plate (Jolivet and Faccenna 2000; Kempler and Ben-Avraham 1987; Whitney and Dilek 1997; Dilek et al. 1999; Robertson 2000), has been tentatively correlated with the Oligocene to early Miocene terrestrial sedimentation recorded in several basins throughout the Central Taurides; the onset of terrestrial deposition can be interpreted as a first step in regional topographic growth (Clark and Robertson 2002, 2005; Bassant et al. 2005; Eriş et al. 2005; Şafak et al. 2005).
7
A second episode of topographic development in Eastern Anatolia postdates continental collision between Arabia and Eurasia at ca. 17.5 – 20 Ma (Okay et al. 2010; Ballato et al. 2011). This event closed the gateway between the Mediterranean and Indian Ocean; the minimum age proposed for the closure of the Tethyan gateway is ca. 11 Ma (Gelati 1975; Hüsing et al. 2009), creating the Bitlis-Zagros suture zone. Continental collision has also been associated with crustal thickening (Zor et al. 2003; Angus et al. 2006; Ozacar et al. 2008), which probably contributed to isostatic uplift of the Eastern Anatolian Plateau and the westward translation of the Aegean-Anatolian plate along the right-lateral North Anatolian and the left-lateral East Anatolian faults (Şengor et al. 1985). Nevertheless, because deformation along the North Anatolian Fault Zone predates continental collision along the Bitlis-Zagros suture (Zattin et al. 2005, 2010), and because the rate of motion of the Aegean-Anatolian plate along the Africa-Arabia-Eurasia continental collision zone increases towards the Hellenic trench (Reilinger et al. 2006), Aegean slab rollback has generally been accepted as the primary force driving the current westward movement of the Aegean-Anatolian plate (Reilinger et al. 2006; Okay et al. 2008; Mart and Ryan 2002; Mart 2013).
The Adana-Cilicia basin complex is a wide depocenter within the Aegean-Anatolian plate, north of the suture between the African and Aegean-Anatolian plates, here defined by the Cyprus Trench (Aksu et al. 2005a). East of the Cyprus Trench, the geometry of the plate boundary is complicated by the East Anatolian Fault, which has been tentatively linked by different authors (e.g. Şengor et al. 1985; Dewey et al. 1986; Chorowicz et al. 1994; Poole and Robertson 1998; Aksu et al. 2005a; Reilinger et al. 2006; Yin 2010; Koç et al. 2012) to the Bitlis-Zagros suture zone towards the northeast and to the Cyprus Trench to the southwest. The Ecemiş and Kozan faults are suggested to be splays of the East Anatolian Fault; they are characterized by left lateral trans-tensional kinematics (i.e. Aksu et al. 2005b; Burton-Ferguson et al. 2005) and are presently accommodating the differential uplift of the CAP relative to the Adana Basin (Cipollari et al. 2013a). The Adana-Cilicia Basin is confined to the north and northwest by the south and southeastern margin of the CAP, corresponding to the Central and Eastern Taurus mountains; to the south and southeast, it is bordered by the Misis-Kyrenia sector (Fig. 1B). As a result of the complex tectonic setting, the Adana Basin development has been alternatively associated with i) syn- or post-collisional tectonics related to slab dynamics (Williams 1995; Robertson 2004; Aksu et al. 2005a); ii) the widespread transcurrent motion
8
related to the development of the East Anatolian Fault Zone (Kelling et al. 1987; Chorowicz et al. 1994); or iii) a combination of the two processes (Şengor et al. 1985; Dewey et al. 1986).
The Adana Basin (Fig. 1B) constitutes the onshore prolongation of the offshore Cilicia Basin and thus contains a unique sedimentary record of the regional Neogene tectonic events (Brinkmann 1976; Kelling et al. 1987), potentially including the continental collision between the Arabian and the Eurasian plates and the uplift of the CAP. Moreover, according to recently published data (Grossi et al. 2011; Cipollari et al. 2013a; Faranda et al. 2013), the Adana Basin records all the main steps of the Messinian Salinity Crisis (MSC), a regional tectono-climatic event with far-reaching consequences for landscape evolution and environmental conditions (Hsü et al. 1977; Clauzon et al. 1978; Lofi et al. 2005; CIESM 2008 and references therein; Bache et al. 2009; Mocochain et al. 2009; Garcia-Castellanos et al. 2011; Lofi et al. 2011). Because the main steps of the MSC are precisely dated through a combination of astronomical tuning (Krijgsman et al. 1999; Cosentino et al. 2013) and high-precision CA-TIMS zircon U-Pb geochronology (Cosentino et al. 2013), this portion of the Adana Basin sedimentary fill is very well temporally constrained. Because the stratigraphic framework of these sediments is key for understanding the timing and nature of the erosive processes along the southern flank of the CAP, we briefly review the most relevant aspects of the Messinian deposits in the next section.
1.3. The Messinian Salinity Crisis
The Messinian Salinity Crisis (MSC, Fig. 2A) is a major event that impacted the paleogeographical and environmental evolution of the Mediterranean area, as a consequence of changes in the Atlantic-Mediterranean connection during the late Miocene. Although the factors leading to the MSC are still debated, the main events that occurred during the crisis have been widely recognized and precisely dated. According to Manzi et al. (2013), the onset of the MSC occurred at 5.97 +/- 0.003 Ma, with the deposition of the first Messinian gypsum cycle, generally referred to as the Primary Lower Gypsum (CIESM 2008 and references therein). Between 5.56 ± 0.005 Ma and 5.532 ± 0.0046 Ma (Cosentino et al. 2013), likely in correspondence with the TG12 glacial peak (5.55 Ma; Shackleton et al. 1995; Hodell et al. 2001; Cosentino
9
et al. 2013), the isolation of the Mediterranean from the Atlantic Ocean led to evaporative drawdown of the sea level (CIESM 2008). Marginal areas of the basin were subaerially exposed and erosion created the regional intra-Messinian unconformity, also known as the Messinian Erosional Surface (MES; Guillemin and Honzay 1982; Costa et al. 1986; Cita and Corselli 1990; Escutia and Maldonado 1992; Riding et al. 1999; Guennoc et al. 2000; Roveri et al. 2001; Rouchy et al. 2003; Lofi et al. 2005; Soria et al. 2005; Cornée et al. 2006; Maillard et al. 2006; Roveri et al. 2008; Garcia-Castellanos et al. 2009; Ryan et al. 2009; Sampalmieri et al. 2010; Cosentino et al. 2010a; Cosentino et al. 2013). Coinciding with development of the MES, the evaporitic stage of the MSC started just before 5.532 ± 0.0046 Ma (Cosentino et al. 2013). Two post-evaporitic units, p-ev1 and p-ev2, separated by a regional unconformity called LM1 (5.42 Ma; Roveri et al. 1998, 2001, 2006, 2008) or MES2 (5.45 Ma; Cosentino et al. 2010a and b; Cipollari et al. 2013a; Cosentino and Cipollari 2012) were deposited above the MES. The lower unit (p-ev1) consists of barren laminated sediments, seep limestones (Sampalmieri et al. 2008, 2010; Iadanza et al. 2013), sediments eroded from the basin margins (Resedimented Lower Gypsum; CIESM 2008), and in the deep basins, a thick halite layer (Lofi et al. 2011, and references therein; Speranza et al. 2013). The Resedimented Lower Gypsum records a transition from hyper- to hypohaline conditions (Roveri et al. 2008; Sampalmieri et al. 2010), sometimes including a brackish-water fauna that is associated with the Lago-Mare event (Hsü et al. 1973; Cita et al. 1978; Rouchy 1982; Emeis et al. 1996; Orszag-Sperber 2006; Grossi et al. 2008; Faranda et al. 2013). The spreading of this brackish to fresh fauna is what characterizes the sediments of the post-evaporitic upper unit (p-ev2, Grossi et al. 2008). The switch to an essentially brackish environment has been linked to wetter conditions following glacial stage TG12 (Van Der Laan et al. 2006), which was characterized by increased precipitation and runoff throughout the Mediterranean (Orszag-Sperber et al. 2000; Rouchy et al. 2001; Griffin 2002; Pierre et al. 2006; Willet et al. 2006; Reuter et al. 2011; Cosentino et al. 2012). The enhanced production of sediments observed in some marginal basins during the Lago-Mare event of the MSC has been interpreted as a consequence of the climatic shift from drier to wetter conditions and the resultant increase in runoff and erosion (Willett et al. 2006; Roveri et al. 2008), perhaps coupled with tectonic activity (Cosentino et al. 2006). The end of the MSC corresponds to the re-establishment of the connection between the Atlantic and the Mediterranean and the re-flooding of the Mediterranean Basin, which occurred at the onset of the
10
Pliocene (5.33 Ma; Iaccarino et al. 1999a and b; Iaccarino and Bossio 1999; Orszag-Sperber 2006 and references therein; Pierre et al. 2006; Gennari et al. 2008; Cipollari et al. 2013a).
1.4. Stratigraphy of the Adana Basin
The sedimentary fill in the Adana Basin unconformably lies above Palaeozoic and Mesozoic clastic, carbonate, and ophiolitic rocks, which form the regional basement that is part of the Tauride nappes. The base of the fill consists of Oligocene fluvial and lacustrine sediments of the Karsanti Formation, pertaining to the Karsanti intermontane basin (Schmidt 1961; Gürbüz and Kelling 1993; Yetiş et al. 1995; Williams et al. 1995; Gürbüz and Ünlügenç 2001). Based on the extent and the geometry of the Oligocene-lower Miocene fluvial red beds of the Gildirli Formation, they are the first deposits that can be strictly associated with the Adana Basin proper (Schmidt 1961; Görür 1979; Yetiş 1988; Ünlügenç et al. 1991, 1993; Gürbüz and Kelling 1991, 1993; Yetiş et al. 1995; Gürbüz and Ünlügenç 2001). These units are followed by and pass laterally into shallow marine fossiliferous sandstone, siltstone, marls, and sandy limestone of the Aquitanian-Burdigalian Kaplankaya Formation (Yetiş et al. 1995; Cronin et al. 2000; Nazik 2004). The coarse marine deposits of the Kaplankaya Formation also laterally pass into the Burdigalian – Langhian, reefal Karaisali Formation (Görür 1979; Cronin et al. 2000; Nazik 2004) and the lower portion of the Çingoz Formation (Schmidt 1961). The latter is a Burdigalian – early Serravallian turbidite fan system (Görür 1979; Yetiş and Demirkol 1986; Yetiş 1988; Gürbüz and Kelling 1993; Williams et al. 1995; Yetiş et al. 1995: Gürbüz 1999; Cronin et al. 2000) deposited along the NW margin of the Adana Basin; it passes laterally into the lower portion of the Serravallian Guvenç Formation, which consists of deep marine clays passing upward into sandy, shallow marine deposits (Ünlügenç et al. 1991; Nazik and Gürbüz 1992; Gürbüz and Kelling 1993; Yetiş et al. 1995). The first regressive event from the onset of deposition in the Adana Basin is reported to have occurred in late Serravallian - early Tortonian time (Yetiş 1988; Ünlügenç 1993; Yetiş et al. 1995). This event was associated with the deposition of the continental and shallow marine deposits of the Tortonian – early Messinian Kuzgun Formation, which unconformably lies above the deep marine sediments of the Guvenç Formation. In turn, the strata of the Kuzgun Formation transition upward into a cyclical succession of anhydrites and black shales, recording a younger regressive phase resulting in the main evaporative event (Primary Lower Gypsum) of the MSC (Cosentino et al. 2010a and b)
11
Recently Cosentino et al. (2010a and b), Cipollari et al (2013a) and Faranda et al. (2013)used new biostratigraphic data and lithostratigraphic correlations to revise the Messinian stratigraphy of the Adana Basin (Fig. 2A). They recognized two new unconformities in the basin that can be ascribed to two different stages of the MSC (CIESM 2008): (1) the base of the Resedimented Lower Gypsum (Gökkuyu Gypsum member) corresponds to the MES, which is constrained between 5.56 ± 0.005 Ma and 5.532± 0.0046 Ma (Cosentino et al. 2013) and cuts down to either the Primary Lower Gypsum or the pre-evaporitic Tortonian-early Messinian deposits of the Kuzgun Formation (Cosentino et al. 2010a; Cipollari et al. 2013 a; Faranda et al. 2013); and (2) the base of the fluvial conglomerates and marls of the Handere Formation, which corresponds to a second erosional surface (MES2; ~5.45 Ma; Cosentino et al. 2010b; 2013) and cuts down-section to either the Primary Lower Gypsum, the Resedimented Lower Gypsum, or even the pre-evaporitic Tortonian-early Messinian deposits of the Kuzgun Formation (Cosentino et al. 2010b; Cipollari et al. 2013a; Faranda et al. 2013). Both the Resedimented Lower Gypsum (p-ev1) and the continental sediments of the Handere Formation (p-ev2) contain ostracods with Paratethyan affinities pertaining to the late Messinian Lago-Mare biofacies (Grossi et al. 2008; 2011). The Resedimented Lower Gypsum in the Adana Basin has
been constrained by Cipollari et al. (2013a) and Faranda et al. (2013) to the Loxoconcha mülleri Zone (Gliozzi et al. 2010; Grossi et al. 2011), whereas the fluvial conglomerates and marls of the Handere Formation are part of the Loxocorniculina djafarovi Zone (Cosentino et al. 2010b; Gliozzi et al. 2010; Grossi et al. 2011; Cipollari et al. 2013a; Faranda et al. 2013). At the top of the Messinian stratigraphic succession, above a Zanclean regional flooding surface (5.33 Ma), lie the lowermost Zanclean deep-marine gray clays of the Avadan Formation (Cipollari et al. 2013a). In the S-SE part of the Adana Basin, Quaternary alluvial sediments deposited by the Seyhan and Tarsus rivers cover the older units of the Adana Basin stratigraphic succession.
We studied the sedimentary record of the Adana Basin in the light of the recently revised stratigraphy with the main purpose of: (i) finding evidence for uplift of the SE margin of the CAP, and (ii) defining the tectonic context of this depocentral area.
12
1.5. Methodology
1.5.1. Seismic Interpretation
Based on the integration of the classic stratigraphy proposed for the Adana Basin (Schmidt 1961; Görür 1979; Yetiş 1988; Ünlügenç et al. 1991; 1993; Gürbüz and Kelling 1993; Yetiş et al. 1995; Gürbüz 1999; Gürbüz, and Ünlügenç 2001; Nazik 2004) with the stratigraphy recently proposed by Cosentino et al. (2010a and b), Cipollari et al. (2013a), and Faranda et al. (2013) for the Messinian deposits of the Adana Basin, we outline a new depositional history derived from seismic stratigraphy (Fig. 2B). We used more than 600 km of onshore seismic reflection profiles, recording up to 7s two-way travel time (TWT), acquired and processed between 1970 and 1988 by the Turkish Petroleum Corporation (TPAO; Fig. 2B). To validate our interpretations, we correlated the different units imaged in seismic reflection profiles with surface exposures in the vicinity of the seismic lines, mainly along the uplifted margins of the Adana Basin. In addition, to check the stratigraphy imaged from the seismic profiles, we used the lithologic descriptions of a few well logs made available to us by TPAO (Adana 1; Akyar 1; Çakit 1; Dumandere 1; Yenice 1; Yenice 2).
1.5.2. Volume Calculation
To produce an isopach map of the sesimic facies corresponding to the late Lago-Mare facies of the Handere Formation (Fig. 3), we interpolated regions between our interpreted seismic lines using the 3D software program Petrel, which allowed us to reconstruct the top and bottom surfaces of the seismic unit. We used the surfaces as boundaries to calculate the unit volume using the software MATLAB.
1.5.3. Provenance Analysis
To understand the source areas of clasts within the conglomerates of the Handere Formation, we determined the lithologies, their percentages, and their paleocurrent directions. With the aim of identifying potential changes in the catchment areas from late Messinian to today, we compared the percentages of lithologies found in the Messinian samples with the values obtained from i) clast counting of two recent alluvial deposits and ii) exposed lithologies in the present-day catchments located on the SE margin of the CAP.
13
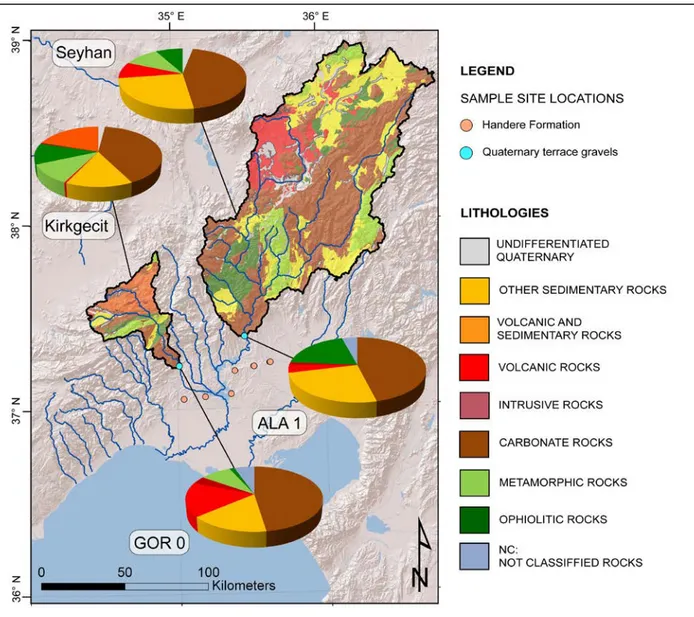
For the clast counts we sampled eight sites; six sites were sampled within the conglomerates of the Handere Formation (TOP 0, KAR 0, MEN 0, ECE 0, CER 0, IMAM 0; Fig. 4), and two sites were sampled from conglomerates of two recent river terraces located on the NW margin of the Adana Basin (GOR 0, ALA 1; Fig. 4). All pebbles contained within a 1m2 square were counted, amounting to a total of ~300 to 500 clasts per site (Fig. 5). Almost all pebbles were well preserved. A minor percentage presented a partly weathered surface, although this characteristic was not related to a particular lithology. However, gabbro pebbles were generally weathered (Fig. 5B), and easily disintegrated upon a hammer stroke; because these clasts are more likely to have been damaged during transport, this lithology, which we associate with an ophiolitic succession (“ophiolites” in Table 1), has probably been slightly underestimated in our analysis.
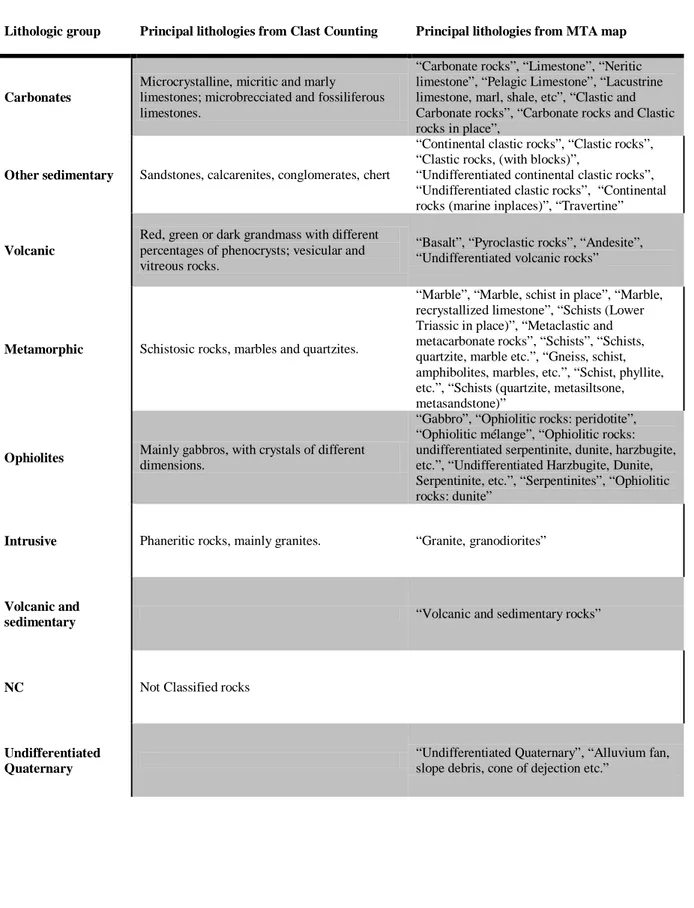
We assigned every pebble to a lithologic class after observing it with a 10x lens and recording its reaction to hydrochloric acid. In few cases, thin sections were needed to better define the lithology. These classes were further differentiated (Table 1) to compare them with the 1:500,000 “Adana” geological map (Fig. 6; MTA: AA.VV. 2002; Bilgiç and AA.VV 2002; Ulu and AA.VV 2002a and b). The lithological map of the Turkish Geological Survey (MTA) was also consulted to define the eight main lithological categories that we identified in our analysis (Table 1).
We took a total of 230 paleocurrent measurements from the conglomerates of the Handere Formation based on the imbrications of prolate clasts at 17 different sites (Fig. 7). The analysis of the paleocurrent measurements coupled with the clast counting provided rigorous constraints on the contributing areas that led to the deposition of the Handere Formation upper sub-unit.
1.5.4. Evolution of the drainage system
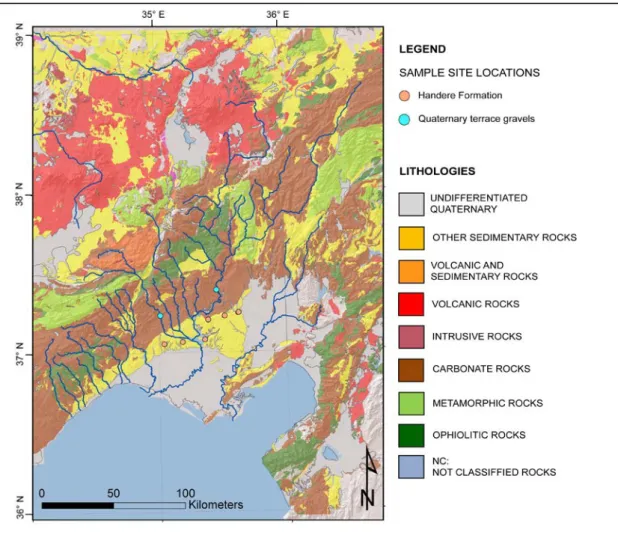
To link our clast counting analysis to source areas and to identify potential changes in the drainage areas that occurred between late Messinian and today, we calculated the percentages of lithologies currently outcropping in the catchments drained by streams flowing into the Adana Basin (Figs. 8 and 9). We extracted the outcropping areas of each lithology in the present drainage basins after integrating a 1:500,000-scale digital geologic map of Turkey (AA.VV. 2002; Bilgiç and AA.VV 2002; Ulu and AA.VV 2002a and b) into a Geographic Information System (ArcMap 9.3).
14
We also investigated how drainage systems may have evolved over time considering the uplift rates reported in Schildgen et al. (2012b) and Cipollari et al. (2013a), which we used to reconstruct the paleo-topography of the southern Central Anatolian Plateau margin and the Adana Basin at ~5.45 Ma (Fig. 10). To make this reconstruction, we separated the digital elevation model of the area in three tectonic domains: the internal portion of the plateau, the margin of the plateau, and the Adana Basin. For each tectonic domain, we derived a different equation obtained using the uplift or subsidence rate. For areas in which topography grew, we applied an exponential decrease to the modern elevations, assuming that the highest peaks today have been uplifted more than the areas of lower elevation. We applied the equations to an Advanced Spaceborn Thermal Emission and Reflection Radiometer digital elevation model (DEM) that we re-sampled to 90-m resolution using the Spatial Analyst function in ESRI’s ArcMap 9.3. After topography restoration at ~5.45 Ma, we re-assembled the different tectonic domains and then extracted the river network from the new DEM. We made no attempt to restore the river offset caused by motion along the Kozan and Ecemiş faults.
1.6. Results
Our results integrate seismic stratigraphy, 3D reconstructions of the unit surfaces from the seismic lines, volume calculation of the late Lago-Mare sub-unit of the Handere Formation, and provenance analysis. Below, each of these aspects will be addressed separately.
1.6.1. Seismic stratigraphy
From the 34 seismic profiles that we interpreted, we distinguish five different seismic units (MS2, MS3, MS4a, MS4b, and MS5), and identify four regional erosional surfaces (U1, U2, MES1, and MES2). Next, we describe how we correlate these units and the identified erosional surfaces with what has been recently reported for the Adana Basin (Fig. 2 A and B; Williams et al. 1995; Cosentino et al. 2010b; Cipollari et al. 2013a; Faranda et al. 2013).
In all of the interpreted seismic profiles, the oldest erosional surface (U1) separates the Central Tauride basement rocks from the first seismic unit (MS2), comprising the Oligocene – Serravallian portion of the Adana Basin fill (Schmidt 1961; Gürbüz and Ünlügenç 2001; Nazik 2004). A younger erosional
15
surface (U2) separates MS2 and MS3. The latter is a seismic unit corresponding to Tortonian-lower Messinian deposits of the Kuzgun Formation, including the Messinian Lower Evaporites at the top. At the NW margin of the basin, Cosentino et al. (2010a,b) reported the top of MS3 to be characterized by a few,
equally-spaced and
high-amplitude reflectors corresponding to the Primary
Lower Gypsum of the MSC (LE in Fig. 2B). Where the high-amplitude reflectors corresponding to the Primary Lower Gypsum are missing, an erosional surface cuts down to MS3. We interpret this erosional surface to be the Messinian Erosional Surface (MES). Above the MES, a peculiar seismic facies characterized by high-amplitude and discontinuous reflectors (MS4a) is tentatively correlated with the Resedimented Lower Gypsum of the MSC (CIESM 2008), which, according to Cipollari et al. (2013a) and Faranda et al. (2013), is widely exposed along the uplifted NW margin of the Adana Basin.
Fig u r e 2 . [A ] T he M e ss ini a n S a li ni ty C ri si s i n t he A da na B a si n. 5. 33: Z a nc le a n f loodi ng e v e nt ; c a . 5. 45 – 5. 33: upp e r L a go -M a re s e di m e nt s de pos it ed; 5. 56: E nd of 17t h c yc le of L ow e r Ev a p o rite s; subs e qu e nt s e a -l e ve l dr a w d ow n, e ros ion of L ow e r E va por it e s t o f or m M e ss ini a n E ros iona l S ur fa c e ( M E S ), a nd de pos it ion of R e se di m e nt e d L ow e r E v a p o rite s ( R LE) . 5 .9 7 : S ta rt of M e ss ini a n S a li ni ty C ri si s a nd ons e t of de pos it ion of L ow e r E va por it e s ( L E ). [ B ] L oc a ti on m a p of t he i nt e rpr e te d s e is m ic pr of il e s a nd l ine -dr a w ing of t he s e is m ic pr of il e hi ghl ight e d i n t he m a p s how ing t he ne w s e is m os tr a ti gr a phy pr opos ed f or t he A da na B a si n. S e pa ra te d by t ra c e s of un c onf or m it ie s a nd t ra ngr e ss ive s u rfa ce s (i n re d ) a re t h e m a in s e is m o str a tig ra p h ic u n its , inc ludi ng M S 2: O li go – S e rr a va ll ia n s e que nc e ; M S 3: T or toni a n K uz gun F or m a ti on; L E : L ow e r E va por it e s; M S 4a : R e se di m e nt e d L ow e r G yps um ; M S 4 b: uppe r M e ss in ia n La g o -M a re u n it, c ons is ti ng of a n a lt e rna ti on of c o ngl om e ra te s a nd m a rl s be a ri ng a br a cki sh -w a ter f a u n a; M S 5 : P li o c en e u n it . S u rf a c es i n cl u d e P : b a se Z a n c le an f lo o d in g s u rf ac e ( 5 .3 3 M a ); M E S 2 : l a te M e ss in ia n E ro si o n al S u rf a ce ( 5 .4 5 M a) ; M E S : ea rl y M es si n ian E ro si o n al S u rf ac e ( 5 .6 0 M a ); U 2 : l a te S e rr a v a ll ia n – e a rly To rto n ia n Er o sio n a l S u rf a c e ; U 1 : la te O lig o c e n e – e a rl y A qui ta ni a n E ros iona l S ur fa c e . L ine s i n the m a p c or re spon d t o t he t ra c e s of t he s e is m ic pr of il e s us e d f or t he r e c ons tr uc ti o n of t he M S 4b i sopa c h m a p a nd v ol um e c al c ul a ti on. I sopa c h m a p a nd vol um e c a lc u la tio n h a v e be e n p e rf or m e d f or t he a re a c or re spon di ng t o t he pol y gon i n t he m a p.
16
Table 1. List of the principal lithologic groups used for provenance analysis.
1Lithologic group Principal lithologies from Clast Counting Principal lithologies from MTA map
Carbonates
Microcrystalline, micritic and marly limestones; microbrecciated and fossiliferous limestones.
“Carbonate rocks”, “Limestone”, “Neritic limestone”, “Pelagic Limestone”, “Lacustrine limestone, marl, shale, etc”, “Clastic and Carbonate rocks”, “Carbonate rocks and Clastic rocks in place”,
Other sedimentary Sandstones, calcarenites, conglomerates, chert
“Continental clastic rocks”, “Clastic rocks”, “Clastic rocks, (with blocks)”,
“Undifferentiated continental clastic rocks”, “Undifferentiated clastic rocks”, “Continental rocks (marine inplaces)”, “Travertine”
Volcanic
Red, green or dark grandmass with different percentages of phenocrysts; vesicular and vitreous rocks.
“Basalt”, “Pyroclastic rocks”, “Andesite”, “Undifferentiated volcanic rocks”
Metamorphic Schistosic rocks, marbles and quartzites.
“Marble”, “Marble, schist in place”, “Marble, recrystallized limestone”, “Schists (Lower Triassic in place)”, “Metaclastic and metacarbonate rocks”, “Schists”, “Schists, quartzite, marble etc.”, “Gneiss, schist, amphibolites, marbles, etc.”, “Schist, phyllite, etc.”, “Schists (quartzite, metasiltsone, metasandstone)”
Ophiolites Mainly gabbros, with crystals of different
dimensions.
“Gabbro”, “Ophiolitic rocks: peridotite”, “Ophiolitic mélange”, “Ophiolitic rocks: undifferentiated serpentinite, dunite, harzbugite, etc.”, “Undifferentiated Harzbugite, Dunite, Serpentinite, etc.”, “Serpentinites”, “Ophiolitic rocks: dunite”
Intrusive Phaneritic rocks, mainly granites. “Granite, granodiorites”
Volcanic and
sedimentary “Volcanic and sedimentary rocks”
NC Not Classified rocks
Undifferentiated Quaternary
“Undifferentiated Quaternary”, “Alluvium fan, slope debris, cone of dejection etc.”
1 In the first column the selected lithologic groups are listed; in the second column, all the lithologies found in analyzing
the samples for clast counting are related to their pertaining group. In the third column the formations reported in the Turkish General Directorate of Mineral Research and Exploration (MTA) map are grouped in order to be comparable with the clast counting analysis.
17
A second intra-Messinian unconformity (MES2) cuts down to either the amplitude/discontinuous reflectors of the Resedimented Lower Gypsum (unit MS4a), the high-amplitude/continuous reflectors of the Primary Lower Gypsum, or the pre-evaporitic Tortonian-early Messinian deposits of the Kuzgun Formation (MS3). The seismic facies overlying the MES2 (unit MS4b) is characterized by more continuous reflectors, which should correspond to the upper sub-unit of Messinian Handere Formation (Cosentino et al. 2010b; Cipollari et al. 2013a), with its channelized coarse-grained fluvial deposits and interbedded marls. If this interpretation is correct, the MS4b seismic facies was associated with a very high sedimentation rate, because it shows a significant thickness (up to 1.4 s TWT) deposited in 120 kyr, from about 5.45 to 5.33 Ma (Cosentino et al. 2010b, 2013) (Fig. 2). At the top of MS4b, the seismic reflection lines clearly show a conformable surface (P), corresponding to the Messinian/Zanclean transition. This surface represents the early Pliocene flooding event, which happened at 5.33 Ma throughout the Mediterranean Basin (Iaccarino et al. 1999a and b; Iaccarino and Bossio 1999; Orszag-Sperber et al. 2006 and references therein; Pierre et al. 2006; Gennari et al. 2008; Cipollari et al. 2013a). That flooding surface is overlain by a seismic facies with continuous, high-frequency reflectors, corresponding to the Pliocene-lower Pleistocene marine clays of the Avadan Formation (Cipollari et al. 2013a).
1.6.2. Volume Calculation of the late Lago-Mare facies (Handere Formation)
We use the results of the seismic profile interpretation to identify the seismic facies MS4b, which should correspond to the coarse-grained fluvial deposits and marls of the Handere Formation based on field evidence. To estimate the volume of this thick late Lago-Mare sedimentary body within the Handere Formation, we first extrapolated a TWT isopach map of the corresponding seismic facies (MS4b). Because the available seismic profiles cover only a limited area of the Adana Basin, the calculated volume is a minimum value. We extrapolated an isopach map for an area of ~3500 km2; however, within the region covered by seismic lines, the Lago-Mare deposits are present only in the SW portion of the area (Fig. 3). The time-depth conversion was done using the Vp interval velocities applied for seismic processing integrated on the interval of interest; the resulting Vp value of the MS4b seismic facies is 2700 m/s. Using this velocity, together with 3D upper and lower surfaces constructed in Petrel with the seismic lines, we calculated a
18
maximum thickness of 1.9 km, and ~1500 km3 as the total volume of deposited sediments during a time span of approximately 120 kyr. Due to the relative scarcity of seismic coverage in the depocentral area of the basin and the possible error associated with the automatic surface reconstruction performed by the software, we estimate the error in the calculations to be ~20% for the thickness and 25% for the volume; therefore we calculated a corrected minimum thickness of ~1.5 km and a corrected minimum volume of ~1100 km3. Where the sediment thickness is greatest, the local minimum sedimentation rate is therefore ~12.5 mm/yr.
1.6.3. Provenance analysis
1.6.3.1. The Handere Formation sampling sites
We sampled six sites for clast counting in the late Lago-Mare sub-unit of the Handere Formation (Fig. 4 and 6). All of the sampling sites show a predominant S, SE or SW paleocurrent direction, and pebbles are polymict. Sampling site MEN 0 is characterized by several channel-fill, matrix-supported conglomerates, with lenticular shapes, variable thicknesses, and erosive bases carved into grayish-brownish pelites. The setting suggests that deposition occurred in braided-river channels. The matrix consists of non-cemented sand and clay, and the degree of lithification is low. Pebbles are of different dimensions, from several millimeters to tens of centimeters, all well rounded, often imbricated, and crudely graded. The outcrops at sample locations KAR 0 and TOP 0 are very similar, characterized by braided channels with predominantly clast-supported conglomerates, with a yellowish/reddish sandy matrix, well cemented by calcite at the KAR
Figure 3. Isopach map of the Lago-Mare conglomerates and marls pertaining to the Handere Formation. Black lines are the trace of the available seismic profile; the dashed white line is the trace of the seismic profile in Fig. 2. Due to the poor data coverage in the areas of higher thickness, we estimate an error of ~20% on
19
0 sampling site. Yellowish banks of sandstone are present. Pebbles are dimensionally slightly more homogeneous, ranging from a few millimeters up to 20 cm, rounded to well rounded, with roundness clearly depending on lithology. Samples ECE 0 and CER 0 were collected from outcrops characterized by channel-fill, non-cemented conglomerates, with a major fraction of yellowish sandstone. Pebbles are well-rounded, with grain sizes ranging from a few millimeters to 15-20 cm. CER 0 includes slightly polished Ostrea shells as clasts (Fig. 5D), indicating a very short transport distance from the source area. IMAM 0 is the easternmost sampling site, which is quite different from the others. The outcrop consists of ~ 30 m of conglomerates, micro-conglomerates, coarse sandstones, calcarenites, carbonate levels, sands, and a thick layer of clay affected by pedogenesis. Conglomerates are predominant; they are organized in braided channels, with a yellowish/reddish matrix. Pebbles are dimensionally more homogeneous than in the other sampling sites, with 75% of them between 2 to 3 and 15 cm in diameter. They are either cemented or not, clast- or matrix-supported. The clay horizons are non-fossiliferous on hand lens inspection.
Figure 4. Sample site locations. Six sites were sampled from the conglomerates of the upper Messinian Handere Formation (pink), and two were collected from two recent terraces (blue). In the background the simplified geological map; classes are illustrated in Table 1.
20
1.6.3.2. Provenance analysis of the clasts in the late Lago-Mare conglomerates of the Handere
Formation
The percentages of the lithologies constituting the conglomerates of the Handere Formation (Table 2; Fig. 6) are quite similar, generally with a predominance of carbonates and other sedimentary rocks, including sandstones, calcarenites, conglomerate clasts, chert, volcanic rocks, and minor amounts of ophiolitic and metamorphic rocks. Qualitatively, this composition points to the SE portion of the CAP as a source area. The northeastern-most sample, IMAM 0, differs from the others. It is predominantly comprised of carbonates and other sedimentary rocks, and shows a very small percentage of volcanic rocks, with neither ophiolitic nor metamorphic rocks. Most of the paleocurrent directions record flow toward the S, SE, or SW (Fig. 7), in agreement with the provenance data. Thus, the clasts must have come into the Adana Basin from the SE margin of the CAP (Fig. 6). However, paleocurrents from IMAM 0 show flow toward the NW or W (Figs. 5E and 7), potentially indicating a source in the Misis Mountains at the present-day SE margin of the basin. Lithologically, the Misis Mountains consist predominantly of carbonates, with minor amounts of clastic and volcanic rocks. The similarity between the clast compostion of the upper Messinian conglomerates at IMAM 0 (Fig. 6) and the lithologic composition of the Misis Mountains suggests the existence of a fluvial system sourced from the Misis Mountains during the deposition of IMAM 0. This fluvial connection no longer exists today, corroborating the notion that the drainage system in this area of the Adana Basin must have changed between the late Messinian and today.
Figure 5. Field pictures. Sample site CER 0 [A] before and [B] after the sampling. The squares are 1 x 1 m wide. [C] Detailed view of CER 0 sample site. Weathering of a gabbroid pebble and [D] clast constituted by a slightly polished ostrea shell, indicating a relatively short transport from the source area. [E] IMAM 0 sample site, where paleocurrent can be inferred from the pebbles’ arrangement. Large-size pebbles are all located on the left of the picture, upstream in comparison with a riverbed obstacle. In the shadow zone, downstream of the riverbed obstacole, only finer grained pebbles were deposited because of the flow pressure drop.
21
Figure 6. Results of clast counting performed on the samples taken in the upper Messinian conglomerates. Dots show the sample site locations. Almost all the samples show similar lithological percentages, with a predominance of sedimentary rocks but relatively high percentages of volcanic and metamorphic and/or ophiolitic rocks. The easternmost sample (IMAM 0) is the only sample differing from the others, characterized by a predominance of sedimentary rocks, absence of metamorphic or ophiolitic rocks, and a small percentage of volcanic rocks (see Table 2 for percentages).
Figure 7. Paleocurrent directions measured in the
Handere Formation conglomerates. White dots show the location of the measurement sites, grey dots show the location where both paleocurrent directions measurements and samples for clast counting were taken. Almost all the samples show a flow direction toward the SE/SW. The northeastern-most sector, however, shows a clear countertrend, with material being transported from SE to NW. This variation is in good agreement with the results from clast counting, showing similar lithologic percentages with the exception of the northeastern-most sample (IMAM 0).
22
1.6.4. Evolution of the drainage system
1.6.4.1. Present-day catchments versus present-day provenance
Before comparing the composition obtained from the provenance study in the upper Messinian conglomerates of the Handere Formation with exposed lithologies in the present-day drainage basins, we tested if the two datasets are likely to be comparable. To do this, we compared the lithologic percentages obtained from the samples taken from two recent river terraces with the composition of outcropping lithologies in the corresponding present-day drainage basins (Fig. 8). Our aim was to validate the methodology and to quantify the role of differential erosion for different lithologies.
Figure 8. Lithologic percentages of present drainages versus recent fluvial terraces. Dots show the location of the sample sites. The percentages derived from clast counting performed on the conglomerates of two recent terraces (ALA1 and GOR 0) are similar to those calculated for the correspondent present drainage basins – those of the Seyhan and Kirkgecit rivers, indicating good agreement of the percentages calculated with the two different methodologies. Geological map modified from MTA “ADANA” 1:500,000-scale map.
23
The clast composition at both terrace-sampling sites is strongly correlated with the outcropping lithologies in the corresponding drainage basins, with a predominance of carbonates and other sedimentary rocks, and smaller percentages for the remainder (Fig. 8). The contribution of volcanic rocks is also comparable between terraces and the modern drainage basins. However, differences emerge when considering the percentages of ophiolitic and metamorphic rocks; ophiolitic rocks outcropping in the Seyhan catchment basin are 12% less than the corresponding material found at terrace site ALA 1, which contained no metamorphic clasts. The Kirkgecit catchment shows a difference in percentages of ~2% (for metamorphic rocks) and ~10% (for ophiolitic rocks) with respect to the corresponding GOR 0 terrace (Fig. 8). Nevertheless, percentages are broadly similar if the metamorphic and ophiolitic rocks are summed. Overall, the sediments in the modern river channels and the Quaternary terraces qualitatively and quantitatively correspond to the exposed lithologies in the catchment, suggesting that the role of differential erosion in affecting the composition of the sampled conglomerates is negligible.
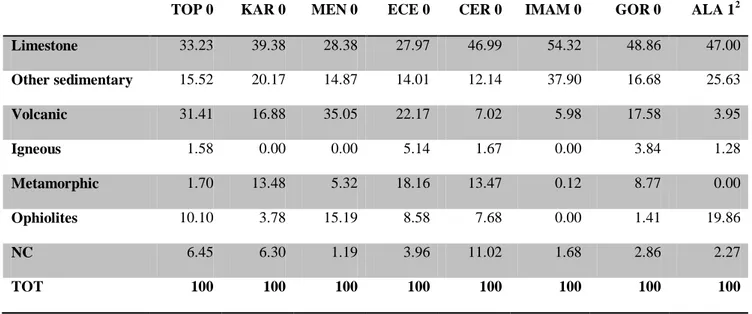
Table 2. Percentages of the selected lithologic groups in the samples taken for clast counting.
TOP 0 KAR 0 MEN 0 ECE 0 CER 0 IMAM 0 GOR 0 ALA 12
Limestone 33.23 39.38 28.38 27.97 46.99 54.32 48.86 47.00 Other sedimentary 15.52 20.17 14.87 14.01 12.14 37.90 16.68 25.63 Volcanic 31.41 16.88 35.05 22.17 7.02 5.98 17.58 3.95 Igneous 1.58 0.00 0.00 5.14 1.67 0.00 3.84 1.28 Metamorphic 1.70 13.48 5.32 18.16 13.47 0.12 8.77 0.00 Ophiolites 10.10 3.78 15.19 8.58 7.68 0.00 1.41 19.86 NC 6.45 6.30 1.19 3.96 11.02 1.68 2.86 2.27 TOT 100 100 100 100 100 100 100 100
1.6.4.2. Present-day catchments versus Handere Formation clasts provenance
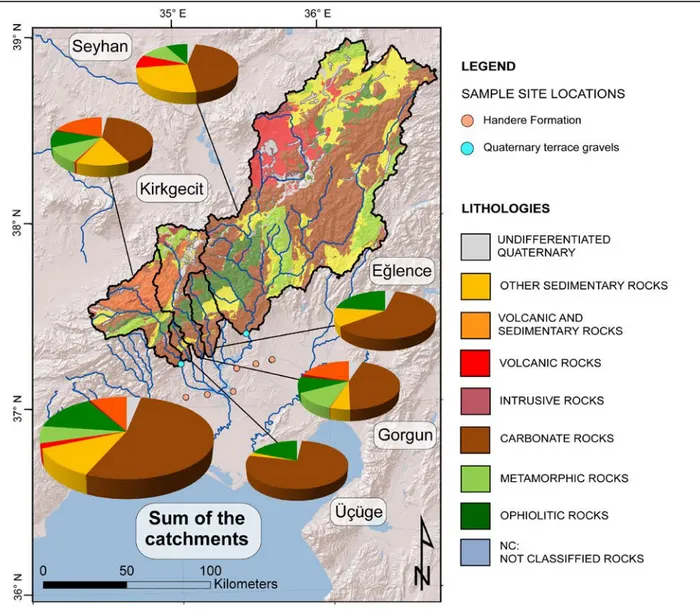
We calculated the percentages of exposed lithologies for all the catchments presently draining into the Adana Basin, including the Kirkgecit, Seyhan, Üçüge, Gorgun, and Eğlence rivers (Fig. 9). The exposed
2
MEN 0, TOP 0, KAR 0, ECE 0, CER 0 and IMAM 0 were collected from the conglomerates of the Handere Formation; GOR 0 and ALA 1 were collected from two different recent terraces.
24
lithologies are mainly carbonates, with a smaller component of ophiolites, sandstones, conglomerates and chert. Exposures of volcanic rocks do not occur in all of the basins. Overall, carbonates, sandstones, conglomerates, and chert dominate. The present-day catchments show different percentages of the exposed lithologies when compared with the clasts of the Handere Formation upper sub-unit; the percentage of volcanic material changes the most, showing a clear reduction from the relatively large fraction represented in the upper Messinian conglomerates (~10-35%) compared with the volcanic material outcropping in the present catchments (~0-10%). This reduction of clasts of volcanic origin is offset by a major coeval increase in the proportion of carbonate rocks (from ~30-55% to ~40-75%).
Figure 9. Lithologic percentages of the present drainage basins. A significant variation in lithologic percentages is evident when comparing this figure with Fig. 6, showing the results of clast counting performed on the upper Messinian conglomerates of the Handere Formation; the percentage of volcanic material decreases dramatically from the late Messinian to Present.
25
1.7. Discussion
Due to the limited transport distance of coarse sedimentary material (Kodama 1994; Ferguson et al. 1996; Wandres et al. 2004; Boggs 2009), conglomerate provenance analysis is often used to constrain the uplift and erosional exhumation history of the source area (Zapata et al. 2010). The refined Messinian stratigraphy of the Adana Basin (e.g. Cosentino et al. 2010b; Cipollari et al. 2013a; Faranda et al. 2013) provided us with the unique opportunity to recognize and stratigraphically constrain seismic facies MS4b, which can be correlated with the Lago-Mare facies of the Messinian Handere Formation. This seismic facies shows a two-way travel time of up to 1.4 s, corresponding to a succession of fluvial deposits up to 1.5-km thick and a local sedimentation rate of at least 12.5 mm/yr. Our volume calculation results in a minimum of 1100 km3 deposited in ~120 kyr, over a region of ~3000 km2.
This significant sedimentary influx into the Adana Basin approximately between 5.45 and 5.33 Ma could be explained as a consequence of (i) increased runoff/erosion as a result of enhanced precipitation during the Lago-Mare stage of the MSC; (ii) a major tectonic event inducing uplift in the surrounding areas; or (iii) a combination of both processes. To try to distinguish among these possibilities, we compared thicknesses and inferred sedimentation rates of the sediment deposited during the Lago-Mare stage of the MSC in the Adana Basin with coeval units deposited in different parts of the Mediterranean realm. When present, Lago-Mare deposits in the Eastern Mediterranean are characterized by different lithofacies. These include marlstones with interbedded turbiditic sandstones and siltstones as reported at DSDP 376, north of the Florence Rise (Hsü et al. 1978); alternations of silty clay, silt, and sand at ODP 160 – Site 968, south of Cyprus (Emeis et al. 1996); fluvial conglomerates, sandstones, and marls in Israel (Druckman et al. 1995); carbonates and conglomerates interbedded with paleosoils observed in the Pissouri Basin, southern Cyprus (Rouchy et al. 2001); dark marl deposits containing abundant carbonate gravels, caliche-like concretions and intercalations of conglomerates observed in the Polemi Basin, southern Cyprus (Rouchy et al. 2001), and, finally, clays, sandstones, and fluvial conglomerates in the upper Messinian Lago-Mare deposits recently found in the Messarà Plain of Crete, (Cosentino et al. 2007). Thicknesses span from ~25 m in the Pissouri and Polemi basins (Orszag-Sperber et al. 2000; Rouchy et al. 2001) to several tens of meters, as observed in the Messarà Plain (Cosentino et al. 2007), north of the Florence Rise (Hsü et al. 1978), on the Cyprus lower
26
slope (Emeis et al. 1996; Blanc-Valleron et al. 1998), and onshore Israel (Druckman et al. 1995). Sedimentation rates calculated for these deposits span from 0.2 mm/yr in the Pissouri and Polemi basins (calculated from Orszag-Sperberg et al. 2000, and Rouchy 2001) to 0.43 mm/yr for the Messarà Plain (Crete; calculated from Cosentino et al. 2007), and up to 0.6 mm/yr for the northern flank of the Florence rise (calculated from Hsü et al. 1978). Variability in thickness and inferred sedimentation rates increase when dealing with the Mediterranean as a whole, with more than 250 m of upper Messinian Lago-Mare deposits on the eastern margin of the northern Tyrrhenian Basin (Cipollari et al. 1999) and maximum thicknesses reaching up to several hundreds of meters (> 938 m) as in the case of the Mondragone 1 well, drilled onshore of the Garigliano coastal plain (eastern margin of the central Tyrrhenian Sea), in a basin controlled by active tectonics (Cosentino et al. 2006). These observations from other areas highlight the anomalous thickness of the Adana Basin Lago-Mare sequence, which is up to two orders of magnitude greater than the coeval Eastern Mediterranean sediments. Given that the climatic shift must have impacted the whole region, the elevated thickness should be explained with some other process that, coupled with the enhanced runoff, caused the high sediment production. At the very least, topography must have existed along the northwestern border of the Adana Basin (the CAP southern margin) at the time of deposition of the Handere Formation upper sub-unit, which places the first minimum age constraint on the onset of uplift along the southern margin of the CAP. This result is in good agreement with the maximum age for the start of plateau uplift in central Anatolia proposed by Cosentino et al. (2012) and Schildgen et al. (2012b), who dated the youngest shallow marine sediments outcropping on the top of the southern margin of the plateau to be ~ 8 and 6.7 Ma, respectively. Considering the unusually great thicknesses of the Lago Mare deposits in the Adana Basin, it is also likely that tectonics were active at the time of deposition.
Based on our provenance analysis, the lithologic composition of the present-day basins (Fig. 9) appears to be different from the clast composition of the upper Messinian conglomerates (Fig. 6), especially with respect to the reduced volcanic component in the present-day basins. An extensive area in the NW sector of the geologic map covering the plateau realm (Fig. 3) is mainly characterized by volcanic rocks. However, this region is disconnected from the present-day drainage system due to the high SE margin of the CAP, which defines the Mediterranean/Black Sea drainage divide. The higher percentage of volcanic material in the upper Messinian conglomerates of the Handere Formation thus suggests that during its
27
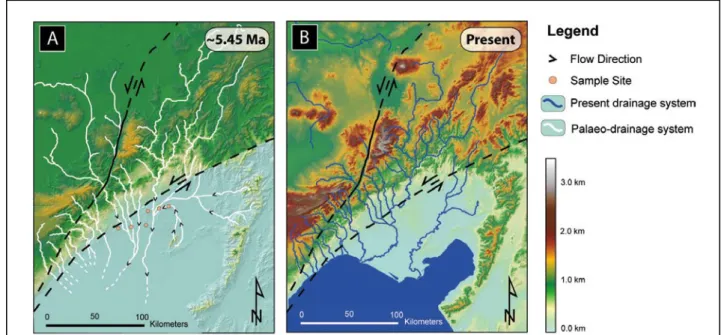
deposition, rivers must have drained from the internal part of the CAP to the Adana Basin. It follows that the SE margin of the plateau cannot have been a significant topographic barrier during the Messinian compared to today. This result also corroborates our hypothesis of a major change in the drainage patterns that was postulated as a result of one of the Handere Formation samples (IMAM 0) having an apparent provenance from the Misis Mountains. A reconstruction of the palaeo-topography at ~5.45 Ma corroborates this hypothesis (Fig. 10); the late Messinian drainage system relative to the restored topography shows major differences from the present drainage system, with palaeo-rivers draining the volcanic-rich areas behind the plateau margin.
Based on both our calculated sedimentation rates and provenance analysis of the clasts of the Lago-Mare conglomerates of the Handere Formation, we suggest that the uplift of the CAP must have started
shortly before 5.45 Ma and helped to produce the voluminous upper Messinian Lago-Mare conglomerates and marls in the Adana Basin. Because the upper Miocene marine sediments along the axis of the southern margin of the CAP are now at more than 2 km elevation, our new results imply a maximum long-term average uplift rate of 0.37 mm/yr since 5.45 Ma at the NW margin of the Adana Basin. Considering the 8-my-old marine carbonates at 2 km elevation (Cosentino et al., 2012), the combined minimum and maximum age constraints confine the long-term average surface uplift rate to be between 0.20 and 0.37 mm/yr along the axis of the CAP southern margin.
Figure 10. Palaeo (A) versus present (B) drainage systems. The traces of the Ecemiş and Kozan faults are shown in black. The sample site locations for the conglomerates of the Handere Formation are shown in (A) for reference. The palaeo-drainage system has not been restored for the possible offset related to movements on the faults.
28
The large sediment volumes and a rapid increase in sedimentation rate in the Adana Basin support earlier suggestions that uplift along the southern margin of the CAP largely resulted from a deep-rooted mechanism (e.g. Cosentino et al. 2012; Schildgen et al. 2012a and b). Importantly, our combined observations from the Adana Basin are consistent with analog (Bajolet et al. 2012) and numerical (Gögüş and Pysklywec 2008) models of the surface response to deep-seated processes involving lithospheric slab delamination and break-off. If we relate the geometry of these models to the tectonic setting of the Adana Basin, it would be expected that the region south of the delamination and break-off experiences rapid subsidence, while the area above the delamination and break-off is uplifted. The subsided area itself is later partially uplifted as the region reaches isostatic equilibrium. Considering the rapid sedimentation rate derived for the Adana Basin starting at 5.45 Ma, together with results demonstrating that the basin was uplifted 350 to 650 m since 5.2 or 5.3 Ma (Cipollari et al. 2013a), our new results offer corroborating evidence for the delamination/break-off hypothesis.
1.8. Conclusions
In the Adana Basin, at the southern flank of the Central Anatolia Plateau, we recognize for the first time a thick seismic facies associated with the second post-evaporitic stage of the Mediterranean MSC (p-ev2; CIESM 2008 and references therein). This facies consists of at least 1100 m3 of conglomerates and marls deposited in a time span of ~120 kyr, between around 5.45 and 5.33 Ma (Cosentino et al. 2013), corresponding to the late Lago-Mare stage of the MSC (Gliozzi et al. 2010; Grossi et al. 2011). Based on the recently revised onshore stratigraphy of the Adana Basin, this unit can be correlated with the fluvial conglomerates and marls of the Handere Formation (Cipollari et al. 2013a; Faranda et al. 2013).
The provenance of the Handere Formation conglomerates documents that the majority of the clasts is sourced from the Eastern Taurus Mountains. Compared with the clast composition of Quaternary terraces and with lithologies outcropping in the present-day catchments, we infer a major change in the drainage system to have occurred between 5.45 Ma and the Quaternary. This change is corroborated by two independent lines of evidence: i) a change in paleocurrent directions, and ii) a reduction of areas overlain by
29
volcanic rocks that drain towards the Adana Basin. Together, these observations indicate disconnection of drainage systems sourced in both the Misis Mountains and the internal portion of the CAP since the deposition of the Lago-Mare conglomerates of the Handere Formation. All these observations support the hypothesis that the CAP southern margin was uplifted during the deposition of the Lago-Mare conglomerates, providing the large amount of material coevally deposited in the Adana Basin and creating a barrier that disconnected the internal portion of the CAP from the present drainage system.
Even if an inferred regional-scale climatic shift from dry to wetter conditions during the time of the deposition of the Lago Mare sediments of the MSC contributed to increased erosion and sediment supply to the Adana Basin, climate change as a sole reason for the anomalously high sedimentation rates is unlikely, since similarly large increases in sedimentation rates are not observed throughout the eastern Mediterranean. In addition, the NW margin of the Adana Basin (the SE margin of the CAP), which we demonstrate was the source area for most of the Handere Formation conglomerates, was still below sea level until at least 8 Ma (Cosentino et al. 2012). For these reasons, we interpret the high sedimentation rate in the Adana Basin to be predominantly tectonically controlled, and tightly linked to uplift of the SE margin of the CAP, which had started by ~5.45 Ma. Our results therefore provide for the first time a minimum age constraint for the timing of this important phase of topographic development along the southern plateau margin of Central Anatolia. Because slab delamination and break-off models (e.g. Gögüş and Pysklywec 2008; Bajolet et al. 2012) illustrate uplift and subsidence in regions that are equivalent to the tectonic setting of the southern CAP margin and the neighboring Adana Basin, our results corroborate earlier suggestions that these deep lithospheric processes provide a viable uplift mechanism for the southern margin of the CAP.

![Figure 5. Field pictures. Sample site CER 0 [A] before and [B] after the sampling. The squares are 1 x 1 m wide](https://thumb-eu.123doks.com/thumbv2/123dokorg/2840129.5092/28.892.90.626.110.442/figure-field-pictures-sample-site-cer-sampling-squares.webp)

![Figure 1. Location map of the study areas and tectonic setting. [A] Regional setting: the study areas are located in the central Anatolian province, between the western Anatolian extensional province (WAEP) and the eastern Anatolian compressional provi](https://thumb-eu.123doks.com/thumbv2/123dokorg/2840129.5092/39.892.107.799.272.692/location-tectonic-regional-anatolian-anatolian-extensional-anatolian-compressional.webp)
