Marriage, fertility, social class and religion
in an Irish industrial city:
Belfast 1911
L I A M K E N N E D Y *, L U C I A P O Z Z I * *, M A T T E O M A N F R E D I N I * * * *Queen’s University of Belfast, **University of Sassari, ***University of Parma
1. Introduction. The demography of Ireland in the century after the Great Famine
of the 1840s is nothing if not extreme by comparison with other countries in Western Europe. Relentless population decline after the mid-century crisis, an increasingly late age at marriage, a reluctance to control fertility within marriage, a high incidence of non-marriage – all of these features mark the country off from the European mainstream. In the economically and demographically depressed decade of the 1950s, when emigration reached rates not witnessed since the 1880s, there was even a suggestion of ‘race suicide’ on the part of the Irish (O’Brien 1953). This selective and apocalyptic vision related primarily to the Catholic Irish and to rural Ireland in particular. Urban Ireland was of only marginal interest while industrial-ized Belfast lay beyond the pale, in a variety of senses.
Writing in the 1950s, a one-time governor of the Bank of Ireland, W.J. Louden Ryan (1955), noted a widespread belief that in matters demographic, as in much else, the Irish were considered ‘unique’. Nowadays, however, historians are much more likely to emphasise the outlier status of Ireland within the West European demographic system rather than any notion of uniqueness (Guinnane 1997, 7). How might one account for this outlying position? Attempts have been made to explain the peculiarities of the Irish case by reference to cultural as well as eco-nomic considerations. It has been argued, for instance, that decisions to delay mar-riage or not to marry at all were conditioned by repressive attitudes towards sexu-ality, propagated most powerfully through classrooms, pulpits and confessionals by the nuns, priests and religious brothers of the Catholic Church in Ireland (Connell 1968; Messenger 1969). Remarkably high levels of fertility within marriage, and a low incidence of illegitimate births, were similarly attributed to the pervasive influ-ence of the Catholic clergy (Gray 2000). But others have stressed the importance of
economic and social factors1. Industrialization progressed more slowly in Ireland
than in other parts of western Europe. At the turn of the twentieth century Ireland was still a predominantly agrarian society, and the economy offered Irish women few work opportunities outside the home. Moreover, it has been argued by Guinnane (1997, 269) that emigration reduced the need for farming couples to limit family size. The costs and benefits of children may have been different in rural Ireland as compared to other parts of Europe, and these differences may also help explain why the Irish lagged behind other Europeans in reducing marital fertility (Guinnane, Moehling, Ó Gráda 2001).
The missing element – the «elephant in the room» as it were – in traditional nar-ratives of Irish historical demography is urban Ireland. By contrast with rural Ireland, urban areas increased their share of population in the century and a half after 1850. Age at marriage was earlier than in Ireland generally and the incidence of celibacy was lower (Jones 1992). A high marital fertility notwithstanding, it is now clear that deliberate family limitation was being practised in some sections of Irish society by the early twentieth century. David et al. (1988) found that signifi-cant minorities of Irish women in urban areas were controlling their fertility by 1911. Even in some rural areas, as Ó Gráda and Duffy (1995) and Guinnane (1997) show, fertility varied by religion and by social class. More recently Fernihough (2011, 2) has argued that «there were two regions which exhibited a significant degree of purposeful fertility restriction – Belfast and Dublin city».
Belfast offers a particularly attractive site for the study of Irish urban demogra-phy. It was heavily industrialized, being Ireland’s only industrial city, and thus offers a local case study on the now voluminous literature on the interconnections of industry and demography (see, by way of introduction, Haines 1979; Katz, Stern 1981; Szreter 1996; Garrett et al. 2001). Three out of every four – males and females – enumerated in the Belfast workforce in 1911 were associated with industrial occu-pations. So, it may be that Belfast had much in common with industrial towns and cities in Britain and elsewhere, and rather less with its Irish rural hinterland. It would be surprising indeed if the social and industrial structure of the city did not have implications for fertility, gender ratios, inmigration and marriage patterns, as has been noted for study areas elsewhere in Europe and North America. Belfast also had a religious and ethnic diversity that was unusual for an Irish city, and this was also likely to carry demographic implications. While in many respects a Presbyterian-dominated city, Belfast also housed a large Anglican or Church of Ireland population and a substantial Roman Catholic minority. Put crudely, each traced its ethnic origins back to Scotland, England and Ireland respectively, with the seventeenth-century Plantation of Ulster as the fountainhead of so much sub-sequent change (Stewart 1989).
This article explores issues of marriage and fertility in the city of Belfast, bear-ing in mind differences in religion and social class, and forms part of a larger pro-ject by the authors on the determinants of marriage behaviour and marital fertility in Belfast at the end of the Edwardian era and before the outbreak of World War I. The structure of the article is as follows. In the first section the historical evolu-tion of Belfast, from early settlement to modern industrial city, is sketched. This is followed by a brief discussion of social conditions in the city, including wage levels, housing and literacy. The source materials and the methodology employed are then outlined. The later sections present new findings on the links between marriage, fertility, social class and religion.
2. Historical background. Belfast is a latecomer in the story of European
urbanisa-tion. Unlike many towns and cities, it does not have deep medieval roots. Its origins as an urban settlement only stretch back to the early 1600s and the Plantation of
Ulster by English and Scottish settlers (Bardon 1992). Situated strategically at the mouth of the river Lagan, the town enjoyed vigorous though hardly spectacular commercial growth during the course of the eighteenth century. Its vibrant civic culture earned it the title – half-serious, half-mocking – of the «Athens of the North». By 1800 it was a thriving market centre and port town, with a strong mer-chant community serving the agricultural and handicraft industries of its hinterland in east Ulster (Moody, Beckett 1954). Its population, in round figures, was about 20,000 (Maguire 1993, 38), far smaller than Dublin or Cork though this was soon to change.
A harbinger of times to come, the town already housed the beginnings of a fac-tory-based cotton spinning industry, though this was superseded within a few decades by mechanised linen manufacture. When the Halls visited the town at the beginning of the 1840s, they described it as «Ireland’s only manufacturing town». They continued: «It was something new to perceive rising above the houses numer-ous tall and thin chimneys which are indicative of industry, occupation, commerce and prosperity, with the volumes of smoke that issued from them giving unques-tionable tokens of full employment […]» (Hall 1984, 342).
During the course of the nineteenth century Belfast grew phenomenally, with its population multiplying more than fifteen fold (Fig. 1).
This was on the back of linen manufacturing, shipbuilding, and a range of engi-neering and other industries (Kennedy, Ollerenshaw 1985). Belfast is thus an out-standing example of the transformative power of modern industrialization: in a very
Fig. 1. Population Growth. Belfast 1808-1911
real sense it was a child of the British Industrial Revolution. Its progress bears com-parison with the growth of other industrial towns in the north of England and the west of Scotland. In some decades of the nineteenth century it was the fastest-grow-ing town in the United Kfastest-grow-ingdom. Within Ireland it was the undisputed industrial capital, beginning to challenge Dublin in terms of size, if not social and political prominence. Marking its transition from a provincial town to a modern Victorian city, it was accorded city status in 1888. By the eve of the First World War the city hosted a range of internationally-competitive firms in linen manufacture, ship-building and engineering. Some were amongst the leading firms in their sectors in the industrialized world. The port of Belfast was the nerve centre of a global set of connections, linking the city to sources of raw materials for its industry and final markets for its sophisticated products (Maguire 1993).
Contrary to popular impression, working class housing was both affordable and of good quality. Only a tiny proportion of families huddled together with another family. In most instances, this was a temporary economy measure, at an early stage in married life or as a result of a downturn in employment. The overcrowding to be found in the slum dwellings of Dublin, Leeds or Glasgow was largely unknown in
Belfast2, while the suburbs of Malone and Belmont catered for an expanding
mid-dle class. Houses were graded as first to fourth class in the Irish census reports, fourth class being the most undesirable. Four out of every five houses in Belfast were graded as second or third class, with most of these dwellings falling into the second class category. The strong supply of housing, relative to demand, which was the product of speculative building in the 1890s, meant a good range of rented accommodation and house rents that were among the lowest in the United Kingdom (Report of an Inquiry by the Board of Trade into Working Class Rents,
Housing, Retail Prices, and Standard Rate of Wages 1908).
One measure of extreme poverty, or destitution, was the number of people accommodated in the Belfast Union Workhouse. This was a grim institutional building located on the Lisburn Road, at some distance from the centre of the city. The number of inmates varied according to the season, the trade cycle, business conditions in the city, and the proportion of older people in the population. On the night of the 2nd April, 1911, there were 3,426 inmates in the Workhouse, a major-ity of them being men. This represents just under one per cent of the population, suggesting buoyant trading and employment conditions in the city, as well as care by family and kinfolk of the elderly and the frail in the community, a burden light-ened by the granting of Old Age Pensions to the over seventies in Lloyd George’s «People’s Budget» three years earlier (Ó Gráda 2002).
Belfast was a city of immigration, largely from the Ulster countryside, but not of immigration from distant parts. This conforms to a larger British pattern of inter-nal migration occurring over short distances. Thus, 78% of the inhabitants of the
city in 19113 were born either in Belfast or in other parts of counties Antrim and
Down, and a further eleven per cent came from the other Ulster counties4. The
dominance of Antrim and Down as sending regions also had implications for the religious profile of the city, as these were predominantly Protestant counties. A tiny
three per cent came from beyond Ulster but elsewhere in Ireland. Perhaps the real-ly striking figure is the seven per cent whose birthplace was across the sea in Britain, an inflow that included skilled workers for the shipbuilding and engineering indus-tries. Few of the city’s inhabitants were born outside of the United Kingdom, or less than one per cent in total5.
Unlike most of Ireland, where emigration was endemic, the outflow of people was small compared to the inflows. Emigration from county Antrim (including Belfast) totalled 3,628 in 1910. Three-fifths of these were male, a confirmation of the opportunities for work for women in Belfast.
The population of the city stood at 387,000 in 1911. What of the age structure of the population? While the city boasted six inhabitants aged 100 years or over, Belfast was a comparatively youthful city in 1911. More than half the population (52%) was aged less than 25 years.
The gender division was distinctive: more than half (53%) were women. In the younger, economically-active age group of 20-24 year olds, the imbalance was greater still, with women accounting for 56% of this age category. This female sur-plus had its basis in the opportunities for female employment in the city. The linen industry, the largest employer of labour, was dominated by women, though the supervisory and managerial roles were largely reserved for men (Messenger 1975; Cohen 1997; Topping 1992). In 1911 some 53,000 persons were employed in tex-tiles and clothing, most of these in the city’s linen mills and factories. In the poorer families married women, particularly those within walking distance of a spinning mill or weaving factory, combined work and child rearing so as to make ends meet. Three out of every four of these employees were female, thereby contributing to the gender imbalance in the city.
Dublin, the administrative and political capital of the island, was the only Irish city that was comparable in terms of population and wealth. But the economic bases and occupational structures of the two cities were quite different (Tab. 1). In terms of male employment, Dublin was far more dependent on professional and commercial occupations, whereas more than 70% of Belfast males were employed in industry. As regards female employment, the prevalence of low-paid domestic service in Dublin contrasts with the strikingly high proportion working in industry
Tab. 1. Occupational structure (%) in Belfast and Dublin in 1911
Belfast Dublin
Occupation Males Females Males Females
Professional 6.6 4.7 14.8 11.0
Agriculture 1.3 0.0 2.28 0.30
Commerce 18.1 4.7 22.1 5.0
Industry 72.5 75.8 57.9 45.5
Domestic Service 1.5 14.7 2.8 38.2
Source: Census of Ireland, 1911; British Parliamentary Papers, 1912-13; Province of Ulster: City of Belfast, vol. 116; Province of Leinster, 114.
in Belfast. Belfast was a city of work, indeed of long hours of work. Engineering and shipyard employees, for example, worked an average of 53 hours per week, not counting meal times or overtime (Report of an Enquiry by the Board of Trade into
the Earnings and Hours of Labour of Workpeople of the United Kingdom, 1911, 154,
176). For skilled workers, wage rates were high, amongst the highest in the United Kingdom (Lynch 1998). Nor were these high wages confined to a small section of the workforce. The proportion of skilled workers was relatively large. Gribbon (1982, 17) concludes it was more than a quarter of all male manual workers, which meant that the ‘labour aristocracy’ was more developed in Belfast than in most industrial towns (where the comparable proportion was much lower at ten to fif-teen per cent). In Belfast most craftsmen and mechanics were in high-technology industries such as shipbuilding and engineering, bringing home wages of around forty shillings per week (Board of Trade 1911). To place this in context, the rent of a five- or six-roomed terraced house, the kind of housing such households would have occupied, was five or six shillings per week, and so amounting to 15% or less of weekly earnings.
The position of unskilled workers was very different however. Housing costs were low, admittedly, with a modest kitchen house renting for three to four shillings per week. But a surplus of labour in the Irish countryside kept wages low, at well
under half the rate paid to skilled workers6. Some working class families were
oblig-ed to send their children out to work on the half-time system (half time spent in school and half time in the place of work, often a mill). It was only in 1901 that the legal starting age for work was raised from eight to twelve years (Messenger 1975, 30).
3. Religion, social class and ethno-religious segregation. Many commentators
have remarked on the Presbyterian character of Belfast, and this is borne out by the demographic facts as well as by architectural features of the city. The largest denom-inational grouping was Presbyterian, accounting for 34% of the population, close-ly followed by the Protestant Episcopalians, or members of the Church of Ireland, at 31%. The Roman Catholic share was lower at 24%. Significantly this had been falling during the second half of the nineteenth century (Tab. 2).
In 1861 its share had been as high as 34% but while the Roman Catholic pop-ulation had grown in absolute size in each successive decade, the proportion of Roman Catholics within the city’s population was in long-run decline. Whether this was due mainly to discrimination against Catholic job seekers or informal
recruit-Tab. 2. The changing religious composition of Belfast (1861-1911)
Catholic C of I Presbyterian Methodist Other
1861 33.9 24.6 35.2 4.1 2.2
1881 28.8 28.1 34.4 4.4 4.3
1911 24.1 30.5 33.7 6.2 5.5
Source: Census of Ireland, 1861, 1881, 1911. For the full references to Irish census reports, 1821-1911, see Vaughan and Fitzpatrick (1978, 355-357).
ment mechanisms that favoured ‘insiders’ and their kinfolk, or still other factors such as the greater proximity of Protestant areas to the city, is not clear. The fact that the absolute numbers of Catholics were rising indicates that there was no blan-ket discrimination on religious grounds. Outside of the big three churches, Methodists accounted for a further 6% of the population. In line with other Protestant nonconformist groups, the Methodists had grown in strength since 1861 (the first year in which a question on religion was included in the Irish census). This suggests some fragmentation of the Protestant denominational bloc during the course of rapid urbanisation and industrialization. The quest for low-church or more fundamentalist forms of religious devotion may in turn have been associated with the stresses and strains affecting the lives of the recently-recruited industrial proletariat.
Differences in migration patterns as between Catholics and Protestants under-lie the relative decline of the Catholic population in Belfast. A majority of migrants in the later nineteenth century came from the predominantly Protestant counties of Antrim and Down, whereas Catholics were more likely than Protestants to have been born in Belfast (Hempton 1995, 146). The so- called ‘ghetto Catholics’ were the most likely of all urban groups to be city-born, or to have migrated from the more distant Catholic counties in Ulster.
Literacy is one of the concomitants of economic and social development and also a measure of the human capital embodied in the population. On this count, Belfast scored well by comparison with other parts of Britain and Ireland. If the census report is taken at face value, then 96% of Belfast inhabitants, aged nine years or over in 1911, were literate. This is in the sense of possessing basic skills in read-ing and writread-ing. One of the limitations of this and other censuses, however, is that personal characteristics were self-reported. Signing up, as it were, for illiteracy was not an attractive proposition and no doubt gave rise to some social embarrassment. We know from examining the original census forms that a household head who claimed to be able to read and write on the census return – completed by another member of the family or perhaps more likely by the census enumerator (a member of the Royal Irish Constabulary) – was occasionally unable to sign the form. The ‘X’ signatures amounted to 4.1% of the households in our sample, which tallies well with the overall results for Belfast7.
There is some minor variation in literacy by geographical area, by social class, by gender and by religion. For instance, in west Belfast, almost five per cent of peo-ple were returned as illiterate, whereas in more affluent south Belfast the corre-sponding proportion was less than half this. In terms of social class, there was vir-tually no illiteracy reported for the 7,300 males in Class 1 – this census classification refers to the professional stratum in the social hierarchy – whereas among the 20,000 or so general and factory male labourers the reported level of illiteracy was as high as seven per cent. When illiteracy is viewed along gender lines, a small advantage in favour of men emerges: only 2.8% of men were illiterate as compared to 4.3% of women in the Belfast population.
could have demographic as well as labour market implications in relation to fertili-ty, child care and child mortality. Illiteracy also varied by religious persuasion, affecting seven per cent of Roman Catholics but less than two per cent of Methodists (to take as reference point the most literate of the major denomina-tions). Still, to use Akenson’s (1988, 8-14) felicitous phrase, while variations are apparent, we are dealing with ‘small differences’ in terms of levels of illiteracy with-in the population, be it broken down by area, social class, religion or gender. The fact remains that more than 90% of people in all social categories were literate, as reported to the census enumerators.
The language of home and work, of the public and private spheres, was of course English, as it had been in Belfast since its foundation in the seventeenth cen-tury. A tiny minority, a mere two per cent of the population, claimed an ability to speak Irish or Gaelic in 1911. According to the census of that year, some 7,591 peo-ple, divided roughly equally between males and females and most of them under the age of thirty, could speak the language.
The rewards of work and enterprise were unequally distributed. As in other industrial cities, society in Belfast was stratified along the lines of social class. In the words of Sybil Gribbon (1982, 13-14): «The hierarchy of class dominated Edwardian society. At its apex were the three hundred families, whose households at Strandtown or on the high ridges of the Antrim and Malone Roads contained a gardener and coachman as well as several indoor servants».
These were the captains of industry and commerce, including a handful of self-made millionaires, and a sprinkling of the landed gentry. Beneath these were the middle classes, a diverse category that included top surgeons and lawyers as well as lowly clerks and commercial travellers desperately clinging to the coat-tails of respectability. The skilled working class we have already encountered, involved in church and trade union, trading at the Belfast Co-operative Society, and propor-tionately larger than in many other industrial towns. At the broad base of the social pyramid, if one excludes vagrants and the destitute, were the masses of semi-skilled and unskilled labourers. Among women these included female spinners and weavers, living-in servants, washerwomen, charwomen, machinists and factory labourers. The male occupations included carters, porters, coal heavers, male ser-vants and over 20,000 general and factory labourers.
Tab. 3. Illiteracy (%) by gender and religion in Belfast in 1911
Denomination Male Female
Roman Catholic 5.4 8.6 C of I 2.8 4.1 Presbyterian 1.5 2.2 Methodist 1.1 1.7 Other 1.1 1.7 Total 2.8 4.3
Paradoxically, modern industrialization co-existed with pre-modern forms of social conflict, much of it imported from the countryside. Belfast was deeply divid-ed, not just along class lines but along lines of religion and nationality as well (Patterson 1980; Hepburn 1996). There had been instances of united working class action to demand higher wages, such as the Dockers’ Strike of 1907, and this spread quickly to other sections of the workforce (Gray 1985). But the more pervasive and enduring divisions were those revolving round religious and political identity. Simplifying, but only a little, Catholics and nationalists sought Home Rule or self-government for Ireland while Protestants and unionists saw their interests as bound up with the political union of Britain and Ireland. Sectarian, communal and nation-al conflict was the outcome of these contradictory politicnation-al aspirations.
Social and economic differences as between Catholic and Protestant exacerbat-ed but did not cause these divisions. The ownership of industrial capital was over-whelmingly in Protestant hands; Catholics were underrepresented relative to their share of the population in law and medicine but were overrepresented among
gen-eral and factory labourers8. We can get a summary view of social stratification by
religion for 1901 from the work of A.C. Hepburn (Tab. 4), where OD stands for
Other Denominations, that is, denominations other than Catholic.
Classes 1 and 2 refer to the high end of the income and wealth distribution: pro-fessionals, higher civil servants, successful entrepreneurs and business managers. Class 3 is at least as heterogeneous, and is comprised of lower white-collar occupa-tions and skilled (manual) workers. Class 4 refers to semi-skilled workers, many of whom were to be found in the shipyards and building trades. Class 5 was the most numerous and contained the teeming population of unskilled and casual labourers. Two points in the table are worth underlining: the Catholic population was disad-vantaged relative to the Protestant population of Belfast; it was not, however, dis-advantaged relative to British society as a whole. Thus, in Catholic-Protestant rela-tions a sense of relative deprivation was likely to be a divisive force in Belfast social life, notwithstanding the fact that in absolute terms most poor working-class peo-ple came from Protestant backgrounds.
Spatial segregation, perhaps inevitably, went hand in hand with the sharp com-munal divisions that revolved round religious identity and conflicting political aspi-rations. Boal (1982; 1984) measured segregation in 1911 by dividing the streets of
Tab. 4. Social class by religion (male household heads)
RC OD Britain Classes 1 and 2 13 13 15 Class 3 8 12 7 Class 4 31 35 33 Class 5 44 36 45 Not classified 4 4 0 Total 100 100 100 Source: Hepburn (1996, 64).
Belfast into three main categories: ‘Protestant streets’, with 0-9% Catholic, ‘Catholic streets’ with 91-100% Catholic, and ‘Mixed streets’, with 10-90% Catho-lic. The degree of segregation was acute. «If those streets that were 0%-9% Catholic (almost entirely Protestant streets) and those that were 91%-100% Catholic (almost entirely Catholic streets) are added together, then it will be seen that 59% of the total population was living in an almost entirely segregated city in 1911» (Boal 1984, 164). Similarly Hepburn (1996, 50) found extremely high levels
of segregation as measured by an index of dissimilarity9. Segregation varied
consid-erably from one district to another but it was also the case in some parts of the city, in north and west Belfast in particular, that wholly (or almost wholly) Protestant and Catholic streets abutted each other. One of the best known examples of segre-gation combined with contiguity is that of the Catholic Lower Falls and the neigh-bouring Protestant Shankill (Boal 1969). But examples of sharp communal inter-faces were to be found in many working-class parts of the city.
4. Sources and data set. The first completed census of the population of Ireland
was conducted in 1821. However, the vast majority of manuscript census returns for the nineteenth century were destroyed by war and neglect. Those for 1901 and 1911, however, have survived and have recently been digitised by the National
Archives of Ireland (NAI). The NAI data may be consulted at http://www.census.
nationalarchives.ie/search. In an earlier initiative focused on Belfast, a sample of some 40,000 individuals in Belfast in 1911, or just over one in ten of the population,
was compiled by one of the authors10. This is titled the BelFam dataset and is the
one on which many of the findings in this article are based. The dataset for 1911 was also supplemented by a smaller 1901 dataset for Belfast, in which individuals in the former were linked to their earlier selves as reported in the census returns of 1901.
The 1911 census was taken on April 2nd. A member of the Royal Irish Constabulary left a blank form with each household before the Sunday night of the census, with instructions that it be completed by the household head before the constable’s return on the Monday or Tuesday following. In cases where the head of household was illiterate, the constable was instructed to complete the form himself, writing down the household’s response to each question. In such instances, which were relatively few, the form was signed with an X by the householder. The maxi-mum fine for not cooperating with the taking of the census was £ 5, an appreciable sum in those days (Budd, Guinnane 1992). The coverage is generally regarded as comprehensive, in view of the diligence of the enumerators and the expertise of the administrative machine that oversaw the taking of the census. The content of the returns are generally believed to be reliable (Guinnane, Moehling, Ó Gráda 2001), though a few qualifications will be entered later.
The scope of the census questionnaire was extensive. In 1901 and 1911 it listed every member of the household, and for each: the Christian name, surname, age, sex, relationship to the head of household, religious profession, occupation, mari-tal status and county or country of birth, and finally whether or not deaf, dumb,
blind, imbecilic, an idiot or lunatic. The census also recorded an individual’s abili-ty to read and write and to speak the Irish language. This information was record-ed on Form A, the household return. In addition, form B1 gave information on the house: the number of windows, type of walls and roof, and the number of rooms occupied by each household. These different elements were given a score which were then aggregated to give a single, summary score. A score of seven points or less denoted poor quality housing, while a score of 12 points or more implied superior quality housing. Most houses were located between these two extremes. A third form, B2, gave information on out-offices and farm steadings attached to the house-hold. While more relevant to rural locations, it could furnish useful information in an urban context as well. The existence of a stable, for instance, often denoted a carriage-using, and hence high-income householder.
An innovative change to the 1911 census was the addition of a set of questions that makes it uniquely valuable for the study of fertility (Guinnane, Ó Gráda, Moehling 2001, 5). Each currently-married woman, whose husband was present on census night, was asked to indicate the number of completed years her present mar-riage had lasted, the number of children born alive to her, and the number of chil-dren who had died. The Census authorities calculated age at marriage, subtracting duration of marriage from the current age. The General Report of the Census of Ireland, published in the British Parliamentary Papers of 1912-1913, contains tables which show the number of children ever born and the number of children dead by
age at marriage and by duration of marriage11. Tables were published for single year
marital durations up to four years, then in five-year groups up to 30-34. The tables were published for the whole country, the six county boroughs and the cities of Dublin and Belfast. These tables have been used to model a ‘natural fertility’ regime in various studies (Glass, Grebenik 1954; Matras 1965; Coale, Hill, Trussell 1975; David, Sanderson 1988; 1990; David et al. 1988). Anderson (1998) has also drawn on these Irish materials in his comparative study of fertility decline in Scotland, Ireland, England and Wales.
As the individual manuscript returns give more detailed information than the tables in the published census, it is advantageous to use these returns in teasing out some key demographic relationships. This can be done much more sensitively using knowledge of individuals and households rather than the aggregated data found in the published census. The BelFam sample of Belfast households in 1911, used here, may now be described in a little more detail. As already indicated, it consists of some 40,000 individuals or just over ten per cent of those enumerated. While it is not, strictly speaking, a random sample, the major geographical areas within the city are represented, as are middle-class and working-class districts. Completed fertility is of particular interest to us, so a subset of this sample was constructed using the following steps. The original sample yielded about one thousand couples (1,016) in which both were present on census night and in which the wife was aged fifty years or over. The reason the sample was restricted to couples in which the wife was at least fifty years of age in 1911 was to arrive at completed fertility. The husbands were typically a few years older than their wives but in a minority of cases were less
than fifty years of age. We then searched for these married couples in 1901 and managed to track down most of the couples in 1901 as well. The subset amounted to almost nine hundred (894) married couples, notwithstanding that in many instances the couple had changed address between census dates. Changes of address, it is worth noting, raise some important issues. They are an indicator of res-idential mobility, which is an important feature of urban life. Methodologically speaking, the high levels of mobility apparent in Edwardian Belfast raise doubts about the relevance of housing and other social conditions in 1911 in seeking to explain earlier behaviours, including fertility behaviour and the incidence of infant and child mortality (Garrett, Reid, Strezer 2011, in this journal). Residential mobil-ity was certainly pronounced, and was aided by the strong supply of rented accom-modation from the end of the nineteenth century onwards. Our impression is that much of this mobility was short-distance, often to similar types of accommodation within the same street or a few streets away, so the use of single-census, cross-sec-tional data to explore longitudinal issues such as fertility may not be quite so prob-lematic as might at first appear. Moreover, the change of address was not typically associated with a change in occupational status. Still, there is no doubt that the issue merits further consideration.
A question mark also hangs over the accuracy of the ages of older men and women, as reported in the 1911 census (Budd, Guinnane 1992). A comparison of the age dis-tribution of the Irish population in 1901 and 1911 reveals an implausibly large increase in the number of individuals in their sixties and seventies. This increase is well known to be, in large part, a by-product of the Old Age Pensions Act, 1908. That Act had given rise to considerable welfare fraud as a result of claimants exaggerating their ages in order to claim benefits. As Budd and Guinnane (1992) point out, in the absence of civil registration before 1864, reliable evidence on age, particularly in the more remote and underdeveloped regions of Ireland, was not easily available. Conceivably the pres-ence of large numbers of Gaelic speakers in the West of Ireland added a further layer of complication to a census undertaking that was conducted exclusively through the medium of English. They found that the extent of deliberate mis-reporting was posi-tively correlated with rurality and low income. Moreover, Guinnane, Moehling, Ó Gráda (2001) have pointed out that Dublin and Belfast were not immune to age-mis-reporting, though on a more modest scale.
We have explored the extent of inconsistency in the reporting of ages by indi-viduals, using the BelFam dataset for 1911 and making nominative linkages back to 1901 (Kennedy, Pozzi, Manfredini in press). The sample consists of matched cou-ples, compared at two census moments in time, and is made up of 872 husbands and 887 wives. Belfast Catholics emerge as being much more likely than Protestants
to show inconsistent ages as between the two census dates12. Where there was a
dis-crepancy, it tended to be in the direction of overstating age in 1911 as compared to 1901. In a smaller number of cases, it is true, individuals apparently ‘aged’ by less than ten years. The mean difference between Catholic males and Protestant males in terms of age discrepancy, and using absolute values, turned out to be 3.13 years as compared to 1.68 years.
Methodist males seem to have been the most accurate, or at least the most con-sistent, in reporting ages. Turning to gender differences, the discrepancies were more pronounced amongst women. Again Catholics were the least consistent and Methodists the most consistent in reporting ages to the census takers, with Anglicans and Presbyterians located in between. Put another way, we find that of those who added on more than ten years between 1901 and 1911, those most like-ly to do so were Catholics. Arguablike-ly, because the economic status of Catholics was lower than that of Protestants, the gains from deliberate age mis-reporting would have been higher. Furthermore, women were more likely than men to undergo accelerated ageing, stereotypes about women and ageing notwithstanding.
Of course some of these individual discrepancies may be put down to illiteracy: illiterates were likely to produce less accurate ages and durations of marriage, while the better-educated were less likely to do so. This is borne out by the very limited misreporting of age found in the most affluent area in our sample, the Windsor ward in south Belfast.
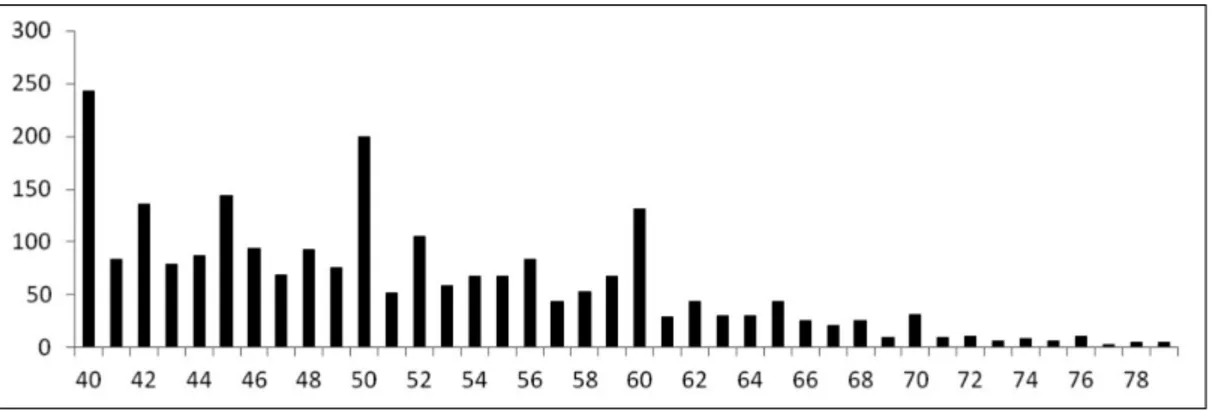
We have assumed that the ages reported in 1901 are the more accurate of the two, given the incentive for older people to exaggerate their ages after the imple-mentation of the Old Age Pensions Act. We cannot of course discount the possi-bility, indeed the certainty, that some of the ages reported in 1901 were not accu-rate either. Furthermore, age heaping was more pronounced in 1901 as compared to 1911, particularly for women (Figs. 2-5), thereby reducing the precision of ages
reported in the former census13. Still, on balance, we are inclined to believe that the
1901 census is the more reliable of the two.
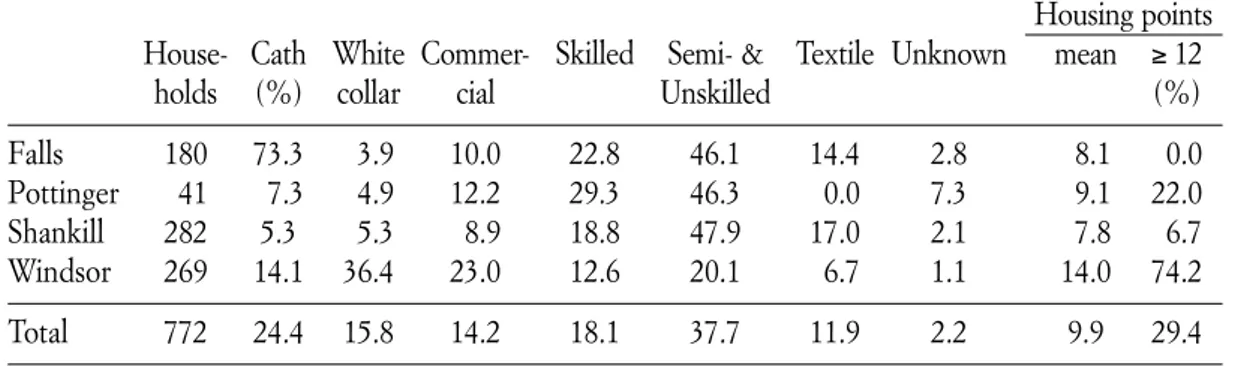
Checks on the linkage exercise results in the elimination of some individual cases. Thus all the women whose ‘corrected’ age in 1911 turned out to be less than 50 years were dropped from the subsample. The final subsample includes 772 households living in four different areas of the city: a) the Shankill, a largely Protestant working class area in the west and north of the city; b) the Falls, a large-ly Catholic working class area in west Belfast; c) Pottinger, a working class ward in east Belfast, with fair numbers of skilled engineering workers (d) Windsor a mid-dle-class and mainly Protestant area in south Belfast. In the Falls we have stretched
Tab. 5. Catholic and Protestant streets
Percentage of Catholic streets Percentage of Protestant street
Catholics N % Protestants N % 100 29 34.5 100 23 16.1 90-99 23 27.4 90-99 63 44.1 80-89 15 17.9 80-89 33 23.1 70-79 5 6.0 70-79 15 10.5 60-69 9 10.7 60-69 7 4.9 50-59 3 3.6 50-59 2 1.4 Total 84 100.0 143 100.0
Fig. 3. Ages of men (in the age range 40-79 years) in 1911: Belfast sample (2890 individuals)
Fig. 4. Ages of women (in the age range 40-79 years) in 1901: Belfast sample le (3359 individuals) Fig. 2. Ages of men (in the age range 40-79 years) in 1901: Belfast sample (2386 individuals)
Fig. 5. Ages of women (in the age range 40-79 years) in 1911: Belfast sample (4185 individuals) 600 500 400 300 200 100 0
the boundaries to include a few households resident in the nearby Smithfield ward. Similarly for Shankill a small number of households from St George’s ward were included, while Windsor also includes a small number from the neighbouring Cromac district. The streets included in our subsample number two hundred and twenty seven, and, in general, these were characterised by high levels of segregation (Tab. 5), with the index of dissimilarity registering a high 84%.
The socio-economic and housing conditions present in our subsample (Tab. 6) reflect a well-known pattern. The largely Catholic and working-class Falls ward had a very low proportion of professional people as compared to Protestant middle-class Windsor. It also held a high proportion of semi-skilled and unskilled workers, though the working-class Shankill was at least as disadvantaged. The quality of hous-ing enjoyed by middle-class households, who were mainly Protestant, was also superi-or. In short, on a range of social indicators, including literacy, skill level and earnings, Protestants were advantaged relative to Catholics. But the gap in living standards between the middle classes, mainly Protestant, and the working classes, Protestant as well as Catholic, was wider still. Thus structural inequality ran along two axes, that of social class and that of religion.
Tab. 6. Socio-economic status and housing conditions
Housing points House- Cath White Commer- Skilled Semi- & Textile Unknown mean ≥ 12
holds (%) collar cial Unskilled (%)
Falls 180 73.3 3.9 10.0 22.8 46.1 14.4 2.8 8.1 0.0
Pottinger 41 7.3 4.9 12.2 29.3 46.3 0.0 7.3 9.1 22.0
Shankill 282 5.3 5.3 8.9 18.8 47.9 17.0 2.1 7.8 6.7
Windsor 269 14.1 36.4 23.0 12.6 20.1 6.7 1.1 14.0 74.2
Total 772 24.4 15.8 14.2 18.1 37.7 11.9 2.2 9.9 29.4
Source: BelFam dataset (see text).
5. Marriage and fertility. A number of writers have commented on the apparent
similarities in demographic behaviour as between the Catholic and Protestant pop-ulations of Belfast. Mean household size was much the same in 1901. The age of male household heads, on average, was broadly similar; as were the proportions of households with children, co-residing relatives and lodgers (Hepburn 1996). The real contrast was with rural Ireland. In the country as a whole in 1911 some 29% of men and 25% of women in the age group 45-54 years were unmarried and were
unlikely ever to marry14. In Belfast, however, only 13% of males remained
unmar-ried in this older age range, which is less than half the celibacy rate for Ireland as a whole. The prospects for women in the marriage stakes were less good, though, with one in five (21%) unmarried in the 45-54 age category. To some extent, of course, spinsterhood may have been by choice. The urban economy furnished eco-nomic niches that could sustain women living independently, much more so than
rural Ireland where there was a deficit of women relative to men. Single or widowed women with some financial resources could take in boarders or engage in retailing, while working class women might find employment in the mills (literally as spin-sters), in factories and warehouses, and in domestic service.
So much for marriage and non-marriage. Fertility might be a different matter, both as between Belfast and the rest of Ireland and as between Catholics and Protestants. A frequently noted feature of life in later twentieth-century Northern Irish society has been the contrast between Catholic and Protestant fertility (Ó Gráda 1995). Among the leading studies of differential fertility we may note: Park 1962-63; Robinson 1967; Day 1968; Kennedy 1973a; 1973b; Walsh 1970; Compton 1976; Coward 1980. There are various measures of fertility, from summary mea-sures to the more refined age-specific fertility rates. But were there visible differ-ences a half century or more earlier in time? The historical origins of this divergence – one replete with political as well as social and demographic significance – are not well understood. Fertility might be related to social class as well as religion, and within social classes to particular occupations. The evidence from some industrial-ized regions of Europe is that fertility was influenced by occupational structure and the possibilities of female employment (Garrett 1990; Szreter 1996). Thus women in English textile towns had relatively low fertility while, for example, women in rural coal-mining communities had relatively high fertility (Haines 1977). At first sight the economic rationale underpinning such differences in behaviour seems straightforward enough, though Garrett (1990, 148) counsels that the relationship between «a couple’s employment histories and their family building can be […] an extremely complex one». Moreover, could religious belief and practices trump eco-nomic and ecoeco-nomically-related considerations? The Belfast region was the great
textile centre of Ireland in the early 20thcentury, hosting the largest linen industry
in the world. Its labour force was predominantly female, with some 80% of the workers in the industry being women. Belfast was also a city renowned for its reli-gious loyalties, not to say zealotry, and its commitment to Christian marriage and family life was widely trumpeted. But, on the face of it, there may have been a con-flict between material considerations and religious conceptions of the optimal fam-ily size.
Table 7 provides information on marital fertility in our subsample, and com-pares this to corresponding data found in Anderson (1998) for ‘urban Ireland’, ‘rural Ireland’, England and Wales, and Scotland (Urban Ireland was taken to be the sum of the six county boroughs of Dublin, Belfast, Cork, Derry, Limerick, and Waterford; in a very rough approximation, the remainder of the country was taken to represent rural Ireland).
The dominant impression conveyed by Table 7 is the remarkably high fertility of Irish couples, even in urban areas. According to the BelFam dataset, two-thirds of the brides who married in the age band 20-24 years (the most popular ages at marriage), produced six or more live births. By contrast, the corresponding figure for England and Wales was only one in two. Put another way, the number of large families produced by this marriage cohort was a third higher as compared to
En-gland and Wales. In the case of rural Ireland, the proportion of couples producing six or more children was a whopping 76%. This was procreative power with a vengeance, and helps explain why Ireland has sometimes been seen as playing little or no part in the European demographic transition.
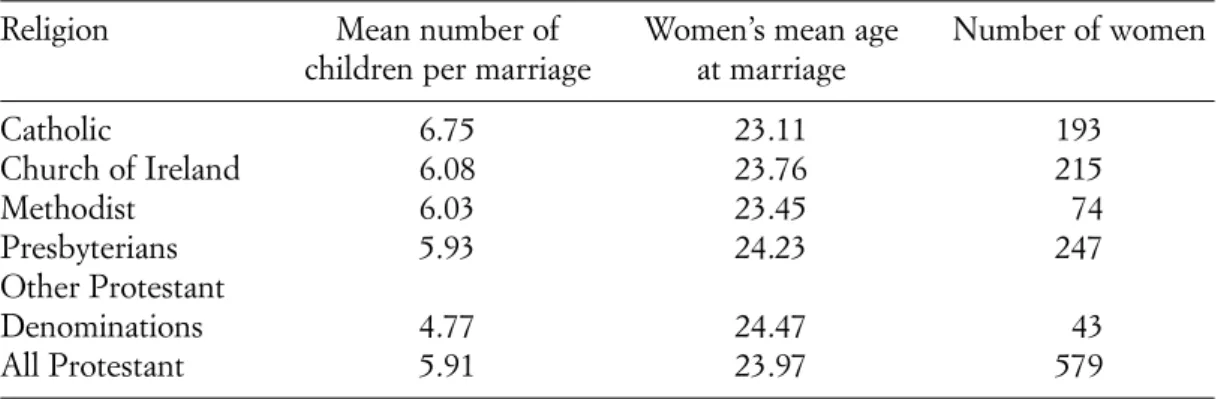
Focusing on Belfast in more detail, we see in Table 8 that Catholic procreative power exceeded that of each of the major Protestant denominations, a point also inferred by Park (1962; 1962-1963) from published census data. The higher fertili-ty of Catholic women must be linked, in part, to their younger age at marriage, but
Tab. 7. Family size according to age at marriage (five-year intervals) Age at marriage 15-19
BelFam Urban Ireland Rural Ireland England Wales Scotland
Mean 8.19 7.98 8.52 7.41 8.12 Var Coef 0.44 0.47 0.43 0.51 0.45 % 2 children 8.4 10.3 7.6 11.5 8.3 % 6 children 75.9 76.5 80.2 67.1 76.1 Marriages 166 Age at marriage 20-24
BelFam Urban Ireland Rural Ireland England Wales Scotland
Mean 6.89 6.91 7.69 5.83 6.69 Var Coef 0.48 0.51 0.45 0.59 0.50 % 2 children 11.6 12.5 9.5 18.7 12.0 % 6 children 68.3 66.4 76.2 50.9 64.2 Marriages 303 Age at marriage 25-29
BelFam Urban Ireland Rural Ireland England Wales Scotland
Mean 4.94 5.19 6.46 4.23 5.04 Var Coef 0.59 0.61 0.48 0.68 0.57 % 2 children 21.4 21.6 11.7 30.5 20.4 % 6 children 42.2 48.4 66 31.4 44.5 Marriages 206 Age at marriage 30-34
BelFam Urban Ireland Rural Ireland England Wales Scotland
Mean 3.16 3.69 4.96 3.02 3.58
Var Coef 0.80 0.73 0.58 0.80 0.71
% 2 children 43.9 37.4 20.4 45.9 35.0
% 6 children 13.4 26.2 43.3 14.9 20.4
Marriages 67
Note: Anderson uses marriage durations of 25-29 years, which approximates completed fertility. Source: BelFam dataset; Anderson (1998, 16).
the differences in the marriage age between the religious denominations are not suf-ficient to explain the corresponding variations in the total number of children ever born. Park (1962, 19) measured the statistical relationship existing between age at marriage and completed family size in Belfast in 1911 and found that «every increase of five years in the age of wife at marriage up to the age of 50 resulted in an average of 1.24 children less per marriage for those mothers whose fertility was considered completed, that is, for marriages of duration 30-34 years». The differ-ence in the age at marriage was not sufficient to explain the differdiffer-ence in family size by religious affiliation, though obviously it played a role.
It does not follow that the remaining differences in marital fertility between Catholics and Protestants were necessarily due to differences in religious belief or reli-gious culture, and of course the earlier age at marriage itself needs to be explained. Park (1962-63, 7) has suggested that the higher fertility of Catholics could be due to their lower social and economic status. This is lent support by the findings in Table 9, though the limited number of marriages in some of the socio-economic groups
sug-gests that some caution is in order15. For this reason semi-skilled workers have been
Tab. 8. Mean number of children per marriage and women’s mean age at marriage according to
religious affiliation
Religion Mean number of Women’s mean age Number of women children per marriage at marriage
Catholic 6.75 23.11 193 Church of Ireland 6.08 23.76 215 Methodist 6.03 23.45 74 Presbyterians 5.93 24.23 247 Other Protestant Denominations 4.77 24.47 43 All Protestant 5.91 23.97 579
Source: BelFam dataset.
Tab. 9. Mean number of children per marriage and women’s mean age at marriage according to
socio economic status of the head of the household
Social status Women Mean number of Woman’s mean age
children per marriage at marriage
White collar 122 4.52 25.43
Commercial 110 5.41 24.75
Skilled 140 6.46 23.04
Semi- & Unskilled 291 6.64 23.02
Textile 92 6.92 23.70
Unknown 17 6.53 24.18
Total sample 772 6.13 23.76
amalgamated with unskilled workers. Nonetheless, the lower fertility of white-collar employees comes through clearly, while the category of semi-skilled and unskilled workers has considerably larger completed family sizes.
Fertility varied also by geographic area in Belfast, though not to the same extent as is evident in relation to socio-economic status. The surprise finding in Table 10 is that the Shankill area, a predominantly Protestant working-class district, had the highest fertility of the four districts. Whether this was due to environmental factors resulting in high child mortality, or other factors, is worth investigating further. Predictably, middle-class Windsor emerges as a low-fertility zone.
Returning to the issue of fertility and religious affiliation, Table 11 reports the findings of some standard regression analysis. The point here is to control for other explanatory variables that might also influence fertility. In the first, and simplest version of the model, fertility is related to membership of different Protestant denominations. A negative coefficient suggests that a Protestant affiliation implied lower fertility within marriage as compared to Catholics. So the finding in this sim-ple model is that Presbyterians had, on average, almost one child (0.8) fewer per family than Catholics (the reference group). Where a finding is statistically signifi-cant at the 95% confidence level, the coefficient is placed in bold. The coefficients for members of the Anglican or Church of Ireland community and the Methodist church are also negative but not statistically significant at the 95% confidence level.
This simple variant of the model does not control for other influences that might be shaping fertility. We next introduce age at marriage for women into the equation, the expectation being that the longer the duration of the fertile period the greater the risk of pregnancy. In this variant of the model it is noticeable that the coeffi-cients for religion sink into statistical insignificance, though the negative signs remain for all three Protestant affiliations. As expected, age at marriage is negative-ly related to fertility.
A further possibility is that fertility is related to wealth. We do not have any monetary measures of wealth so we have to make do with a proxy measure. In a rough and ready fashion, the quality of housing should give some indication of rel-ative wealth positions. The census authorities allocated housing points to each
Tab. 10. Mean number of children per marriage and women’s mean age at marriage in
differ-ent districts of Belfast
Districts Women Mean number Mean age at
of children marriage Falls 180 6.47 22.98 Pottinger 41 5.85 23.51 Shankill 282 7.06 22.90 Windsor 269 4.97 25.20 Total sample 772 6.13 23.76
Source: BelFam dataset. (As indicated in the text, Falls includes some households from the Smithfield ward, Shankill includes some households from Saint George’s, and Windsor includes some from Cromac ward).
house, on the basis of the number of rooms, the building materials used and other physical properties. A score of less than seven housing points indicates poor hous-ing conditions, and that is the reference category used here. A score of seven to eleven points suggests an intermediate level of housing, while twelve points or more implies a very substantial habitation and hence a well-off householder. Somewhat surprisingly, none of the coefficients for the housing variable turn out to be statisti-cally significant, nor for the religious variables for that matter. The signs of the coef-ficients are generally negative, however, which offers faint hints at a negative rela-tionship between Protestant religious affiliation and fertility, and also between wealth and fertility.
Tab.11. Explaining variations in fertility by reference to religious affiliation and other variables Model 1 Model 2 Model 3 Model 4 Model 5 Variables Freq. Rel.risk Rel.risk Rel.risk Rel.risk Rel.risk
Religion F (ref. Catholic) 25.0
Church of Ireland 27.8 -0.662 -0.442 -0.261 -0.335 -0.884
Methodist 9.6 -0.719 -0.605 -0.323 -0.291 -0.907
Presbyterian 32.1 -0.795 -0.415 -0.156 -0.178 -0.877
Other Protestant denominations 5.6 -1.979 -1.516 -1.353 -1.363 -2.076
Woman’s age at marriage 23.7 -0.342 -0.330 -0.323 -0.317
Housing Points (ref. < 7 pts) 17.8
7-11 pts 52.3 0.439 0.491 0.506
12+ pts 29.4 -0.561 0.027 0.489
Unknown 0.5 -1.894 -1.733 -1.145
Social status (ref. unskilled &
semi-skilled manual workers) 37.8 Professional, Clerical, Higher
White-Collar 15.8 -1.007 -0.990
Proprietors, Commercial,
Farmers, etc. 14.2 -0.430 -0.400
Skilled Manual Workers 18.1 -0.132 -0.109
Textile Workers 11.9 0.544 0.428
Unknown 2.2 0.035 0.126
Women’s education skills (ref.
not able to read or write) 84.7
Read & Write 15.3 0.553 0.377
Ward (ref. Falls) 23.3
Pottinger 5.3 0.176 Shankill 34.8 1.233 Windsor 36.6 0.200 Constant 6.746 14.662 14.137 13.896 13.592 Observations 772 772 772 772 772 Log-likelihood -2080.5 -1980.4 -1972.8 -1963.1 -1955.7
LR test – chi square 200.2 15.2 15.3 14.8
LR test – p-value 0.000 0.002 0.018 0.002
The fourth version of the model introduces social status and women’s literacy into the explanation. The signs of the coefficients are as expected for both higher and lower white-collar occupations, and for skilled workers, though only the coef-ficient for the first of these, the professional grouping, is statistically significant. The category of textile workers is discussed separately below. Only ‘Other Protestant denominations’ is shown to have a statistically significant and negative relationship with fertility.
The final version of the model, in addition to the variables discussed so far, adds geography to the brew of possible influences on family size, using the ward as the spatial unit. The wards, as explained earlier, were the Falls and Shankill in west Belfast, which were both heavily working class areas; Pottinger in east Belfast, which was to some extent associated with higher paid skilled workers in engineer-ing and shipbuildengineer-ing; and Windsor in south Belfast which was a largely middle-class ward. There is no evidence of a direct geographical effect, with the exception of the Shankill ward – and the positive coefficient is hard to explain for such a largely Protestant area – though it may well be that the spatial units are too large and
amor-phous to carry much explanatory weight16. We do not, therefore, rule out
neigh-bourhood effects, believing this should be explored using more refined geosocial units. But the striking finding is that the coefficients of all four categories of Protestant affiliation now appear as statistically significant. Whether this finding will hold under different specifications of the model must await further exploration by the authors and others.
The fourth and fifth specifications of the model included male textile workers as a separate category but no statistically significant relationship emerged. We sur-mised earlier that family size among textile workers might have been smaller because of the opportunity cost of child care. This, however, is a very weak test. Women rather than men are the important gender in this context (though where the husband was employed in textiles this might suggest the likelihood that his wife had been employed in textiles at one time or other). A limitation of the census data on occupations, however, is that wives are returned almost invariably as housewives, though some may have been outworkers. More importantly, though, the informa-tion we really need is a past history of work in the textile industry on the part of
these older women17. A snap-shot view of older couples at a moment in time – 2
April 1911 – is less than revealing, given that decisions about participation in the labour force or not, and decisions about more children or not, would have been taken many years earlier. Economic circumstances, including family earnings and spells of unemployment, may also have changed over time. As things stand, we can draw no firm conclusions. On economic and financial grounds, there is some rea-son to expect a negative relationship between female involvement in the textile industry and fertility. But it might be profitable also to speculate as to why this might not be the case. Possibly alternative child-care arrangements, through kinfolk and tightly-knit neighbourhoods, were more readily available in Belfast than in industrial cities elsewhere, for example. Varying levels of infant mortality may also have mattered. Or it could mean simply that married couples, where the woman
was or had been involved in textile manufacture, were indifferent to, culturally averse to, or ignorant of the possible trade-offs between earnings and additional children. For the present it is best to remain agnostic on this intriguing cluster of possibilities.
6. Concluding discussion. Belfast occupies a unique position within Irish economy
and society, principally because of its status as the lone industrial outpost of any scale on the island of Ireland. There were other industrial towns in Ulster but none was remotely comparable to Belfast in terms of size and range of industries. We can get a sense of this by comparing Belfast with Derry, the second most important industrial centre in the north of Ireland. Derry had grown fourfold between 1821 and 1911 but the already larger town of Belfast grew tenfold in the same period (Vaughan, Fitzpatrick 1978, 36, 38). In 1911 Belfast had ten times as many indus-trial workers as Derry (calculated from the Census of Ireland, 1911). This is testa-ment to the extent to which Belfast dominated the industrial landscape of Ulster and Ireland in the early twentieth century.
Consistent with this commanding position it attracted short-distance migrants to the city, and hence its youthful population, its low levels of emigration, and a gen-der ratio biased towards women. Those migrating inwards were mainly Protestant, from nearby parishes in counties Antrim and Down. These found niches within an already religiously segregated town. By virtue of its high-technology industries, which were geared towards exacting export markets, the city housed a substantial ‘labour aristocracy’, with up to a quarter of male workers in 1911 classified as skilled workers. To pursue the demographic characteristics of Belfast in more detail it was necessary to turn to the single most revealing set of sources on Belfast soci-ety during the Edwardian period, that is, the manuscript returns of the censuses of population for 1901 and 1911. These are generally believed to be reliable across a range of categories of information, from birthplace and religion to occupation and marital status, and this indeed appears to be the case. However, we can be less san-guine about the ages reported in 1911, which in turn are vital to the study of issues such as fertility, mortality, age at marriage, age differences between spouses, and the age structure of the population in 1911. One of the principal findings of this article is that age misreporting at the time of the 1911 census was serious for older people, particularly so when one seeks to compute measures such as the mean age at mar-riage of men and women, either for the population as a whole or broken down by religious affiliation. The misreporting of ages seems to have been most acute in the Catholic community, and particularly amongst women. We have, therefore, cor-rected the age information reported in 1911 by reference to the ages recorded against the same individuals in 1901, when the distorting effect of the introduction of the Old Age Pensions’ Act of 1908 was not in force.
Having corrected the age information, it is apparent that Belfast does not fit neatly an Irish template of demographic behaviour. The frequency of marriage was higher and age at marriage was appreciably lower than in Ireland generally. Broadly speaking, these variables conform to English and Scottish patterns, though the high
incidence of non-marriage among women in Belfast is worth highlighting, being somewhere between Irish and British levels.
The fertility of married couples in Belfast deserves closer examination than is possible here. Fertility was generally high, though somewhat lower than in Ireland generally and considerably lower than in rural Ireland (Daly 2006, 94). So some couples in Ireland, particularly in places like Belfast, had adopted fertility control by the early twentieth century. Fertility varied by age at marriage, something that might be expected. But did it vary by religious affiliation as well? Our study of Belfast suggests that it did. Not only that, the fertility differential, according to our sample, does not disappear after controlling for socio-economic status. This con-trasts with Ó Gráda’s (2008) work on marital fertility in the Ulster textile town of Lurgan in 1911, which is located only twenty miles to the southwest of Belfast. A link between religious affiliation and fertility was found for Lurgan but once dif-ferences in economic status were taken into account the effect was barely dis-cernible. The same was also the case for a sample drawn from rural Ulster (Ó Gráda 1985). But for Belfast Fernihough (2011, 13) found «no strong pattern emerges across religious groups in Belfast», which is at variance with our preliminary find-ings on fertility variations.
Further work is clearly necessary to resolve these differences in relation to urban Ireland, using larger samples, more refined measures of socio-economic status, and age-specific fertility measures. It may be noted that the various studies are not strictly comparable as they refer either to different locations, or different marriage durations, or even different marriage cohorts. Some such as Ó Gráda and Duffy (1995), for example, focused on marital fertility at shorter marriage durations and for younger women, whereas we have concentrated instead on married women who had completed their entire fecund life span. The later years of marriage, as Ó Gráda and Duffy (1995, 427) acknowledge, may be the years in which fertility differences between Catholics and others were more likely to occur. Our provisional conclu-sion, even allowing for socio-economic differences, is that Protestant couples in Belfast had smaller completed family sizes, as compared to Catholics. This in turn suggests that the Great Fertility Divergence, as we might term it, between Protestant and Catholic families – so evident in Northern Ireland in the late twen-tieth century – had its origins a century earlier.
1 Having first reviewed with impish delight some of the more bizarre expressions of Catholic clerical puritanism, Connell (1968) gave priority to the economic imperatives shap-ing individual and household behaviour. 2In all there were only 288 one-roomed tene-ments in the city occupied by two or more
per-sons, out of a housing stock of 75,172 inhabited dwellings. A quarter of the one-roomed tene-ments were clustered in one ward (out of fif-teen), which was the Dock ward.
3Census of Ireland, 1911. Province of Ulster: City
(or County Borough) of Belfast, BPP(1912). All references to the demographic and related
structures of Belfast in 1911, unless otherwise stated, are based on calculations from this source.
4The proportion of people with birth places in counties Antrim and Down (including Belfast), who were resident in the city on census night, was typically three in every four during the peri-od 1851-1911. But this understates the extent of movement as many of these inhabitants had made short-distance migrations from the other towns, villages and rural areas of counties Antrim and Down to the city. Belfast, it should be explained, was largely located in County Antrim but the city expanded across the river Lagan into County Down during the course of industrialization. Unfortunately the census report only gives birthplaces for the gross enti-ties of County Antrim and County Down, whereas ideally one would like more geographi-cally detailed points of departure. Among the other Ulster counties, the largest source of migrants was County Armagh, followed by County Tyrone. It is clear that Belfast fits the kinds of generalisations found in the literature: internal migrations usually involve short- rather than long-distance movements of people. 5This tiny stream of newcomers included 424 Russians, Jewish economic migrants and some refugees it may be surmised. These were fol-lowed in descending order of importance for European immigrants by 151 Germans and 149 Italians. America supplied 867 foreign-born res-idents, most of whom were from the United States and a majority of whom may be assumed to have been of Irish extraction. This becomes clear from an inspection of the more detailed census enumerators’ returns.
6The earnings of male general labourers in the linen industry, for instance, averaged about sev-enteen shillings per week in 1906. Female spin-ners took home ten to eleven shillings per week.
Report of an Enquiry by the Board of Trade into the Earnings and Hours of Labour of Workpeople of the United Kingdom, BPP, 80 (1909, 49). The Report acknowledged (page 49 also): «In Ireland the wages of labourers are noticeably low».
7Our sample is described later and consists of information taken from the original manuscript forms filled in by households at or close to cen-sus night, 2ndApril 1911. The originals are held at the National Archives, Ireland, Bishop Street, Dublin.
8The Catholic share of the population of Belfast was 24% in 1911. Catholics accounted for 18%
of positions in the legal profession and only 15% of those in medicine. However, they made up 32% of the general labouring class where wages were amongst the lowest and earnings intermittent (These figures relate to male occu-pations only but the overall picture is little dif-ferent).
9 The Dissimilarity Index will produce «the maximum figure of 100 for a city when no unit (in this case the street) contained any mixing of the two communities under analysis and a min-imum of 0 where every street reflected the over-all city-wide proportion of one community to the other» (Hepburn, 1996, 49).
10The dataset was compiled by Liam Kennedy. For further details see http://www.belfastfami-lyhistory.com.
11The Irish tables were published for single year marital durations up to four years, then in five-year groups up to 30-34.
12Guinnane, Moehling Ó Gráda (2001, 6) con-fined their data set to women aged less than fifty in 1911 and they have compared the declared ages in 1901 and in 1911 in a subsample of Pembroke (Dublin) of over 600 individuals (more than 300 men and women) and found an average increase of 10.12 years for males over the decade and 9.96 for females. As the authors report (page 7): «The data revealed little sign of systematic differences by religion, class or age: in all cross-tabulations the average distortion was merely a few months in either direction». 13Budd and Guinnnane (1992, 497) have shown for other parts of Ireland that ages in 1901 were subject to more age heaping than in 1911and our data confirm this pattern for Belfast. 14 Calculated from Vaughan and Fitzpatrick 1978, p. 90.
15 We are grateful to Eilidh Garrett and Alice Reid who coded the great variety of occupations into socio-economic groups.
16 The small numbers of Catholics in the Shankill ward in our sample may be a distorting factor.
17 Even then, there are potential problems. Garrett et al., warns of the possibility of selec-tion bias: «As they aged, the majority of women who continued to accumulate children would have moved into the home […] while those fail-ing to add to the number of their survivfail-ing off-spring would have been more likely to remain out at work, resulting in a concentration of women with low effective fertility among the older age groups reporting an occupation». See Garrett et al. 2001, 307.