e-ISSN 2070-5948, DOI 10.1285/i20705948v4n1p23
© 2008 Università del Salento – http://siba-ese.unile.it/index.php/ejasa/index
EXPLORING THE FACETS OF OVERALL JOB SATISFACTION
THROUGH A NOVEL ENSEMBLE LEARNING
Marika Vezzoli
*Department of Quantitative Methods, University of Brescia, Italy.
Received 24 February 2010; Accepted 01 September 2010 Available online 26 April 2011
Abstract: The aim of this work is to understand the relationship between the
overall Job Satisfaction and the facet Job Satisfaction, using a comprehensive dataset of Italian Social Cooperatives workers. On this issue, recent works explored how ensemble learning like Random Forest and TreeBoost can be used to assess the importance of potential predictors in the Job Satisfaction. Taking a similar way, in this study we use a tailored data mining approach for hierarchical data, namely a new algorithm called CRAGGING, shedding some light about the drivers of Job Satisfaction. To this end we use a variable importance measure and then we grow a synthetic model to relate the overall Job Satisfaction with corresponding facets. In doing this we obtain a simple model with unambiguous results.
Keywords: CRAGGING, Ensemble Learning, Final Model, Hierarchical Data,
Job Satisfaction, Variable Importance
1.
Introduction
Most researchers look at the Job Satisfaction (JS henceforth) as a global concept which comprises multiple facets. For this reason we distinguish between overall and facet JS where: a) the first measures the global feeling of the workers about their job with a single item, b) the second is constructed using a multi-item questionnaire asking to the workers how they evaluate specific facets of their job. From a technical perspective a clear understanding of the JS is not a trivial question. Indeed, some claim that, due to severe lack of information, by using a single item to measure complex psychological constructs is generally discouraged ([33]). On the other hand, other studies seem to prove that using a single item of the overall JS is better than a
based measure obtained by summing specific job facet satisfactions ([22]; [25]; [24]). The key question is how to reconcile both views, in order to find the relationship between overall and facet JS.
On this issue, existing literature have explored different approaches. Some authors use linear models by regressing the overall JS against the facet JS ([17]; [15]; [3]; [32]; [23]), while others ([1]; [19]; [2], [11]) suggest the use of nonlinear models. Recently, Carpita and Zuccolotto ([10]) proposed two ensemble learning algorithm, namely Random Forests ([5]) and TreeBoost ([21]), together with their variable importance measures. In doing so, they identify those items having a major impact on the overall JS.
In this paper, the issue of the JS is explored relative to the Social Cooperatives, which are an intriguing case study to investigate, since their natural mission is to meet social targets. Hence, an unambiguous understanding of the JS is essential to get a picture of all the main features of the job taken into account by the workers. In these terms, dissecting the overall JS making clear the role played by each facet is particularly important for the Social Cooperatives, and this explains the reason why we empirically focused on this kind of firm.
To do this, we apply a recent ensemble learning algorithm, called CRAGGING (namely CRoss-validation AGGregatING), introduced in [27], [28] and realized with the end to handle with panel and/or hierarchical data, which is the case of the Social Cooperatives1. Following [34], the CRAGGING and its variable importance (VI henceforth) measures are applied to real data coming from the survey on the Italian Social Cooperatives called ICSI2007 ([9]) in order to study the importance of the single drivers of the JS with respect to the global measure of JS. In detail, each decision tree grown through the algorithm uses the overall JS as dependent variable and the facets of JS as predictors. Through the CRAGGING we try to select the most important drivers and to measure their importance relative to the JS. On this point, recent studies ([29]; [30]; [31]) have introduced two measures of VI when using the CRAGGING. These are the Mean Decrease in Accuracy (M1 henceforth), by modifying the permutation of the r-th variable (Xr) in order to respect the particular data structure, and the Total Decrease in Node Impurity (M2 henceforth). In this study we focus on the M2 measure since it provides results which are coherent with the synthetic model used for inspecting the relationship between the overall and facet JS.
The paper is organized as follows. In Section 2 we introduce the methodology. In Section 3 we describe the dataset and we discuss the empirical results. Section 4 concludes.
2.
Methodology
Tree-based methods are nonparametric tools for modelling the relationships between the response variable and a set of predictors. The algorithm partitions the covariate space into a set of rectangles containing observations that are as homogenous as possible with respect to the response variable. The partition is based on a splitting criterion which allows to select at each tree node the best covariate and the cut-off point along it ([8]).
The main advantage of the trees is their ability in handling with different types of variables (numerical or categorical), as well as with missing values. In addition, its representation is a
1 In particular, the Social Cooperatives exhibit a hierarchical structure with cooperatives and workers as first and
popular tool in many scientific areas since the interpretability of the partition is direct and unambiguous.
On the other hand, one of the major concern is their instability. In other terms, the learners are overly responsive to the training data, producing models that can change dramatically with small changes in the data and undermining the learners‟ ability to produce knowledge ([12]).
An approach that mitigates this problem and increases the accuracy of the predictors consists of developing a population of simple models (like trees), called base or weak learner, within the perturbed training set and combining them to form a composite predictor. These „multiple models‟, called ensemble learning, include Bagging ([4]), Boosting ([20]), Random Forest ([5]) and CRAGGING ([27]; [28]). The last is designed in a way to reconcile accuracy and stability of a prediction system, maintaining the structure of the data. With the objective to improve the accuracy of the model, the idea is to repeatedly rotate the training set in such an extend to, first, generate multiple predictors and, second, combine them obtaining a univariate and stable tree. Let (Y, X) be a dataset with N observations, where Y is the response variable and X is the matrix of the R predictors. The observations are divided in J groups according to a categorical variable F, each one composed by nj observations and
J j nj N
1 . Let us denote by L={1,2,…,J} the set
of groups and by xji=(x1ji,x2ji,…,xrji,…,xRji) the vector of predictors for the i-th subject of group j where jL and i=1,2,…,nj. The set L is randomly partitioned in V subsets2 denoted by Lv with v=1,…,V, each one containing Jv groups. Let Lcv be the complementary set of Lv, containing
c v J
groups, and L the set where the l-th group is removed by cv\l c v
L (lLcv).
Within the tree-based framework, the cost complexity parameter ≥ 0 is the tuning parameter of the cross-validation and it governs the trade-off between tree size and its goodness to fit the data. When is small, the penalty for having a large number of terminal nodes is small and the resulting tree is large. On the contrary, when increases the nested subtrees have fewer terminal nodes ([8]). Hence, for a fixed , for each L and for each cv
c v L l let
c l v f \ L , ˆ ,be the prediction function of a regression tree trained on data
j c l v i n j ji L , , ji , \ ,
y x 1 and pruned with
. The corresponding prediction in the test set is:
L , , , , . ˆ ˆ \ L , , l ji v j ji f j i n y c l v 2 1 and with x (1)At each step, one group is removed from the training set and a tree is grown on it. Since the perturbation causes significant changes in the Jvc trees (this is due to the instability of the procedure), the following criterion is used to improve the accuracy of the predictions
v j l ji c v ji f j i n J y c v c l v L , , , , ˆ ˆ L ,L , \ 2 1 and with 1
x (2)which is the average of the functions (1) (the ensemble learning or multiple models). Hence the fitted functions (1) are linearly combined so that the ˆyji, will act as a good predictor for future y|x in the test set.
The CRAGGING combines two types of cross-validation (cv henceforth): the first, called leave-one-unit-out cv ([27]), is used to perturb the training set removing one group per time. This procedure reduces the correlation between any pair of trees in the ensemble, reflecting on a lower variance of (2). The second is the usual v-fold cv on the V sets, which is used to find the cost-complexity parameter that minimizes the estimates of the prediction error. Indeed, the entire procedure is repeated for different values of and the algorithm chooses the optimal tuning parameter * as,
yji yji
j i nj L ,ˆ with and 1,..., argmin * , L where L(.) is a generic loss function. Hence, the CRAGGING predictions are computed as,
j ji ji y j i n y ˆ L, ,..., ~ , * with 1 crag . 2.1 Final Model
Ensemble learning algorithms are excellent predictors but their main concern is the lack of interpretability. Unfortunately, when making predictions, accuracy and simplicity (interpretability) are in conflict ([13]; [14]). A solution could be to assign the simplest representation to the most accurate model. In [7], starting from the results of bagging or arcing multiple trees, the authors proved that by manufacturing the data and representing the multiple trees, one can get a single tree which is more robust and accurate than the original one. They referred to this representation as Born Again Trees, which is more accurate since it is a representer of the more stable bagged or arced tree predictors. As discussed above, if the training set changes slightly, the decision tree may change substantially, but not the combined tree predictor. The increased stability of the combined tree predictor is passed on to its representer. Other authors studied methods for extracting a simpler and more comprehensible model from an overly complex one ([16]; [18]).
In [27] and [28] the authors combined the results of CRAGGING with a single tree, developing a procedure in two steps.
First, the predictions computed in every test set Lv in correspondence of the optimal cost-complexity parameter *, are staked to obtain a vector with dimension N1, called Y . ˆ* Second, the dependent variable Y is replaced by this vector of estimates out of sample, and a single regression tree with cost complexity parameter * is grown on
Yˆ*,x .As a result we obtain a Final Model (FM henceforth), namely a predictor which interpretability is rated as A+ ([6]), with the advantage that its accuracy is better than the accuracy obtained from a single tree.
2.2 CRAGGING VI measures
Vezzoli and Zuccolotto ([29]; [30]; [31]) introduced the M1 and M2 measures when the CRAGGING is used. Here we are interested in giving some details contained in those papers. Briefly, M1 works in this way: at each tree of CRAGGING in correspondence of *, all the values of the r-th variable are randomly permuted and new predictions are obtained with this new dataset (Y, X)r. Hence, a new loss L*,r is computed and it is compared with
) ˆ , ( , * * L yji yji
L . The procedure is repeated k times. The M1 measure for the r-th variable is given by the following average on k:
M1r=avk(L*,r - L*).
In particular, the authors modified the randomization of the values of Xr. Coherently with the idea of perturbing the training set without destroying the structure of the data, the values of Xr are randomized conditional on the J groups of the database. For each variable Xr a permutation p={p1,…,pj,…,pJ} of the sequence {1,…,j,…,J} is randomly selected. The values of Xr are replaced in the dataset according to the following rule:
j j rp ,...,n , i j rji ,12 s x x L ,where s(.) denotes a sampling with replacement from a set of values and
j p j j rpi i n rp x 1,..., x . This
type of randomization is particularly recommended if f(Xr|j1) ≠ f(Xr|j2) with j1 ≠ j2, which is often
the case for the CRAGGING, and j1, j2L.
Let us consider now the M2 measure. At each tree of CRAGGING the heterogeneity reductions due to the variable r over the set of non-terminal nodes are summed up and the importance of the variable Xr is computed by averaging the results over all the trees of the ensemble. In detail, let drg be the decrease in the heterogeneity index allowed by Xr at node g of the t-th tree3. The VI of Xr for the t-th tree is
) ( ) ( M2 t G g rg rg r t d I (3)where G(t) is the set of non-terminal nodes of t-th tree and Irg is the indicator function which is equal to 1 if the r-th variable is used to split at node g and 0 otherwise. In the case of an ensemble learning like CRAGGING, the (3) can be generalized by its average over all the trees grown by the algorithm. Namely:
T t r r t T 1 ) ( M 2 1 M 2 ,where T is the number of the base learners used in the ensemble.
3 The X
3.
Case study: CRAGGING on ICSI
2007data
The data used in this study come from the Survey on the Italian Social Cooperatives carried out in 2007 (ICSI2007) ([9]). The 320 Social Cooperatives distributed around the country were sampled from the Census 2003 database4 and 4,134 paid workers answered to the questionnaire. The present study has developed two different analyses: the first involves all the interviewees (case 1) while the second focused on 2,802 workers employed in 284 cooperatives5 that often or always have relationship with end users and their family (case 2).
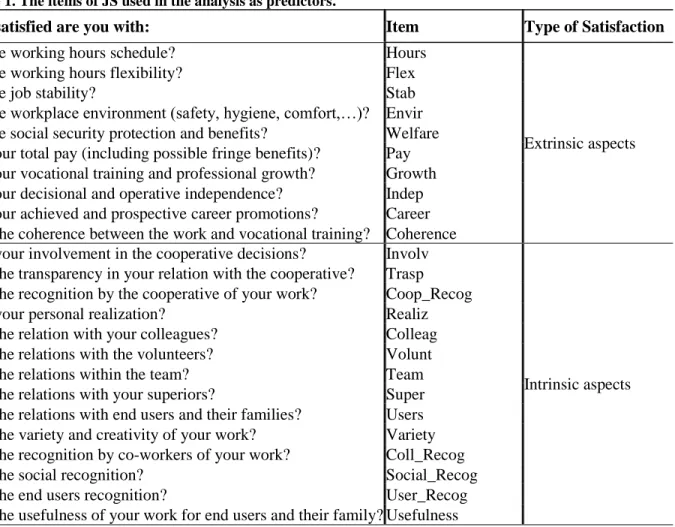
Table 1. The items of JS used in the analysis as predictors.
How satisfied are you with: Item Type of Satisfaction
D1. the working hours schedule? Hours
Extrinsic aspects
D2. the working hours flexibility? Flex
D3. the job stability? Stab
D4. the workplace environment (safety, hygiene, comfort,…)? Envir
D5. the social security protection and benefits? Welfare
D6. your total pay (including possible fringe benefits)? Pay
D7. your vocational training and professional growth? Growth
D8. your decisional and operative independence? Indep
D9. your achieved and prospective career promotions? Career
D10. the coherence between the work and vocational training? Coherence
D11. your involvement in the cooperative decisions? Involv
Intrinsic aspects
D12. the transparency in your relation with the cooperative? Trasp
D13. the recognition by the cooperative of your work? Coop_Recog
D14. your personal realization? Realiz
D15. the relation with your colleagues? Colleag
D16. the relations with the volunteers? Volunt
D17. the relations within the team? Team
D18. the relations with your superiors? Super
D19. the relations with end users and their families? Users
D20. the variety and creativity of your work? Variety
D21. the recognition by co-workers of your work? Coll_Recog
D22. the social recognition? Social_Recog
D23. the end users recognition? User_Recog
D24. the usefulness of your work for end users and their family? Usefulness
For case 1, the set of groups L={1,2,…,320} was randomly partitioned in V= 5 subsets (L1, L2,…,
L5) each one containing 64 cooperatives6. Analogously, for case 2 the set of groups
L={1,2,…,284} was randomly partitioned in V=5 subsets (L1, L2,…, L5) where one of them
4 The Census 2003 counts 5,093 operative social cooperatives with 153,284 paid workers. 5
For computational reasons we deleted those cooperatives that have only one interviewee.
6 It is evident that c
1
contains 60 cooperatives and the remaining ones 56 cooperatives. In detail, we grew 1280 trees7 for case 1 and 1136 trees for case 2.
As discussed in Section 1, each decision tree of the CRAGGING uses the overall JS as dependent variable and the 24 items, divided between extrinsic (e.g., pay or career advancement) and intrinsic (e.g., social usefulness of the work or recognition of one‟s work) aspects of the facet JS as predictors (see Table 1). For each work aspects, respondents were asked to indicate how satisfied they were with it, assigning a score from 1, very dissatisfied, to 7, highly satisfied and central score 4, neither dissatisfied nor satisfied. Also the overall JS, which is a proxy of the global satisfaction of the workers relative to their job, is measured through a Likert scale ranging from 1 (very dissatisfied) to 7 (highly satisfied). In the following, the overall JS is used as an interval scaled variable.
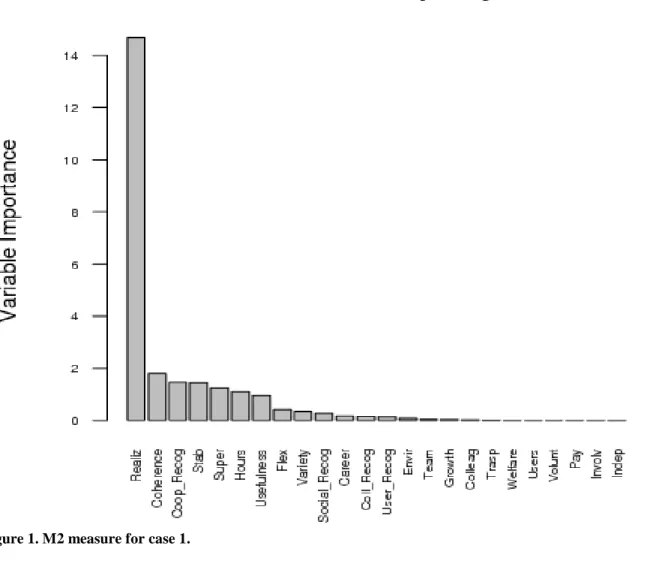
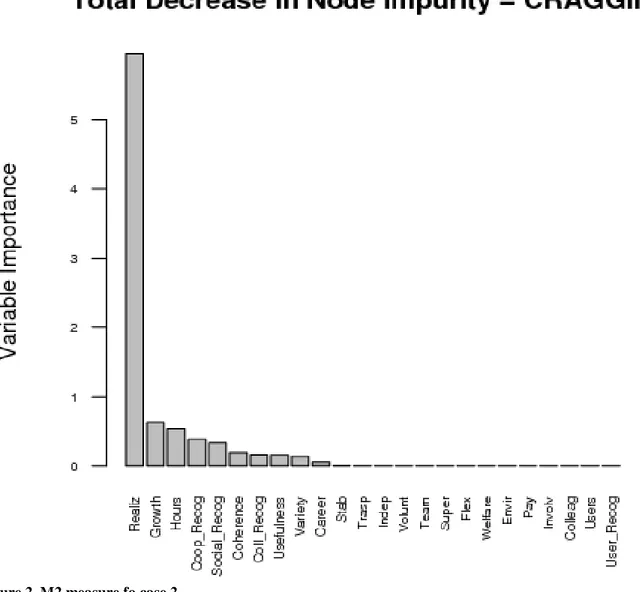
In Figure 1 (for case 1) and 2 (for case 2) we report the ranking given by M2 in the two analyses.
Figure 1. M2 measure for case 1.
7
The number of trees grown from CRAGGING depends on the number of groups Jvc (e.g., in case 1 there are 256 groups) and the number of sets used in the cross-validation (in both the analyses V=5).
Figure 2. M2 measure fo case 2.
As in [34], the personal realization (Realiz), which is an intrinsic aspect of the work, appears as the most important driver in both analyses, capturing much of the importance relative to remaining drivers as we observe in Figures 1 and 2. This is an interesting finding which proves how Social Cooperatives differ from pure profit-oriented firms where extrinsic features usually play a key role8, as documented by Sloane and Williams‟ ([26]). Indeed, these authors found that between salary and JS there is a strong and highly significant positive correlation, then attributing a primary role toward extrinsic features. Conversely, in our analysis the salary has no importance (the corresponding score is equal to zero), suggesting that the unsatisfied workers for their salary are notwithstanding satisfied relative to their job. Although the remaining features are of minor importance, note some extrinsic aspects such as the coherence between the work and the vocational training (Coherence), the job stability (Stab), the working hours schedule
8 Note, however, that this point should not be viewed in negative terms, that is to say that workers belonging to
profit-oriented firms assign no importance to the personal realization. But, merely, that extrinsic features are in general more important.
(Hours) and the working hours flexibility (Flex), which appear of some interest. In particular, by considering the gender of interviewees (about the 75% are women) we can conjecture that female workers give more importance to the job stability together with a sort of “work autonomy”, in terms of more possibilities to manage their time.
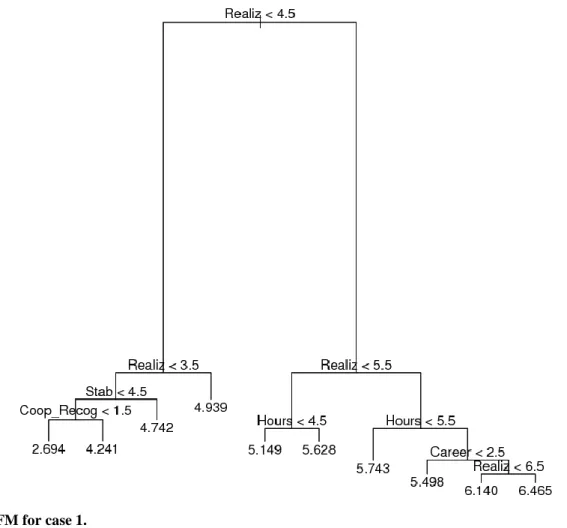
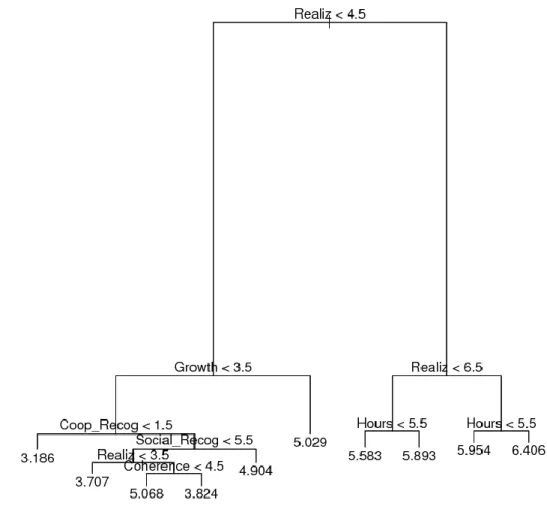
The FM, reported in Figure 3 (for case 1) and 4 (for case 2), confirms that only few items are involved in the model, namely 5 and 6 out 24 items for case 19 and 210, respectively. In Figure 3 we observe that unsatisfied workers relative to their personal realization, stability of their job and recognition of the cooperative (they assign low scores to these items) are grouped in the left side of the tree showing low mean score of overall JS. On the other hand, personal realization together with working hours schedule and career are clustered in the right side of the tree, attributing higher values for the average score of overall JS. The same results hold for case 2 (Figure 4) although people having a relationship with end users and their family assign low scores to overall JS when unsatisfied relative to: (i) the professional growth, (ii) the social recognition, and (iii) the coherence between the work and the professional training.
Figure 3. FM for case 1.
9 Personal realization (Realiz), job stability (Stab), cooperative recognition (Coop_recog), working hours schedule
(Hours) and career (Career).
10 Personal realization (Realiz), professional growth (Growth), cooperative recognition (Coop_recog), social
recognition (Social_Recog), coherence between the work and vocational training (Coherence) and working hours schedule (Hours).
Figure 4. FM for case 2.
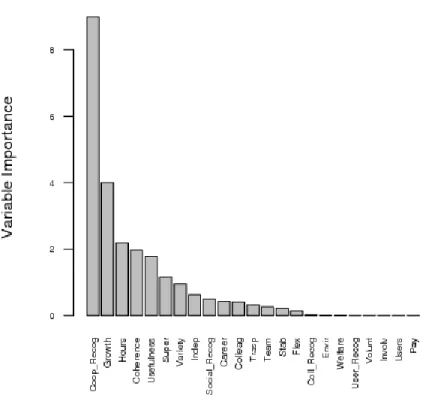
Since the personal realization strongly impacts on the overall JS, a sensitivity analysis was carried out by running the algorithm excluding such item. In case 1 and 2 (reported in Figure 5 and 6), we observe that the most important driver is the recognition by the cooperative (Coop_Recog), which is an intrinsic feature. Differently from Figure 1 and 2, other measures seem to have a relative importance like the professional growth (Growth), the vocational training (Coherence), the working hours schedule (Hours), the usefulness of the work for end users and their family (Usefulness) which are both intrinsic and extrinsic features.
Figure 5. M2 measure for case 1 excluding the personal realization.
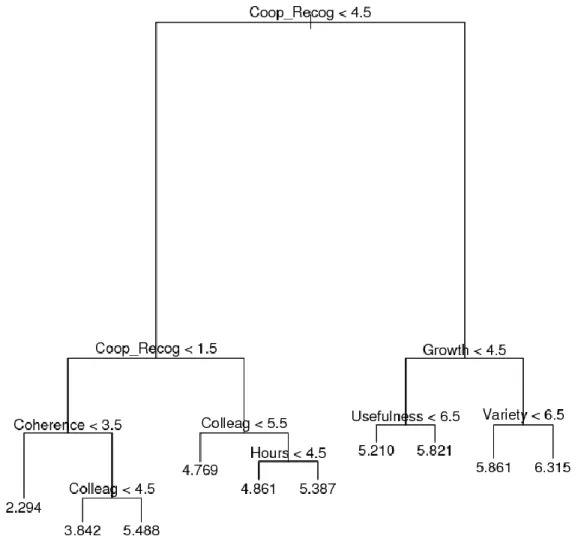
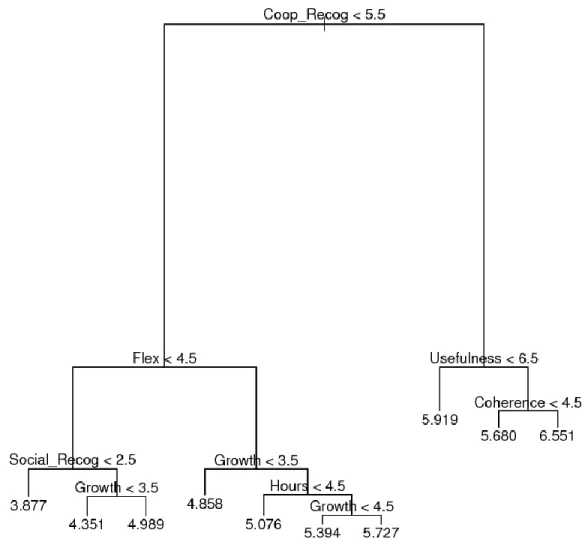
Also in this analysis we grow the FM for both the cases. In Figure 7 we report the tree structure for case 1 in which we note that the recognition by the cooperative discriminates between high (Coop_Recog > 4.5) and low (Coop_Recog ≤ 4.5) satisfaction. Workers who assign high scores to this item together with high professional growth and variety of their job have the highest mean score of overall JS. On the other hand, the lower mean score is associated with unsatisfied people with respect to the recognition by the cooperative and the coherence between their work and vocational training. Between these two extreme we have different mean score of overall JS almost all coherently placed in the tree. The exceptions are nodes 3 and 6 which show relatively high mean score of overall JS although they are in the left side of the tree. This is due to the role played by coherence and working hours schedule, respectively. This finding confirms what previously observed, more precisely that interviewees are satisfied when their job is coherent with their vocational training and when they can autonomously organize their work. Figure 8 depicts the FM for case 2 showing that workers who are in harness with end users and their family appear as satisfied with high recognition by the cooperatives, the utility and coherence of their job. Instead, low JS mean scores are related to low satisfaction with respect to the recognition of the cooperative, the flexibility of their job and the social recognition.
Figure 8. FM for case 2 excluding the personal realization.
4.
Conclusions
In this paper we analyzed the impact of the items of the facet satisfaction upon the overall JS using a recent algorithm (CRAGGING) conceived with the end to deal with hierarchical data structure. Using data from the survey on the Italian Social Cooperatives, the empirical analysis shows that by using our new algorithm we obtain a ranking variable which is quite similar to that realized by the TreeBoost. The use of a synthetic model, as the FM proposed in this study, makes clear the connection between the overall and the facet JS in a simple and immediate way, by clustering the workers in few groups each one characterized by the mean score of the overall JS. In a sense, the projections of the FM can also be viewed as a “de-noisy” measure of the overall JS obtained through a non-parametric statistical procedure. As a result, the FM expectations could be used as an alternative proxy for the overall JS to better inspect past data as well as to make more accurate predictions. But we reserve this issue to our future research.
Acknowledgement
I wish to thank Paola Zuccolotto, for many stimulating discussions and her encouragement for the project; Maurizio Carpita, for his suggestions and helpful comments. I acknowledge the contributions of participants at the IES2009 Conference. I also thank two anonymous referees for their comments that greatly improved the quality of the paper.
References
[1]. Aldag, R.J., Brief, A.P. (1978). Examination of alternative models of job satisfaction. Human Relations, 31, 1, 91-98.
[2]. Allen, R.I., Lambert, E.G., Pasupuleti, S., Cluse-Tolar, T., Ventura, L.A. (2004). The impact of the job characteristics on social and human service workers. Social Work & Society, 2, 2, 173-188.
[3]. Blood, M.R. (1971). The validity of importance. Journal of Applied Psychology, 55, 487-488.
[4]. Breiman, L. (1996). Bagging predictors. Machine Learning, 26, 123-140. [5]. Breiman, L. (2001a). Random Forests. Machine Learning, 45, 5-32.
[6]. Breiman, L. (2001b). Statistical modelling: the two cultures. Statistical Science, 16, 3, 199-231.
[7]. Breiman, L., Shang, N. (1997). Born again trees. Technical report, Statistics Department, University of California Berkeley, Berkeley, CA.
[8]. Breiman, L., Friedman, J.H., Olshen, R.A. Stone, C.J. (1984). Classification and Regression Trees. Monterey. CA: Wadsworth and Brooks/Cole.
[9]. Carpita, M. (Ed.) (2009). La qualità del lavoro nelle cooperative sociali. Misure e modelli statistici. Milano: FrancoAngeli.
[10]. Carpita, M., Zuccolotto, P. (2007). Mining the drivers of job satisfaction using algorithmic variable importance measures. In Metodi, Modelli, e Tecnologie dell’Informazione a Supporto delle Decisioni, Vol. I: Metodologie, eds. L. D‟Ambra, P. Rostirolla and M. Squillante. Milano: FrancoAngeli, 63-70.
[11]. Ciavolino, E. (2011). An information theoretic job satisfaction analysis. Journal of Applied Sciences, 11, 4, 686-692.
[12]. Dietterich, T.G. (1996). Editorial. Machine Learning, 24, 91-93.
[13]. Domingos, P. (1998). Occam‟s two razors: the sharp and the blunt. In Proceedings of the Fourth International Conference on Knowledge Discovery and Data Mining, eds. R. Agrawal and P. Stolorz. Menlo Park, CA: AAAI Press, 37-43.
[14]. Domingos, P. (1999). The role of Occam‟s razor in knowledge discovery. Data Mining and Knowledge Discovery, 3, 409-425.
[15]. Evans, M.G. (1969). Conceptual and operational problems in the measurements of various aspects of job satisfaction. Journal of Applied Psychology, 53, 93-101.
[16]. Evans, B., Fisher, D. (1994). Overcoming process delays with decision tree induction. IEEE Expert, 9, 60-66.
[17]. Ewen, R.B. (1967). Weighting components of job satisfaction. Journal of Applied Psychology, 51, 68-73.
[18]. Fayyad, U.M., Djorgovski, S.G., Weir, N. (1996). Automating the analysis and cataloging of sky surveys. In Advances in Knowledge Discovery and Data Mining, eds. U.M. Fayyad, G. Piatetsky-Shapiro, P. Smyth, and R. Uthurusamy. Menlo Park, CA: AAAI Press, 471-493.
[19]. Ferratt, T.W. (1981). Overall job satisfaction: it is a linear function of facet satisfaction?. Human Relations, 34, 6, 463-473.
[20]. Freund, Y., Schapire, R.E. (1996). Experiments with a new boosting algorithm. In Machine Learning: Proceedings of the Thirteenth International Conference. San Francisco: Morgan Kaufman, 148-156.
[21]. Friedman, J.H. (2001). Greedy function approximation: a gradient boosting machine. The Annals of Statistics, 29, 5, 1189-1232.
[22]. Kunin, T. (1955). The construction of a new type of attitude measure. Personnel Psychology, 8, 65-78.
[23]. Quinn, R.P., Mangione, T.W. (1973). Evaluated weighted models of measuring job satisfaction: a Cinderella story. Organizational Behaviour and Human Performance, 10, 1-23.
[24]. Sackett, P.R., Larson, J.R. Jr. (1990). Research strategies and tactics in industrial and organizational psychology. In Handbook of industrial and organizational psychology, 2nd edition, Vol. 1, eds. M.D. Dunnette and L.M. Hough. Palo Alto, CA: Consulting Psychologist Press, 419-489.
[25]. Scarpello, V., Campbell, J.P. (1983). Job satisfaction: are all the parts there?. Personnel Psychology, 36, 577-600.
[26]. Sloane, P.J., Williams, H. (2000). Job satisfaction, comparison earnings and gender. Labour, 14, 473-501.
[27]. Vezzoli, M. (2007). Recent advances in classification and regression trees. University of Milano Bicocca: unpublished PHD thesis.
[28]. Vezzoli, M., Stone, C.J. (2007). CRAGGING. In Book of Short Papers CLADAG 2007, EUM, sixth scientific meeting of the Classification and Data Analysis Group (CLADAG) of the Italian Statistical Society, University of Macerata, September 12-14 2007, 363-366. [29]. Vezzoli, M., Zuccolotto, P. (2009). CRAGGING Variable Importance measurement in
sovereign default prediction. Working paper series, Department of Quantitative Methods, University of Brescia, n. 323.
[30]. Vezzoli, M., Zuccolotto, P. (2009). Variable importance measurement within hierarchical data. In Book of Short Papers CLADAG 2009, CLEUP, seventh scientific meeting of the Classification and Data Analysis Group (CLADAG) of the Italian Statistical Society, University of Catania, September 09-11 2009, 645-648.
[31]. Vezzoli, M., Zuccolotto, P. (2010). CRAGGING measures of variable importance for data with hierarchical structure. In New Perspectives in Statistical Modelling and Data Analysis, eds. S. Ingrassia, R. Rocci and M. Vichi. Springer, forthcoming.
[32]. Wanous, J.P., Lawler, E.E. III (1972). Measurement and meaning of job satisfaction. Journal of Applied Psychology, 56, 95-105.
[33]. Wanous, J.P., Reichers, A.E., Hudy, M.J. (1997). Overall job satisfaction: how good are single-item measures?. Journal of Applied Psychology, 82, 2, 247-252.
[34]. Zuccolotto, P. (2009). La soddisfazione e l‟impegno dei lavoratori delle cooperative sociali. In La qualità del lavoro nelle cooperative sociali. Misure e modelli statistici, eds. M. Carpita. Milano: Franco Angeli, 75-94.