DOTTORATO DI RICERCA IN
BIOINGEGNERIA
Ciclo XXVI
Settore Concorsuale di afferenza: 09/G2
Settore Scientifico disciplinare: ING-INF/06
TITOLO TESI
TECNICHE E METODI PER UN'ANALISI MULTI-SCALA DEL
FENOMENO DELLA FATICA MUSCOLARE
Presentata da:
ANNA MARGHERITA CASTRONOVO
Coordinatore Dottorato
Relatore
Prof.ssa ELISA MAGOSSO
Prof. TOMMASO D'ALESSIO
_______________________
____________________________
One equal temper of heroic hearts,
Made weak by time and fate, but strong in will
To strive, to seek, to find, and not to yield.
1
T
ABLE OF
C
ONTENTS
Index of Figures ... 4
Index of Equations ... 9
INTRODUCTION ... 11
CHAPTER 1: What is fatigue? ... 18
Definitions of Fatigue ... 18
Central and Peripheral Fatigue ... 21
Central Fatigue ... 22
Peripheral Fatigue ... 25
CHAPTER 2: The multi-level approach to better understand mechanisms of muscular fatigue ... 31
Biochemical level ... 32
The structure of the skeletal muscle cells ... 33
Classification of muscle fibers and motor units... 36
Mechanisms of muscle contraction ... 37
Metabolic processes underlying muscle fatigue ... 41
Electrophysiological level ... 42
2
CHAPTER 3: Neuromuscular Adaptations during Submaximal Prolonged Cycling ... 47
Introduction ... 48
Materials and Methods ... 50
Results ... 54
Discussion and Conclusions ... 56
CHAPTER 4: Bi-dimensional analysis of parameters from sEMG recordings during exhausting isometric contractions under different biomechanical demands ... 59
Introduction ... 59
Materials and Methods ... 62
Results ... 67
Discussion ... 71
Conclusions ... 75
CHAPTER 5: Increases of common synaptic input to motorneurons during fatigue ... 76
Introduction ... 77
Materials and Methods ... 80
Results ... 83
Discussion ... 87
3
CHAPTER 6: How to assess performance in cycling: the multivariate nature of influencing
factors and related indicators ... 95
Introduction ... 96
Indexes for cycling performance assessment ... 100
Factors related to cycling performance ... 104
Ergogenic Aids... 108
Environmental variables ... 112
Mutual interactions among factors affecting the performance ... 113
A perspective model ... 116
CONCLUSIONS ... 121
4
I
NDEX OF
F
IGURES
Figure 1: Definitions of ‘fatigue’ ... 21
Figure 2: Central and peripheral sites that contribute to the development of neuromuscular
fatigue. 1)activation of the primary motor cortex; 2) propagation of the neural drive to motor neurons; 3) activation of motor units and muscles; 4) excitation-contraction coupling; 5) neuromuscular propagation; 6) availability of metabolic substrates; 7) state of the intracellular medium; 8) performance of the contractile apparatus; 9) blood flow. ... 22
Figure 3: The descending motor drive from the cerebral cortex to muscles via the motor
neuron during fatigue ... 22
Figure 4: Factors that influence the sEMG ... 26
Figure 5: Fatigue plot of a voluntary isometric submaximal (60% MVC) contraction of the
tibialis anterior muscle. ... 28
Figure 6: The complete A. V. Hill Cardiovascular/Anaerobic/Catastrophic Model of Human
Exercise Performance. ... 31
Figure 7: General organization of the skeletal muscle. ... 33
Figure 8: (Left) Structure of myosin. Myosin is composed of two identical heavy chains and
5
Figure 9: Thick and thin filaments are arranged in regular arrays in the myofibril. A)
Schematic drawing of a longitudinal section of a single sarcomere, which is the region of myofibril between two adjacent Z lines. B) Diagram of a cross section of the myofibril through the A band at the position indicated by the thin gray line in A. In this region, thick and thin filaments overlap, and each thick filament is surrounded by a hexagonal array of thin filaments. ... 35
Figure 10: (Left) Muscle fibers and Motor Neurons classification and properties; (Right)
Trend of force production and fatigue curves in the three types of muscle fibers (FG, FOG and SO). ... 37
Figure 11: Role of Ca2+ in the excitation-contraction coupling. (a) Ca2+ is stored in the SR at
rest; (b) Ca2+ is released into the sarcoplasm in the presence of an AP; (c) Ca2+ remains in the
sarcoplasm after the AP has passed until it is returned in the SR. ... 39
Figure 12: Cross-bridge cycle. ... 40
Figure 13: (Left) Potential mechanisms through which decreasing pH and increased Pi could
cause fatigue. (Right) Summary of peripheral factors contributing to the development of fatigue. ... 42
Figure 14: Mechanisms influencing the maintenance of submaximal force. ... 46
6
Figure 16: Representation of pedal forces as they are fixed in the reference system of the
pedal and of the crank. ... 52
Figure 17: The black line represents the total power output profile, the blue line the power
output profile calculated over the left leg and the red line the power output profile calculated over the right leg. As can be noticed the total power output profile is kept constant. ... 53
Figure 18: In the left side the mean envelope of BF for all subjects with respect to the
percentage of the burst duration are depicted. In the right side of the figure the mean envelope of VL is represented. The black line is representative of the envelope profile at the beginning of the task, while the blue line depicts the envelope profile at the end of the exercise. ... 55
Figure 19: Schematically representation of the protocol. The single slash indicates the
isometric contraction, while the double slash indicates the dynamic bout (1 bout = 10 dynamic knee extensions). This sequence is repeated until the task failure point is approached. ... 63
Figure 20: {EA, F} points for all subjects and all muscles for both experimental sessions (LIE
in the left column and HIE in the right one). Black circles represents the initial condition while red ones represents the end. ... 65
Figure 21: Example of how the fatigue vectors are distributed in the polar domain. ... 67
Figure 22 – {EA, F} points for all subjects and all muscles for both experimental sessions
7
Figure 23: Normalized indicators {ΔEA%,ΔF%} in the JASA plane for all muscles and for
both load conditions LIE (‘black circles’) and HIE (‘blue squares’). ... 70
Figure 24: Fatigue vector characterization for all muscles and for both load conditions LIE
(‘black circles’) and HIE (‘blue squares’). ... 71
Figure 25: Clustering ellipses for normalized parameter (ΔEA%, ΔF%) distributions and for
fatigue vector indicators ( and ). Black lines represents the LIE condition and blue lines the HIE one. ... 71
Figure 26: Maximal Voluntary Contraction for all force levels performed before (grey bars)
and after (black bars) each contraction (* P<0.05, ** P<0.001)... 84
Figure 27: Coefficient of variation of force for all force levels for the first 10 s (grey bars) and
the last 10 s of each contraction. ... 84
Figure 28: Amplitude of sEMG signals. (* P<0.05, ** P<0.001) ... 85
Figure 29: Z-Coherence profiles averaged across all subjects for both the beginning (grey
thick line) and the end (black thick line) of the task and for all contraction levels. Lines in red represent the confidence levels for each coherence profile (dash-dot lines: beginning and dot lines: end) ... 86
Figure 30: Z-coherence profiles depicted as mean (thick line) and standard deviation (color
shade around line) for all contraction levels at the beginning and at the end of the motor task. ... 86
8
Figure 31: Histogram representation of the averaged z-coherence values in the comparison
between beginning and end of the contraction in three frequency ranges for all force levels (* P<0.05; ** P<0.001)... 87
Figure 32: Forces applied to the pedal in the pedal reference system {Xp,Yp }. ... 102
Figure 33: Pedal cycle. Push phase: from the Top Dead Center (TDC) to the Bottom Dead
9
I
NDEX OF
E
QUATIONS
Equation 1: Definition in continuous and discrete time of EMG amplitude estimators. ... 43
Equation 2: (Left) Mean frequency of the EMG power -frequency spectrum P(f).(Middle) Median Frequency of the power-frequency spectrum P(f). (Right) New spectral index proposed by Dimitrov ... 44
Equation 3: Normalized values for EA and F ... 65
Equation 4: magnitude and phase of the ‘fatigue vector’ representative of the {EA%,F%} point in the polar domain. ... 66
Equation 5: Gross Efficiency.. ... 101
Equation 6: Net Efficiency. ... 101
Equation 7: Delta Efficiency.. ... 102
Equation 8: Indexes of Efficiency: (1) for the entirle pedaling cycle (IE360), (2) for the first half of the pedaling cycle (IE180Desc) and (3) for the second half of the pedling cycle (IE180Asc). ... 103
Equation 9: The overall effectiveness (E) is a function of Metabolic Efficiency (EffMet) and Mechanical Efficiency (EffMech). These, in turn, are functions of several other parameters. .. 118
10
Equation 10: Muscular Fatigue is a function depending on several factors as muscular
11
I
NTRODUCTION
If to understand it is difficult, to know it is necessary (Primo Levi)
The term fatigue refers to a really complex and not yet well-defined phenomenon encompassing different causes, mechanisms and forms of manifestations. It develops as a result of metabolic, structural and energetic changes in the muscles due, in general, to a change in the efficiency of the Central Nervous System (CNS), which reflect insufficiency of oxygen and energy supplies in blood (Cifrek, & al., 2009). The excitation given from supra-spinal centers to motorneurons might be impaired during prolonged contractions, causing an increase in the effort associated with a task, a decrease in voluntary activation of the muscles and the recruitment of accessory muscles in order to maintain the desired motor output (Enoka, 2008a). Different definitions have been provided through the literature around the more general term fatigue: some referring to the related-phenomena taking place at the CNS level (central component) (Bigland-Ritchie & Woods, 1984; Nybo, 2003; Bell, 1994) some others directly connected to the impairment in the muscle and in the mechanisms leading to muscle contraction (Hickie, & al. 1996). Some others concern the psychological point of view, in terms of experienced fatigue and perception of effort (Zwarts, & al., 2008; Friedman, & al., 2007), and finally some focus mainly on the mechanical outcome of the occurrence of fatigue, i.e. the decrease of force or muscle soreness (Edwards, 1981; Booth & Thomason, 1991). Since there are many confounding definitions around fatigue, it seems very hard to classify the phenomenon just from one point of view, e.g. just as metabolic, or
12
electro-physiological or biomechanical. Fatigue itself, in fact, is not a physical variable and it cannot be measured: its assessment depends on the definition of some indicators based on physical variables that can be effectively measured, such as force/torque, power, variables associated to the single motor unit such as firing rate, conduction velocity or degree of synchronization (Merletti & Parker, 2005). Physiologists consider the force output of a muscle as an index of muscular fatigue and the point at which the muscle is considered fatigued, i.e. the failure point, is the one at which a contraction can no longer be sustained (De Luca, 1997). This concept introduces the view of fatigue as a point process, hypothesis not consistent with the widespread concept of fatigue as a result of continuous processes mentioned above. Moreover, relying on the concept of failure point, fatigue could be detected only after its occurrence and cannot be used, for example, for ergonomics or training purposes, where timely and possibly predictive information is useful.
Continuous monitoring of muscle fatigue while performing a motor task is possible by measuring different variables: time to endurance of a certain work, lactate concentration, indicators extracted from the myoelectric signals recorded either invasively or on the surface of the skin above the muscles involved (Cifrek, & al., 2009). Each of these variables refers to a particular level of analysis of the phenomenon that might be intracellular, electrophysiological or biomechanical. However, considering each of these variables alone leads to a lack of knowledge and does not clarify the mechanisms involved in the phenomenon. For example, spinal motor neurons receive direct excitatory inputs from supra-spinal sources and peripheral sensory receptors, such as the group Ia afferents of the muscle spindle. The motor neurons can also receive inhibitory input from group Ib afferents
13
(tendon organ) and excitatory input from group II (muscle spindle) afferents, but it is delivered indirectly through interneurons, and the influence of inputs from these sources during fatiguing contractions is still unclear (Gandevia, 2001). The time to endurance is known to be a mechanical manifestation of muscle fatigue and, although it is easy to determine, it depends also on environmental and psychological factors such as motivation or heat/cold in the room (Enoka & Duchateau, 2008). Lactate concentration in a muscle while performing a motor task is determined by means of blood samples taken at predefined time intervals (Cifrek, & al., 2009). Due to this way to take samples and to the way the concentration is then calculated, it is not possible to monitor the phenomenon of fatigue in real-time. Moreover, this kind of measurement gives an estimation of the global fatigue of the organism, without focusing on the particular muscles involved in the motor task.
The continuous monitoring of the phenomenon is, instead, possible by measuring biomechanical and physiological changes occurring in the muscles. The surface electromyographic signal (sEMG), in this context, is the most useful tool. It provides an attractive way to examine the role of the CNS, and its properties are related to biochemical and physiological changes in skeletal muscles during fatiguing contractions. The overall changes exhibited by EMG features have been demonstrated to reflect muscle properties and fiber constituency (Felici, & al., 1997; Gerdle, & al., 1990; 1991; Kupa, & al., 1995; Merletti, & al., 1992; Sadoyama, et al& al., 1988) and recruitment strategies (Solomonow, & al., 1990; Westbury, 1987; Bernardi, & al., 1995; Sanchez, & al., 1993).
Several sEMG-related characteristics have been used for the assessment of peripheral fatigue in many studies: in particular the root mean square (RMS) and the average rectified
14
value (ARV) have been used as amplitude estimators (Devries, 1968; Kwatny, et al., 1970; Petrofsky, & al., 1982) while the mean and median frequency (MNF or MDF) and the normalized higher order spectral moments have been used as spectral indicators (Petrofsky, & al., 1982; Moritani, & al., 1982; Arendt-Nielsen & Mills, 1988; Gerdle, et al., 2000; Potvin & Bent, 1997; Duchêne & Goubel, 1990). Also the muscle fiber action potential conduction velocity (CV) can be included in the features extracted from (multi-channel) EMG suitable for fatigue analysis.
The amplitude of the sEMG signal has been shown to increase during sustained isometric contractions performed at sub-maximal levels (Sadoyama & Miyano, 1981; Maton, 1981; Arendt-Nielsen & Mills, 1988) up to the endurance point, and this behavior has been attributed to the recruitment of additional large and superficial motor units (Lippold, & al., 1960; Viitasalo & Komi, 1977; Moritani & Muro, 1987; Christova & Kossev, 1998) necessary to maintain or increase the required level of force (BiglandRitchie, & al., 1983). After the endurance point EMG amplitude has been shown to fall (Stephens & Taylor, 1972; Komi & Tesch, 1979; Bigland-Ritchie & al., 1983; Moritani, & al., 1986) depending on the task to be accomplished (Dideriksen, & al., 2010). The occurrence of fatigue during maximal and submaximal contractions is reflected also in a spectral shift towards lower frequency bands (Piper, 1912; Viitasalo & Komi, 1977; Moritani, & al., 1986; Arendt-Nielsen & Mills, 1988) even if the underlying physiological mechanisms (Bigland-Ritchie, 1981; Solomonow, & al., 1990; Hagg, 1992; Vøllestad, 1997; Dimitrova & Dimitrov, 2003) has not been clarified yet (Karlsson & Gerdle, 2001; Farina, 2008).
15
Together with the increase in EMG amplitude and drop of EMG spectral moments, it has been reported a slowing in CV as soon as a submaximal endurance contraction progresses (Bigland-Ritchie, & al., 1981; Stulen & De Luca, 1981; Naeije & Zorn, 1982; Eberstein & Beattie, 1985; Arendt-Nielsen & Mills, 1985; Arendt-Nielsen & Mills, 1988; Farina, & al., 2002 ; Farina & Merletti, 2004). This decrease in CV has been correlated with the shift in the power spectrum of EMG towards low frequencies observed during fatiguing contractions (Eberstein & Beattie, 1985; Arendt-Nielsen & Mills, 1985; Krogh-Lund & Jørgensen, 1993). Eberstein and coworkers found that fatiguing contractions of the Biceps Brachii muscle performed at 60% and 70% MVC induced a progressive slowing of the CV which in turn brought to an increase of the duration of the motor unit action potential (MUAP) responsible of the compression of the EMG power spectrum. The relationship that they build up was linear (Eberstein & Beattie, 1985) and was also confirmed by Arendt Nielsen et al. in contractions performed by the Vastus Lateralis muscle at forces ranging from 10% to 90%MVC (Arendt-Nielsen & Mills, 1985). However, other studies claim that other factors apart from changes in the wave form of the MUAP are responsible for the shift of EMG spectrum (Bigland-Ritchie, & al., 1981; Naeije & Zorn, 1982).
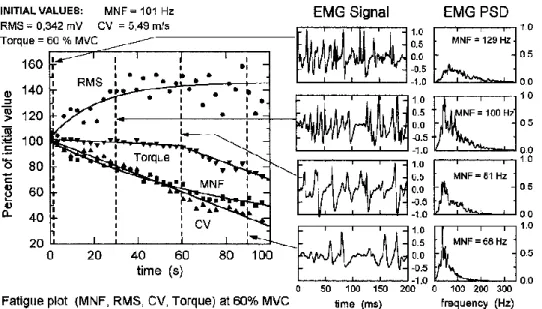
A typical method to evaluate and compare the rate of change of EMG-related features is the fatigue plot, originally proposed by Knaflitz et colleagues, obtained by normalizing each time graph with respect to the intercept of the regression line of the variable in question (ARV/RMS, CV, MDF/NF) (Knaflitz, & al., 1996; Farina, & al., 1999). In this way, the fatigue plot is thought to provide information suitable for the classification of muscle behavior. However, amplitude and spectral parameters do not change only afterwards the occurrence of muscular fatigue but their variation depends also on force production. Experimental
16
studies have demonstrated that, during fatiguing conditions, RMS-EMG increases linearly with force (Moritani & Muro, 1987; Bilodeau, & al., 2003; Castronovo, & al., 2012), while novel computer simulations have led to an overestimation of muscle force from EMG amplitude indicators (Dideriksen, & al., 2010), leaving the question quite unsolved. Because of the lack of a unique and clear behavior shown by the above-mentioned indicators during fatiguing contractions, due in turn, to a unclear definitions of the phenomenon underlying and mechanisms leading to fatigue (central and peripheral), a multi-scale approach is proposed as a novel way to better comprehend the evolution of the phenomenon and of all implications.
The thesis framework will be the following: first, the definitions given through the last century around the concept of fatigue will be reported. Central and peripheral components will be extensively described, highlighting the weakness, the strength and the relevance of both. From that point on, the focus of the thesis will be on peripheral mechanisms and on techniques and methods that help to better understand the fatigue phenomenon. A special attention will be devoted to the surface EMG and to the indicators extracted as a tool to assess the manifestations of fatigue in isometric and dynamic motor tasks. In particular, the limitations offered will act as a springboard to introduce and justify the multi-level approach that is the overall issue of this thesis. This kind of approach to the study of this phenomenon could help in overcoming the main contradictions present in literature and defining the fatigue from a global point of view. In the second chapter, three levels will be proposed as necessary to obtain a more complete view on fatigue: metabolic,
electrophysiological and biomechanical. The biochemical processes involved in the arising of
17
electrophysiological level will concern the modifications occurring at the muscle level and the use of sEMG features for fatigue assessment. The biomechanical level, instead, will concern the adaptations induced by the manifestation of fatigue during the execution of a motor task. In particular, the latter two levels, electrophysiological and biomechanical, will be then examined via experimental protocols involving isometric and dynamic motor tasks that have been developed during these years. Most of these results have been published on international journals or presented at international conferences. In Chapter 3 some preliminary observations about neuromuscular adaptations occurring while performing a cycling task will be presented. In order to overcome as far as possible the limitations met in this study a novel bi-dimensional parameter extracted from sEMG signals will be introduced (Chapter 4). The simultaneous use of temporal and spectral features to classify the muscular status proposed previously by (Luttmann, & al., 2000; Lin, & al., 2004; Potes, 2009) is applied and compared with the results provided through the novel indicator applied to sEMG recordings during isometric contractions in a leg extension task. Chapter 5 will, instead, present an attempt to clarify physiological mechanisms underlying muscle fatigue and, in turn, quantify the information that is possible to extract from sEMG signals. In order to do this, a sEMG decomposition technique together with a coherence analysis on motor unit spike trains will be applied to investigate the changes in neural shared drive and force fluctuations. The last Chapter, finally, will report an example of application of multi-level approach to analyze sport performance. This case, in fact, represents an example of how a “multi-factorial” analysis could help in better understanding all the phenomena concurring and to design an approach for researchers and trainers that could consider all of them. A multi-level model is, therefore, proposed. Conclusions will then follow.
18
C
HAPTER
1:
What is fatigue?
There are no facts, just interpretations (F.W. Nietzsche)
D
EFINITIONS OFF
ATIGUE“Fatigue: a reduction in the efficiency of a muscle or organ after prolonged activity” (Oxford Dictionaries, 2013).
“At first sight might appear an imperfection of our body, is on the contrary one of its most marvelous perfections. The fatigue, increasing more rapidly than the amount of work done, saves us from the injury which lesser sensibility would involve for the organism” (Mosso, 1904).
“Fatigue: state of temporary lowered capacity to perform work of a certain intensity, caused by the work itself” (Heimer, 1987).
“Fatigue is probably the most common symptom of illness affecting sufferers of both acute and chronic conditions. However, confusion surrounds the definition and use of the term fatigue” (Ream & Richardson, 1996).
“Fatigue is a common symptom in neurology and occurs in the diseases of the central and peripheral nervous system. In order to understand the mechanism of fatigue, it is important to distinguish symptoms of peripheral neuromuscular fatigue from the symptoms of physical and mental fatigue characteristic of disorders like Parkinson’s disease or multiple sclerosis” (Chauduri & Behan, 2000).
19
“Although everyone knows fatigue personally, it is a difficult concept to define. For muscular fatigue, one must know the aspect of performance affected. The most obvious demonstrations are decreased maximal force and slowed muscular answer. Fatigue can have a central origin, by reducing cognitive performance or lowering excitation of motorneurons. The word fatigue covers many concepts: sometimes, mental fatigue not produced by exercise, or fatigue after an exhaustive exercise. According to the dictionary “Trésor de la langue française informatisée”, fatigue is a “reduction of organism forces following excessive work, too long a duration of work, or a defective functional state […] We must take into account not only the modality of the exercise that has led to the fatigue but also the ambiance in which the exercise was done: the same work in extreme ambiance can lead to different sensations than under normal conditions. We must also compare the difference between the feeling of exhaustion and the real changes in muscular function” (Sesbouè & Guincestre, 2006).
“In everyday language, the term muscle fatigue is used to denote a variety of conditions that range from an exercise-induced impairment of motor performance through the sensations of tiredness and weakness that accompany some neurological disorders. Although convenient for casual conversation, such broad usage precludes the systematic study of the underlying mechanisms.” (Enoka, 2008b)
“I am a 74 year old man. I have had Parkinson’s disease (PD) for three years. I can live with the PD (not great, but livable), but the fatigue is unbearable. As all my life I was full of superman energy, now I’m good for about an hour or so at a time and between the lightheadedness and the fatigue I’m wasted […] I’ve been told to go see a shrink and start on
20
anti-depressants. I don’t think I’m depressed.” (HT; e-mail to J.H.F. 12/05) (Friedman, et al., 2007)
From the definitions above, it is quite clear that even if fatigue is a seemingly simple word its meaning is not necessarily understood in the same way by the lay public and physiologists and there is at least agreement on its meaning among physiologists and clinicians.
When applied to muscle exercise, fatigue can refer to “failure to maintain the required or expected force” (Edwards R, 1981) or failure to “continue working at a given exercise intensity” (Booth & Thomason, 1991), stressing the fact that fatigue in muscles begins only at the point of task failure when subject exercises until exhaustion (Gandevia, 2001). In fact, the maximal force-generating capacity of muscles starts to decline once exercise begins so that fatigue would begin almost at the onset of the exercise and would develop progressively before the muscle fails to perform the required task. A more realistic definition of fatigue was given by Bigland-Ritchie et colleagues, who defined the phenomenon as “any exercise-induced reduction in the ability to exert force or power, regardless of whether or not the task can be sustained” (Bigland-Ritchie & Woods, 1984). Later, a meeting of physicians in 1990 formally defined fatigue as “a loss in the capacity for developing force and/or velocity of a muscle, resulting from muscle activity under load and which is reversible by rest” (NHLBI Workshop summary , 1990). Finally, fatigue refers “not only to a physical or pathological state in which muscles perform below their expected maximum, but also to a symptom reported by subjects in whom there may be no obvious defect in muscle performance” (Hickie, & al., 1996; Bültmann, & al., 2002).
21
Figure 1: Definitions of ‘fatigue’ as reported by (Gandevia, 2001)
© Copyright 2001 American Physiological Society
Because peripheral force-generating capacity usually declines early during exercise and because Central Nervous System (CNS) changes occur before muscles fail to perform a task, the most useful definition of muscle fatigue is “any exercise-induced reduction in force generating capacity” (Gandevia, 2001). This definition, however, neglects the intramuscular mechanisms that potentiate force during fatiguing exercise and focuses just on the net reduction in performance that develops at the end (Gandevia, 2001).
C
ENTRAL ANDP
ERIPHERALF
ATIGUEDespite the large number of definitions on fatigue that have been provided during the last century, researchers focused on determining if the mechanisms responsible for fatigue are located in the exercising muscle (“peripheral fatigue”) or in those parts of the nervous system that activated the involved muscles (“central fatigue”) (Enoka, 2008b). In fact, muscle performance can be limited by the muscle and also by the neural machinery that drove it (Gandevia, 2001).
22
Figure 2: Central and peripheral sites that contribute to the development of neuromuscular fatigue. 1)activation
of the primary motor cortex; 2) propagation of the neural drive to motor neurons; 3) activation of motor units and muscles; 4) excitation-contraction coupling; 5) neuromuscular propagation; 6) availability of metabolic substrates;
7) state of the intracellular medium; 8) performance of the contractile apparatus; 9) blood flow.
Adapted from Boyas & Guevel, 2011
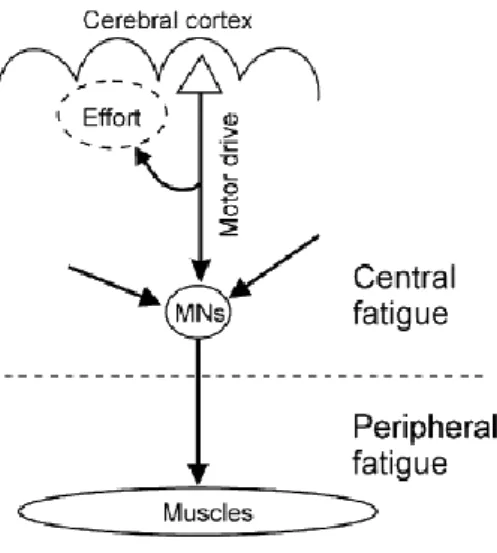
Figure 3: The descending motor drive from the cerebral cortex to muscles via the motor neuron during fatigue
From Kernell, 2009. © Copyright 2009 Oxford University Press
C
ENTRALF
ATIGUECentral fatigue can be defined as a “progressive, exercise-induced degradation of the muscle
voluntary activation” (Gandevia, & al., 1995). One of the causes of this weakness in central
command during prolonged exercise could be the decreased excitation supplied by the motor cortex. Furthermore, central command may be limited by changes in the brain concentration of other substances, such as ammonium ions and glycogen (Boyas & Guevel,
23
2011). Voluntary activation is defined as a progressive reduction in voluntary activation during exercise. Voluntary activation refers to a notional level of “drive” to muscle fibers and motor neurons. This term is often used without distinction between the drive to the motor neuron pool and that to the muscle. These drives are not the same: one recruits motor neurons and increases their firing, and the other relies on muscle fibers to translate the motor neuron firing into force. As applied to motor neurons, the term voluntary activation becomes poor since the source of excitation is not well defined (from descending motor paths and associated spinal circuits). During maximal isometric efforts the motor unit firing rates decline, initially rapidly and then reach a plateau after about 30s. This decline is accompanied by changes in the properties of muscle receptors and, in turn, of the reflexes they are normally able to evoke (Gandevia, 2001). The maximal rates vary for subjects and muscles, due to the type of motor neurons (Grimby, & al., 1981; Bellemare, & al., 1983; Bigland-Ritchie, & al., 1983; Gandevia, & al., 1990; Peters & Fuglevand, 1999). Another indicator of a central failure of voluntary activation can occur when initially submaximal isometric contraction (e.g. 30% MVC) is held until it cannot longer be continued (Loescher, & al., 1996). Development of central fatigue can also be inferred from the increasingly obvious fluctuations in force (Taylor, & al., 2003; Moritz, & al., 2005; Contessa, & al., 2009; Missenard, & al., 2008, 2009) and variations in motor unit firing rates (Grimby, & al., 1981; Kernell & Monster, 1982; Bigland-Ritchie, & al., 1986; Garland, & al., 1994; Moritz, & al., 2005) as the voluntary force declines. The natural decline in motorneuron firing rate during isometric MVCs is however, beneficial because of the hysteresis in the force-frequency relationship and the stability of its descending path. This kind of discharge pattern, in fact, efficiently maintains force. As the precise pattern of MU firing can enhance force production and
24
minimize fatigue, a failure of these strategies impairs voluntary activation and might contribute to the development of fatigue. However, the CNS is involved not only in driving motor neurons but also in the increased sense of effort (Aniss, & al., 1988), the increased tremor of the exercising limb (Lippold, & al., 1957; Lippold, 1981; Ebenbichler, & al., 2000), the recruitment of muscle initially not involved (Fallentin, & al., 1993; Green, 1997) in the task and the subjective increase in effort. In particular, after severe exercise, tremor increases across a wide frequency range and this phenomenon persists for many hours (Buchtal & Madsen, 1950; Lippold, 1970, 1981). Moreover, a small but statistically detectable synchronization exists between the firing probabilities of motor units within a muscle during voluntary contractions, suggesting some excitatory/inhibitory presynaptic drives (Buchtal & Madsen, 1950; Nordstrom, & al., 1990; De Luca, & al., 1993; Arihara & Sakamoto, 1999; Carpentier, & al., 2001; Contessa, & al., 2009). The relationship between synchronization and fatigue-induced tremor is still unclear (Nordstrom & Miles, 1991). Some of these central features may disrupt performance more than reduction in maximal muscle force. The increased perceived ‘effort’ reflects the need to recruit more motorneurons and muscles and to drive them harder (Gandevia, & al., 1996; Gandevia, 1998).
Thanks to the evidence obtained by means of isometric contractions made by different muscles, it is possible to state that central fatigue is likely to limit performance. In fact, performance can deteriorate due to (1) the central fatigue development in muscles working almost at maximal level; (2) a different motor limits implying the deterioration of the capacity to coordinate the contraction to be accomplished; (3) a tolerance limit to avoid catastrophic consequences for the whole organism.
25
PERIPHERAL FATIGUE
The term peripheral fatigue usually refers to “exercise-related changes which are distal to the site of stimulation and which are seen as a decrease in twitch or tetanic force generated by the stimulus” (Taylor, & al., 2000). It largely occurs within the muscle but may present components related to neuromuscular junction or terminal branches of the motor axon (Taylor, & al., 2000). At the core of the peripheral fatigue is the energy-carrying molecule adenosine triphosphate (ATP), which is the primary molecule used in the body as an energetic intermediate. In the 1920s, A.V. Hill and his colleagues postulated that fatigue arose from the development of oxygen deficiency and the accumulation of lactic acid due to anaerobiosis (Hill, 1932). The factors involved in peripheral fatigue include impairment in the transmission and propagation of muscle action potentials, excitation-contraction coupling and others related contractile mechanisms. Neuromuscular transmission is defined as transformation of the nerve action potential (AP) into a muscle action potential and takes place at the neuromuscular junction. During fatigue this mechanisms can be altered by: (i) insufficient propagation of the nerve potential at the nerve ending; (ii) failure of the coupling between excitation and neurotransmission; (iii) neurotransmitter depletion; (iv) reduced neurotransmitter release; (v) decrease in the sensitivity of the acetylcholine receptors and the post-synaptic membrane. The sEMG seems to be the most appropriate tool to examine the role of the CNS and its properties related to biochemical and physiological changes in skeletal muscles during fatiguing contractions. In fact, it provides a quantitative approach to the analysis of fatigue based on the definition of some indexes relying on the time evolution of its features throughout the contraction. In this way, it is possible to monitor the evolution
26
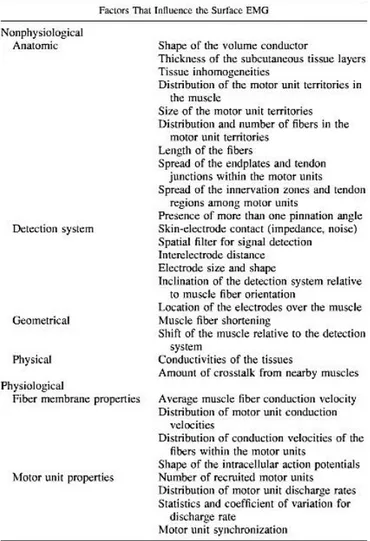
of the phenomenon from the very beginning of the muscle effort (Merletti & Parker, 2005). Surface EMG is however influenced by several factors, hereby reported, that influence the fatigue assessment.
Figure 4: Factors that influence the sEMG as reported by Farina, et al., 2004.
© Copyright 2004 American Physiological Society
Already in 1912, Piper reported, in one of his study, a slowing of surface myoelectric signals during static contractions (Piper, 1912). Given to the random nature of the voluntary EMG signal, this slowing cannot be easily quantified in the time domain (Merletti & Parker, 2005). Some years later, Cobb and Forbes (Cobb & Forbes, 1923) noticed an increase in the signal amplitude during fatiguing static motor tasks that was later confirmed by Knowlton and
27
colleagues and Lippold and colleagues (Knowlton & Bennet, 1952; Lippold, & al., 1960). Bigland-Ritchie et al. (Bigland-Ritchie & Lippold, 1954) established that integrated surface EMG increased linearly with force. There is an obvious increase in the low-frequency content of the signal during fatigue (Kranz, & al., 1983; Mills, 1982), but this can be fully explained by changes in the compound muscle action potential, and thus, the ongoing signal provided no certain clue about central changes in motor neuron firing frequency. Changes in frequency spectrum of EMG accompany muscle fatigue, but they do not definitively cause it at a peripheral level, nor do necessarily signify altered neural drive (Gandevia, 2001). The increase in concentration of lactate leads to changes in intracellular pH which, in turn, is responsible for the drop of muscle fiber conduction velocity (CV). The latter directly influences the MU action potential (MUAP) waveform and, finally, the properties of sEMG as interference signal (Cifrek, & al., 2009). The lowering of CV is one of the causes for the shift of the sEMG spectrum towards lower frequencies and of the increase of the amplitude (De Luca, 1984). Others, by analyzing sEMG signals coming from Rectus Femoris muscle during static contractions, found out an increase in the amplitude and duration of the averaged MUAP and a compression of the spectrum, even if these results are in contradiction with results coming from intramuscular recordings (Viitasalo & Komi, 1977).
The amplitude of the EMG also seemed simple to interpret in terms of neural drive during fatigue, but the size and propagation velocity of the intracellular muscle fiber action potential (Dimitrova & Dimitrov, 2003) and a possible compromise at the neuromuscular junction affects the signs. Although the consensus is that blocking at the neuromuscular junction does not occur significantly with natural rates of motor unit firing, activity-induced changes in the single fiber action potential, and activation of the muscles Na+/K+ pump to
28
degrees which vary between fiber types and the degree of local ischemia seriously limit the surface EMG as a measure of voluntary activation of motorneurons. The sEMG, in fact, comprises the sum of all the electrical contributions made by the active MUs as detected by electrodes placed on the skin overlying the muscle. The information extracted from the sEMG is often considered as a global measure of MU activity, because of the inability of the traditional bipolar recording configuration to detect activity at the level of single MUs. The global characteristics of the sEMG, such as amplitude and power spectrum depend on the membrane properties of the muscle fibers as well as on the timing of MU action potential. Thus, the sEMG reflects both peripheral and central properties of the neuromuscular system.
Figure 5: Fatigue plot of a voluntary isometric submaximal (60% MVC) contraction of the Tibialis Anterior
muscle. From Merletti & Lo Conte, 1997. © Copyright 1997 Elsevier Science
The alternative to measures of global EMG during fatigue was to record the discharge of single MU in voluntary contractions. Although the principle of motor neuron recruitment and frequency modulation had been known for decades, few had succeeded in recording unitary activity during sustained strong contractions due to the interference pattern caused
29
by the discharge of many muscle fibers. Motor units were believed to be recruited in a relatively stable order according to Henneman’s size principle, from those with slow conduction velocity producing small forces to those with fast conduction velocity producing large forces (Henneman, & al., 1965; Henneman & Mendell, 1981; Mendell, 2005). This principle links motor neuron properties (i.e. small size, long after hyperpolarization, and low axonal conduction velocity) with properties of muscle fibers (small twitch force, long contraction times, slow fiber conduction velocity and low fatigability). During fatigue, exceptions to Henneman’s principle seem to occur (Enoka, & al., 1989). An additional effect of the distribution of motor unit size and fatigability across the pool is that during sustained maximal contractions, the decline in force will be dominated by fatigue in the large motor units, those recruited late in voluntary contractions. Furthermore, there is probably an increased difference among the thresholds of the motor neurons recruited close to maximal force, so that greater effort will be needed to generate the final part of the force in the maximal effort (Gandevia, 2001). Another observation key on motor unit behavior during fatigue was made by Marsden and colleagues (Mardsen, & al., 1983). During sustained maximal contractions they observed a decline in firing rates of motor units in the FDI muscle. This decline was termed muscular wisdom because it matched the firing of the motor neuron to the altered contractile properties of the muscles. This behavior was subsequently confirmed by (Bellemare, & al., 1983; Bigland Ritchie, & al., 1983; Mardsen, & al., 1983; Gandevia, & al., 1990). If the voluntary contraction continues for more than a few seconds discharge rates decline and approach a plateau towards 60s (Grimby, & al., 1981) (Bigland-Ritchie, & al., 1983). This decline in rate assists the output from the muscle because relaxation times for whole muscle usually lengthen during strong isometric contractions and thus lower
30
discharge frequencies produce the same fraction of maximal force (Bigland-Ritchie, & al., 1983).
31
CHAPTER
2:
The multi-level approach to better
understand mechanisms
of muscular fatigue
When we try to pick out anything by itself, we find it hitched to everything else in the Universe. (J. Muir)
In the past century, Mosso (Mosso, 1904) tried to replicate the variability of performance during a voluntary task. If performance deviated from that expected, then he inferred that the changes represented an influence of CNS. He considered not only the physical activity but also the mental work since mental excitement or agitation could improve voluntary endurance and concluded that performance variations reflected central factors which, in turn, alter directly the peripheral function of the muscle. If the muscle were the only significant limit to voluntary performance, then it’s natural to check how the CNS drives the muscles.
Figure 6: The complete A. V. Hill Cardiovascular/Anaerobic/Catastrophic Model of Human Exercise
32
It is commonly thought that many neurophysiological mechanisms are perturbed before the body feels the effect of fatigue. In fact, the state of the neuromuscular system (i.e. the energy reserves, the ion concentrations and the arrangement of contractile proteins) is altered soon as the exercise starts and fatigue develops until the muscle is no longer able to perform the requested task (Boyas & Guevel, 2011). It is thus, not simple to determine the onset and development of muscular fatigue and, in particular, to distinguish between central and peripheral factors. This is a crucial topic since it highlights the necessity of a multi-level approach to better understand the mechanisms leading to the manifestation of muscle fatigue. In fact, the activation of the muscle from the CNS has its effect not only at a metabolic level but it reflects also in changes in electro-physiological environments and biomechanical observations.
B
IOCHEMICAL LEVELMuch of the knowledge about the mechanisms of muscle contraction comes from biochemical and functional studies performed in the early 50s. During this period, some methods for isolating specific muscle proteins were developed as well as the methods for measuring their physiochemical and biochemical properties. In order to better understand them and the mechanisms that are believed to cause the impairment that lead to fatigue at the cellular level, a brief overview about muscle structure and mechanisms of contraction will follow.
33
THE STRUCTURE OF THE SKELETAL MUSCLE CELLS
As Sir Charles Sherrington said in 1924, “to move things is all that mankind can do, for
such the sole executant is muscle, whether in whispering a syllable or in felling a forest”
(Sherrington, 1924). The major consequence of the elaborate information processing that takes place in the brain is the contraction of the skeletal muscle. This is composed by many identifiable elements. The cells that compose it, the muscle fibers, are linked together by a three level network of connective tissue1: epimysium, endomysium and perimysium.
Figure 7: General organization of the skeletal muscle. From Blaustein, et al., 2012.
© Copyright 2011 Elsevier
The first covers the outside surface of a muscle and separates it from the surrounding muscles. Muscles producing small of very fine movements have smaller fascicles containing relatively few fibers and a larger proportion of connective tissue. Arteries and veins run through the endomysium (Gowitzke & Milner, 1988). The perimysium collects bundles of fibers into fascicles in a cross-pattern adding stability to the structure. At the end, the
endomysium is made up of collagen fibers 60 to 120 nm in diameter and surround each
1 Connective Tissue is a kind of tissue that support, connect or separate different kind of tissues and
34
muscle fiber (Stone, & al., 2007). This connective tissue matrix connects muscle fibers to tendon and hence to the skeleton (Huijing, 2003). The cell membrane that composes a muscle fiber is a 7.5 nm thick excitable membrane called sarcolemma. The fluid enclosed between the fiber and the sarcolemma is then known as sarcoplasm (Enoka, 2008c). The latter contains nourishing sources (such as lipid or glycogen), organelles (such as nuclei, mitochondria etc.), enzymes (such as myosin adenosine triphosphate [ATPase], etc.) and the contractile apparatus (such as bundle of myofilaments arranged into myofibrils). The sarcoplasm also contains a membranous system that assists muscle in the conduction of the signals coming from the CNS. This system encompasses the sarcoplasmic reticulum (SR), lateral sacs and transverse tubules (T-tubules). The SR runs longitudinally along fibers and, at specific locations long the myofibril, bulges into lateral sacs. Orthogonal to the SR and associated with sacs are the T-tubules, which are branched invaginations of the sarcolemma. The rapid transmission of the activation signal from the sarcolemma to the contractile apparatus is facilitated by the connection between the SR and T-tubules. The basic contractile unit of the muscle is the sarcomere and it comprises a set of thick and thin contractile proteins (Enoka, 2008). Skeletal muscles, under the microscope, show an alternance of low and high electronic density regions, named A-band (anisotropic) and I-band (isotropic) respectively. These differences are due to the disposition of thin (actin2) and thick (myosin3) filaments, in part
aligned and in part overlapped.
2 Actin is the main component of the thin filament. In the monomeric form, it is a globular protein and
presents two isoforms: α-skeletal and α-cardiac differing by only four amino acids encoded by two different genes.
35
Figure 8: (Left) Structure of myosin. Myosin is composed of two identical heavy chains and two different pairs of
light chains. From Blaustein, et al., 2012; (Right) Structure of the actin. From Wikipedia, 2013.
The I-band is the region with thin filaments, while the A-band contains thick filaments. In the middle of the I-band there is a thin structure, called Z-line, orthogonal to the filaments. Also the A-band has a thin central structure, the M-line, with a high electronic density. The sarcomere includes, then, the zone of myofibrils from one Z band to the next one. Repeating sections of sarcomere compose the myofibrils (Nelson & Cox, 2004).
Figure 9: Thick and thin filaments are arranged in regular arrays in the myofibril. A) Schematic drawing of a
longitudinal section of a single sarcomere, which is the region of myofibril between two adjacent Z lines. B) Diagram of a cross section of the myofibril through the A band at the position indicated by the thin gray line in A.
In this region, thick and thin filaments overlap, and each thick filament is surrounded by a hexagonal array of thin filaments. From Blaustein, et al., 2012. © Copyrighy 2011 Elsevier
3 Myosin is the most abundant muscle protein and is the molecular motor of muscle contraction.
Myosin present in the sarcomere is composed of two heavy chains (MHCs) and four light chains (MLCs). In lower limb muscles of healthy adults, MHC-I is the most abundant isoform followed by the MHC-IIA. In upper limb muscles the proportion of the fast MHC isoforms is generally higher.
36
CLASSIFICATION OF MUSCLE FIBERS AND MOTOR UNITS
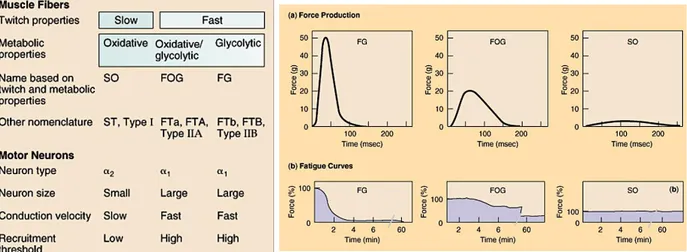
Muscle fibers possess distinct mechanical and energetic properties and their heterogeneity has its origin in the molecular composition of the intracellular structure where the molecular motor of the muscle contraction converts chemical into mechanical energy, i.e. the myofibrils. Therefore, large differences are exhibited by the skeletal cells, and several efforts have been made to classify them. One is based on the myofibrillar ATPase activity (Engel, 1962), leading to the first separation in type I and type II fibers. The human trunk and the limb muscles, for example, exhibit three main groups, I, IIA and IIB and four intermediate groups, IIC, IC, IIAC, IIAB (Staron & Hikida, 1992). A parallel classification is based on the determination of metabolic enzymes (Ogata & Mori, 1964). Fibers identified with this method present different content of mitochondrial enzymes and can be related with oxidative potentials. Based on observation of the contractile properties of motor units (force, velocity and fatigability), Burke and coworkers (Burke, Levine, & Zajac, 1971) classified four motor unit/fibers types: slow (S or SO), characterized by long duration twitches, low peak force and high resistance to fatigue, high oxidative enzymes concentration and low glycolytic markers concentration and low ATPase activity; fast fatigue resistant (FOG or FR), present high oxidative and glycolytic enzymes concentration and ATPase activity; fast fatigable (FG or FF), display high contraction rates and extremely large forces but for very short time, high ATPase and glycolytic activity and low oxidative capacity.
37
Figure 10: (Left) Muscle fibers and Motor Neurons classification and properties; (Right) Trend of force production
and fatigue curves in the three types of muscle fibers (FG, FOG and SO). Source web
However, the major determinant of muscle fibers properties (i.e. the maximum shortening velocity, ATPase activity, maximum power output and rate of force developed) is the MHC (Myosin Heavy Chain) isoforms. This classification has a high relevance in the context of fatigue since a fast isoform consume ATP at faster rate that the slow isoform (Allen, & al., 2008).
MECHANISMS OF MUSCLE CONTRACTION
At the neuromuscular junction, the acetylcholine4 takes less than 100 μs to diffuse
across the synaptic cleft and attach to receptors on the post-synaptic membrane (i.e. the muscle fiber). This attachment results in the opening of the Na+/K+ channels and the influx of
Na+ into and the efflux of K+ from the muscle fiber. The movement of these ions results in the
development of the end-plate potential that can trigger the generation of a muscle fiber action potential (AP). This process is referred to as neuromuscular propagation (Enoka, 2008c). Once an AP has been generated, several processed, known as excitation-contraction coupling,
4 Acetylcholine (ACh) is a small molecule neurotransmitter used in both the brain and peripheral
38
contribute to the generation of force. Seven major processes are involved in this conversion phenomenon and in particular: (1) propagation of the action potential along the sarcolemma; (2) propagation of the AP along the T-tubule; (3) coupling of the AP to the change in Ca2+
conductance of the SR; (4) release of Ca2+ from SR; (5) reuptake of Ca2+ by the SR; (6) Ca2+
binding to troponin5 (Tn); (7) interactions of the contractile proteins. Under normal
circumstances, the thick and thin filaments are prevented to interact by the regulatory action of TnT and tropomyosin6 (TM), and Ca2+ is stored largely in the SR. The events, known as
Ca2+ disinhibition, enable the muscle fibers AP to trigger the release of Ca2+ from SR. In a
resting state, the potential across the sarcolemma is negative on the inside with respect to the outside and most of the Ca2+ is stored in cisternae, i.e. enlargements of the SR near the
T-tubules. When the AP as it is propagated along the sarcolemma down the T-tubules and into the interior of muscle fiber, it triggers an increase in Ca2+ conductance, which corresponds to
an opening of ryanodine receptors7 (Bastian & Nakajima, 1974). When the Ca2+ concentration
in the sarcoplasm is above a threshold level, Ca2+ binds to Tn that is attached to the actin
filament. This binding probably determines a structural change in the thin filament such that the myosin-binding site is uncovered and the two filaments become able to interact (Enoka, 2008c).
5 Troponin: is a three component molecule that forms part of the actin filament and is involved in the
regulation of interaction between actin and myosin. TnC is the component of Tn that binds Ca2+; TnI is
the component of Tn that inhibits G-actin from binding to myosin; TnT is the component of Tn taht binds to tropomyosin (Enoka, 2008a).
6 Tropomyosin: is a thin-filament protein involved in the regulation of interaction between actin and
myosin (Enoka, 2008a)
39
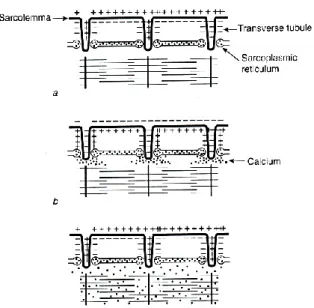
Figure 11: Role of Ca2+ in the excitation-contraction coupling. (a) Ca2+ is stored in the SR at rest; (b) Ca2+ is released
into the sarcoplasm in the presence of an AP; (c) Ca2+ remains in the sarcoplasm after the AP has passed until it is
returned in the SR. From Enoka, 2008a.
© 2008 Copyright by Roger Enoka
The change in Ca2+ conductance is, however, transient: once the AP passed, the conductance
returns to a resting state and Ca2+ is absorbed again into the SR. the rate at which this
reuptake happens determines the rate of decline of force after the cessation of AP. Fatigued muscle, for example, exhibits a reduction in the rate of return which produces a decline in the rate of relaxation time. The reuptake then lowers the concentration of Ca2+ in the
sarcoplasm, which inhibits the activity of the enzyme that regulates the interaction of actin and myosin (Enoka, 2008c).
The Ca2+ disinhibition phenomenon causes the interaction between the two contractile
proteins, actin and myosin, known as cross-bridge cycle. This process involves the use of ATP by the globular head of myosin to attach actin and comprises several steps that can be distinguished based on the absence or presence of Ca2+ bounded to Tn (Gordon, & al., 2001).
For each globular head the cycle involves a detachment phase, an activation phase and an attachment phase (Enoka, 2008c). Hydrolysis of ATP into ADP and Pi causes a rotation of the
40
head of the protein toward the tail and the pulling on the compliant arm of the cross-bridge.
The direct consequence of this pull is a relative movement of thin and thick filaments and the shortening of the sarcomere. Since the displacement of the myosin head occurs while actin and myosin are connected, both the filaments slide one with respect to the other and exert a force on the cytoskeleton. The sliding of the filaments gave rise to the sliding filament theory of
muscle contraction (Huxley & Niedergerke, 1954). In detail, ATP binds to myosin and then, in
presence of Ca2+, to Troponin (TnT) and Tropomyosin (TM). A myosin-binding site is
exposed on the thin filament and a physical link is formed between actin and myosin (Kitamura, & al., 1999). Since the molecules of the myosin are oriented in opposite directions at the opposite ends of the thick filament, each of them pulls its adjacent thin filament toward the center of the sarcomere and then the sarcomere shortens. The cycling of cross-bridges continues as long as there are sufficient amounts of Ca2+ and ATP in the muscle cell.
The force exerted by the muscle is usually explained as a consequence of the concurrent, but not synchronous, cycling of many cross-bridges following Ca2+ disinhibition. This
phenomenon is referred to as cross-bridge theory of muscle contraction (Huxley, 2000).
41
METABOLIC PROCESSES UNDERLYING MUSCLE FATIGUE
From the biochemical point of view, two are the main causes that determine fatigue and that have to be analyzed: changes in intracellular environment (accumulation of lactate and hydrogen ions; accumulation of ammonia or heat) and changes within the muscle
fibers (accumulation of inorganic phosphate, hydrogen, magnesium (Mg2+) and calcium ions
(Ca2+) in the sarcoplasm; inhibition of Ca2+ release by the sarcoplasmic reticulum (SR);
decrease in glycogen reserves and drop in blood glucose; drop in nerve action potential speed; increase in the efflux of potassium (K+) ions in the muscle fibers). Each of the
processes of the cross-bridge cycle can be influenced by different factors: e.g. the opening of Ca2+ release channels in the SR is mediated by ATP, inhibited by Mg2+ and altered by Pi and
pH. The impairment of excitation-contraction coupling, however, does not contribute to the initial decline of force during a fatiguing contraction (Allen, Lamb, & Westerblad, 2008), but, rather, as fatigue progresses the availability and efficacy of Ca2+ as activation signal decreases
and so does the force exerted by each cross-bridge cycle (Enoka, 2008). These phenomena are referred to as activation failure and myofibrillar fatigue. The first one occurs generally later than the other during high tension contractions and it is believed to be caused by a decrease in the sensitivity of myofibrils to Ca2+ and a reduction in the release of the same by SR, but also by a
reduction in the release of Ca2+ from the SR. Myofibrillar fatigue, instead, corresponds to an
impairment of cross-bridge function highlighted from a decrease in isometric force and shortening velocity (Edman, 1995). During prolonged exercises there is an increase of Pi due
to the dissociation of phosphocreatine (PCr) into Pi and Cr and the hydrolysis of ATP
42
responsible for the decrease in force generation since it is associated with a diminished intracellular pH, which, in turn, leads to an increase in acidosis (Sahlin, 1985; Sahlin, & al., 1981; Lamb & Stephenson, 2006).
Figure 13: (Left) Potential mechanisms through which decreasing pH and increased Pi could cause fatigue. From
Stackhouse, et al., 2001; (Right) Summary of peripheral factors contributing to the development of fatigue. From Shei & Mickleborough, 2013. © Copyright 2001 American Physical Therapy Association
E
LECTROPHYSIOLOGICAL LEVELThe mechanisms related to the manifestation of neuromuscular fatigue during submaximal contraction are a combination of an increase in MU recruitment and modulation of their discharges. The increase the amplitude level of EMG, estimated by variables as Average Rectified Value (ARV) and Root Mean Square (RMS) has been assumed to be due to failure in the muscle contractile properties, so that with sustained tasks the active fibers exert progressively less force. In order to compensate for this, new motor units are recruited and the already active will fire with a decreased frequency (Lippold, & al., 1960; Viitasalo & Komi, 1977). The equation representing amplitude estimators of EMG are shown below:
43
Tdt
t
x
T
ARV
0)
(
1
(continuous time)
T dt t x T RMS 0 2 ) ( 1 (continuous time)
N i i x N ARV 1 1 (discrete time)
N i ix
N
RMS
1 21
(discrete time)Equation 1: Definition in continuous and discrete time of EMG amplitude estimators.
From Hermens H., et al., 1999. ISBN 90-75452-17-9.
Different types of MU types are distinguished according to their mechanical response: the ones with fast fibers (FT) produce short time to peak forces while the one made by slow fibers (ST) need more time to reach the maximum. Generally, ST-MU encompass fibers with slower conduction velocity (CV) while FT-MU comprises of fibers with higher CV. Fiber composition is generally investigated by biopsy or histochemical analysis even if the information carried out is not representative of the whole muscle. The variables potentially useful for this purpose are the spectral characteristics of the sEMG, i.e. mean frequency (MNF), median frequency (MDF), or normalized higher spectral moments. The MNF (Mortimer, & al., 1970; Kwatny, & al., 1970; Komi & Tesch, 1979; Arendt-Nielsen & Mills, 1985; Eberstein & Beattie, 1985) represents the ratio between the spectral moment of order 1 and the one of order 0 (Lindstrom, & al., 1977). The MDF, instead, is the frequency dividing the spectrum into two regions of equal power (Stulen & De Luca, 1981; Mannion & Dolan, 1994; Kupa, & al., 1995; Merletti & Roy, 1996). Finally, the index normalized index FInsmk, proposed by Dimitrov and colleagues is expressed by the ratio between the spectral
moments of order (-1) and the spectral moment of order k, with k ranging from 1 to 5 (Dimitrov, & al., 2006). The formulations of the MNF, MDF and FInsmk are reported in
44
0 0 * df f P df f P f MNF
MDF MDF df f P df f P df f P 0 20 1
2 1 2 1 * * 1 f f k f f nsmk df f P f df f P f FIEquation 2: (Left) Mean frequency of the EMG power -frequency spectrum P(f).(Middle) Median Frequency of
the power-frequency spectrum P(f). From Stulen & De Luca, 1981. © Copyright 1981 IEEE (Right) New spectral index proposed by Dimitrov, et al., 2006. © Copyright 2006 by the American College of Sports Medicine
The MDF and MNF provide some basic information about the spectrum of the signal. They coincide if the spectrum is symmetric with respect to its center line, but are usually different reflecting the skewness of the power spectrum. The standard deviation of the estimated MDF is higher than the one of MNF (Stulen & De Luca, 1981, 1982), even if it has been demonstrated that in presence of additive noise and fatigue (spectrum more skewed) the MDF leads to better estimates (Merletti & Parker, 2005), and that’s why it is the preferred parameter for measuring frequency compression as a function of conduction velocity of the muscle fibers. These spectral parameters have been used several times as an indirect measure of the relative changes in muscle fiber CV (Merletti, & al., 1990) or to infer about MU recruitment strategies and fiber type composition (von Tscharner & Nigg, 2008; Wakeling, 2008). Actually, it is true that each MU has a specific force-generating capacity but task specificity of each MU is not a physiological variable. Muscle fibers of different MU, within a muscle, have a complex distribution and they are locked among themselves, making thus, difficult to assign a filtering weight to the AP propagating along each fiber (Bawa, 2008). Furthermore, the possible inference about motor unit recruitment strategies is based on the rationale that higher threshold (FT) MU produce AP with larger energies at higher frequencies than lower threshold ones (ST). This is not completely true (Farina, 2008). First of all because the two types of fibers do not have distinct CV but rather CV shows a continue