The Rise of
Collaborative Investing
Sovereign Wealth Funds’ New
Sovereign Investment Lab - Università Bocconi
The Sovereign Investment Lab is a group of researchers brought together in the Baffi Carefin Centre For Applied Research on International Markets, Banking, Finance and Regulation at Bocconi University. The Lab tracks the trends of sovereign fund investment activity worldwide and conducts pathbreaking research on the rise of the State as an investor in the global economy. Research output aims to meet the highest scientific standards, but also to be accessible for a variety of stakeholders also outside academia, such as institutional investors, policymakers, regulators, and the media.
Boston Consulting Group (BCG) is a global management consulting firm and the world’s leading advisor on business strategy. We partner with clients from the private, public, and not-for-profit sectors in all regions to identify their highest-value opportunities, address their most critical challenges, and transform their enterprises. Our customized approach combines deep insight into the dynamics of companies and markets with close collaboration at all levels of the client organization. This ensures that our clients achieve sustainable competitive advantage, build more capable organizations, and secure lasting results. Founded in 1963, BCG is a private company with offices in more than 90 cities in 50 countries. For more information, please visit bcg.com
The Rise of Collaborative Investing:
Sovereign Wealth Funds’ New
Strategies in Private Markets
Table of
Contents
Executive Summary ...04
Introduction ...08
Delegation and co-operation: towards a
taxonomy of investment models ...10
SWF investments in private markets ...16
Applying the taxonomy: deal types and
trends in investment models ...19
Disentangling private markets: deal
types by asset class ...22
The geography of private markets ...27
Sectoral analysis ...37
01
02
03
04
05
06
07
SEC
08
09
10
11
12
13
The decline of private equity funds? ...39
Limited partnerships and beyond: testing the
co-investment model ...41
The only game in town: the rise of
direct equity partnerships ...46
Teaming up: platforms and
investment alliances ...51
The demise of solo investments ...56
Challenges ahead ...60
References ...62
Appendix: Data description and methodological note ...63
Executive Summary
Over the last years sovereign investors have made a significant shift away from traditionally liquid asset allocations centered around fixed income and public equities, and towards more illiquid alternative investments (i.e. private equity, venture capital, RE and infrastructure) in search for higher returns. Since 2009, SWFs have invested $433bn in alternatives, with an average allocation as high as 16% of total assets. This shift clearly plays to SWFs’ strengths, effectively leveraging their “patient capital” to generate illiquidity premia over the risk-adjusted returns achieved in public markets.
In this process, several SWFs have quickly realized how, developing successful alternative strategies can be a daunting challenge, with potentially disrupting implications on conventional business models, historically more geared towards investing through third parties. Having tipped their toes into alternatives mostly by committing capital to PE funds through a traditional LP model, SWFs have progressing moved towards a combination of the LP/GP model with new and more collaborative investing options. Furthermore, in an effort to mitigate the risks arising from too large exposure to direct investments and relatively limited capabilities in the asset class, in recent years SWFs have increasingly resorted to approaches that are more cooperative in nature.
In our analysis of SWFs approaches to investing in private markets, we have developed a taxonomy of four different models, along a spectrum of decreasing delegation levels: the LP model, the co-investment model, the investment platforms, and the direct investment model.
Co-investments, defined as deals where the LP invests alongside the GP in a target asset, have attracted SWFs’ attention as they reduce risk exposure while allowing for more flexibility in portfolio construction and exposure to risk factors. Furthermore, co-investment arrangements allow SWFs to expose their internal teams to new sectors and investment processes, working alongside experienced partners, and building capabilities to potentially step into full-fledged direct equity investment strategies. Investment platforms on the
04 S O V E R E IG N W E A LT H FU N D S’ N E W S T R A T E G IE S I N P R IV A T E M A R K E T S
other hand, are funds or joint ventures operating with a specific focus or mandate; they resemble LP arrangements in that they still involve a significant amount of delegation and intermediation by GPs, but SWFs have a more active role in platforms compared to the traditional LP model.
Three major trends stand out in our analysis of SWFs’ investments in private markets:
1. The loss of importance of LP investments for SWFs in both absolute and relative terms, being replaced by co-investments, platforms and even direct investments sharing collaborative features.
2. The impressive “boom and bust” investment cycle in real estate surging until the record year 2015, when it reached about half of SWFs investments in private markets, and then sharply declining in the last three years.
3. The staggering growth of venture capital investments, with SWFs consistently increasing their allocation to tech companies and embracing innovation as an investment theme.
Our main findings about SWF deal making in private markets can be summarized as follows:
• A major shift occurred in SWF approach to private markets over the last decade. Funds gradually but consistently replaced direct solo investments with direct equity partnerships. Between 2009 and 2018 direct equity partnerships increased from 19 to 61 per cent of total deals, while solo collapsed from 69 to 21 per cent over the same period, revealing a complete change of strategy in the direct equity space • SWFs limited, albeit slightly, their investments as LPs from 11 to 7 per cent of total
deals, while increasing co-investments from virtually zero to 10 per cent between 2009 and 2018. In 2018, co-investments deals were worth $7.9bn, accounting for 22 per cent of total value
• With $12bn of total value since 2009, platforms represent an innovative investment model which gained ground especially in the 2012-2014, reaching a 3 per cent average share of deals in the last years
• The co-investment model represents a “soft landing” for SWFs into direct equity, and the numbers suggest that SWFs are testing with this model in earnest, in spite of inherent risks
• Real estate is the second largest asset class by SWF investment within the private markets bucket SWFs, with 342 deals worth in total $111bn. SWFs have turned away from investing in real estate funds and moved towards direct equity investments in this asset class, especially using the partnership model
• Technology has been the sector of choice for global SWFs in the second part of the last decade. SWFs flocked into this industry in earnest, executing 251 deals worth $37bn. SWFs’ entry into this space has not followed the conventional route of LP investments in VC funds, but rather new models of collaborative investments, namely direct equity partnerships and co-investments with the obvious exception of SoftBank’s Vision Fund, which needs a separate treatment.
• Investments in infrastructure have been quite limited, with a total of 75 deals in the 2009-2018 period, worth $27bn, of which almost 60 per cent executed in the last four years. The distribution of deal types in this asset class is completely skewed in favor of direct equity, with an equal split between solo and partnerships • When investing directly abroad, SWFs tend to evenly split deals between solo
investments and equity partnerships. At home, instead they have a much stronger preference for direct solo investments. This different behavior can be explained in terms of better access to information and investment opportunities in the local market 06 S O V E R E IG N W E A LT H FU N D S’ N E W S T R A T E G IE S I N P R IV A T E M A R K E T S
Bernardo Bortolotti
Director
Sovereign Investment Lab
Bocconi University
Alessandro Scortecci
Partner
Boston Consulting Group
• The majority of SWFs investments in private markets is concentrated in Europe, Asia Pacific, and North America, which together account for three quarters of total activity by deals and dollar value. Europe is particularly relevant in terms of value, reporting one third of the total, while Asia Pacific reports 31 per cent of deals, and North America about 18 per cent of both deals and value.
To conclude, SWFs’ journey in private markets is certainly not a linear process of disintermediation. Rather, it is a transition testing different models and adapting and optimizing investment strategies along the way. A visible trend is unfolding though, as the strategies adopted by SWFs are all consistent with getting a more direct exposure to private markets.
In the near term, we expect SWFs to take important decisions concerning their approach to direct private equity investments, and the multiple models identified in this report will still need a few years to prove their impact. This said we believe that, given SWFs significant and increasing value allocation to private markets in search of sustained returns, adopting a broad set of strategies, including the multiple models outlined in this paper, would allow them to diversify and reduce their risk exposure in such a relevant asset class.
Introduction
The step into alternative investment, that large pool of assets stretching
from private equity and venture capital to real estate and infrastructure,
has been one of the most discussed moves made by sovereign wealth
funds (henceforth SWFs) in recent years. Lured by higher and – in
some segments – safer yields, a wide range of SWFs tilted their asset
allocation away from fixed income towards illiquid investments in private
markets. The shift has been dramatic. SWFs have poured $168 billion
into alternatives since 2009, reaching a high in 2015 when they allocated
$27 billion. Today the average allocation to alternatives is 16% per cent,
equivalent to US$1.17 trillion of assets under management (Lopez, 2019).
If SWFs will maintain their current share of the overall industry (which is
about 13% per cent), their exposure to that asset class will approach $1.8
trillion in 2023, entailing more than $500 billion of additional investment
value over the next five years (Preqin, 2019).
From a sovereign asset management perspective, allocating a sizable part of the risk budget to private markets makes sense. Their long investment horizons enable them to put patient capital into early-stage, high-growth companies and to generate illiquidity premia over the risk-adjusted returns achieved in public markets. Furthermore, SWFs can trigger catalytic investment in projects with strong socio-economic impact crowding in private capital, and boosting socio-economic and social development and revenue diversification.
Developing a successful alternatives strategy is, therefore, key for SWFs’ overall performance. However, in practice, the implementation of an ambitious alternatives investing programme is a daunting challenge, with potentially disrupting implications on conventional business models. Indeed, SWFs have been often characterized as large pools of assets managed by third parties or institutions with small staff making big-ticket investments in global public equity markets with a broad diversification mandate. Opportunities in private equity market arise instead by early entry in small firms or projects with high growth potential. Access, capabilities, and timing are fundamental drivers of success in this space.
Traditionally, SWFs, like most institutional investors, started to build an alternative investment portfolio by committing capital to private-equity-style funds managed externally by general partners (GPs). However, SWFs have recently started questioning high management fees and the heterogeneity of fund performance and thus the validity of this conventional model of investment. As a result, SWFs have developed new ways to tap alternative assets through a combination of direct equity and collaborative investing.
Developing a successful alternatives
strategy is a daunting challenge, with
potentially disrupting implications on
conventional business models.
01
08 S O V E R E IG N W E A LT H FU N D S’ N E W S T R A T E G IE S I N P R IV A T E M A R K E T SAim of this report is to provide a comprehensive review of most recent trends in SWF investment in private markets. Based on new, transaction-specific information made available through an ad hoc data collection effort, the report first provides a rigorous classification of the main investment models and deal types observed in this market, and then tracks their evolution in the course of the last decade, from the great financial crisis to the end of 2018. The research identifies relevant regional and sector characteristics of SWF operations in alternatives, complementing the analysis with selective case studies of SWFs particularly exposed to these
asset classes. The main finding of our research is the recent, momentous rise of collaborative investment, hence the title of this publication. All major, global SWFs have progressively increased the resort to cooperative investment models and partnerships, following strategies broadly consistent with the recently observed trend of disintermediation of financial markets and surge in direct equity investment. We claim that the shift to a more cooperative approach observed in recent times is a functional response to mitigate the increased risk stemming from significant direct equity investment in unlisted, illiquid targets.
While we are observing a general trend across the SWF industry, initial conditions of individual funds obviously matter in the subsequent path towards disintermediation and direct equity investing. Some funds (e.g. Temasek, Mubadala) started with a local company portfolio which made it easier to leverage skills and invest directly. Smaller, emerging funds (e.g Fondo de Ahorro de Panama, Timor Leste Petroleum Fund) did not have the critical mass to embrace effectively these new investment models and stuck with conventional LP arrangements. Stabilization funds (such as Chile’s Economic and Social Stabilization Fund) instead are constrained by their mandate to maintain a risk profile incompatible with a significant allocation to private equity and alternatives. As it will be shown in the descriptive analysis, the evolution that we document in this report regards primarily large, savings funds with a long track record of investments. However, a penchant in favor of collaborative investing is developing amongst strategic investment funds and SWFs with a developmental focus, supporting the broad relevance of our conclusions.
SWF have progressively increased
the resort to cooperative investment
models following strategies consistent
with the recently observed trend of
disintermediation of financial markets
and surge in direct equity investment.
Delegation and co-operation:
towards a taxonomy of
investment models
As we mentioned earlier, typically SWFs as most global institutional investors have embraced alternatives using the conventional LP model depicted in Exhibit 1. The SWF commits a given amount of capital to a private equity fund managed by a professional GP, which is paid in as long as investment opportunities arise. The SWF as LP pays management fees and gets its share of profits over the life time of the fund, which is often spans several years.
The LP arrangement epitomizes the full delegation model of investment in private markets, with SWF playing the role of pure passive providers of capital. Direct equity investment, broadly defined as acquisition of stakes in target firms without any layer of external intermediation, lies at the other side of the spectrum, and is increasingly becoming common practice in the institutional investor sphere (Fang et al., 2015).
02
The LP arrangement epitomizes the
full delegation model of investment
in private markets, with SWF playing
the role of pure passive providers of
capital.
10 S O V E R E IG N W E A LT H FU N D S’ N E W S T R A T E G IE S I N P R IV A T E M A R K E T SExhibit 1 | Dealmaking in private markets
The LP model
GP
Fund
Investor (LP) Portfolio company (A)
SWF (LP) Portfolio company (B)
Investment platforms
GP (private or SWF)Fund
Investor SWF I SWF IIPortfolio company (A) Portfolio company (B)
The direct investment model
Investor Portfolio company (A)
SWF Portfolio company (B)
The co-investment model
GP
Fund
Investor (LP) Portfolio company (A)
SWF (LP) Portfolio company (B)
Source: Sovereign Investment Lab, Bocconi University
Direct equity investments come in different forms, with varying degree of direct exposure and delegation to third party managers. Among the many possible models, co-investments stick out as the closer to conventional LP, private equity arrangements. In this type of deals, the investor (limited partner or LP) co-invests alongside the GP in a given target, taking on slightly more risk in return for reduced fees. The benefits from co-investments stem from J-curve mitigation (i.e. making returns less negative in the early years before the portfolio of companies matures), more flexibility and control in portfolio construction, better ability to time the market and customize the risk exposures. Co-investments, however, also have downsides. The GP will invite a co-investor into larger deals, which tend to underperform (Lopez de Silanes et al., 2015). More importantly, the GP will often leave only a limited amount of time to undertake due diligence, which exposes the
co-investor to a classical adverse selection problem, with the poor performance of low-quality deals offsetting the reduced cost. Finally, SWF still rely almost entirely on the deal partner to drive value creation, limiting skill building and learning.
In spite of these potential risks, many SWFs have embraced co-investment strategies, but they have also sought to improve the model to benefit from
additional tactical benefits, such as building stronger relationships with managers, accumulating greater information about investments, and increasing their internal teams’ investment experience. From this perspective, co-investments represent an intermediary step into fully fledged direct equity investment, to carry out alone, or more significantly, in collaboration with partners.
Along this path towards enhanced cooperation, SWFs have recently teamed up with other sovereign investors or strategic partners to form investment platforms, namely funds or joint ventures operating with a specific focus or mandate. Platforms resemble LP arrangements in that they still involve a significant amount of delegation and intermediation by GPs. SWFs, however, are not any longer the passive players envisaged in the conventional LP model but the main joint lead/sponsor and anchor investors of the platforms.
Co-investments represent
an intermediary step into
fully fledged direct equity
investment, to carry out
alone, or more significantly,
in collaboration with
partners.
12 S O V E R E IG N W E A LT H FU N D S’ N E W S T R A T E G IE S I N P R IV A T E M A R K E T SThis broad definition of investment platform encompasses different fund structures and contractual arrangements. A first type of platform is the FDI Attraction Fund in which one or more SWFs commits capital to a closed-end fund investing in a given country, as a way to facilitate foreign direct investment. Notable, recent cases are the joint venture recently announced between the China Investment Corporation (CIC) and French bank-BNP Paribas with France private equity firm Eurazeo as asset manager and the China-US Industrial Cooperation Partnership sponsored by Goldman Sachs with CIC as anchor investor.
A second type is the G2G Investment Fund, promoted by two or more SWFs (or government controlled entities) with the aim to promote investments and bilateral commercial links. The many joint initiatives of the Russian Direct Investment Fund, Italian Cdp Equity’s joint venture with Qatar Investment Authority and Kuwait Investment Authority, and Ireland Strategic Investment Fund recently launched China-Ireland Technology Growth Fund fall in this category. While the main objective of FDI Attraction Funds is commercial return, the second type being strongly
promoted by incumbent governments are also a tool to foster economic diplomacy and bilateral cooperation along with investments.
A third and final type of platform is the Sectoral Investment Fund, in which one or more SWFs commit capital to invest in a specific sector often alongside a GP with specialized knowledge and expertise. The Vision Fund, the $100 billion platform focused on IT investment sponsored by Saudi Arabia’s Public Investment Fund (PIF) and managed by Japanese technology investor Softbank, is one of most prominent cases of these new arrangements.
The last stage in the evolution of SWFs’ approach to private markets is full-fledged, direct equity investing. In a direct solo investment, the SWF sources and executes the transactions on its own, bypassing the GP and thus pays no fees or carry. In a
direct investment partnership, the SWF co-invests with a strategic partner (such as a
venture fund, or infrastructure or real estate operator) or with other like-minded investors (other SWFs, pension funds or insurance companies), or a combination of both. Direct investment partnerships are thus genuine jointly sponsored deals. GIC and logistics provider GLP partnered together in 2014 to acquire IndCor, one of the largest industrial real estate providers in the US, for $8.1 billion from Blackstone. Khazahah and Temasek created a strategic joint-venture, M+S, to develop two substantial real estate projects in Singapore.
Our taxonomy, shown in Exhibit 2, is thus complete. In a quest to overcome the conventional LP model, SWFs can position themselves along a range of investment strategies in decreasing order of delegation to third-party managers as they move from pure co-investments to investment platforms and partnerships. The transition entails a learning process where SWFs adjust their capabilities and skill sets.
In the old world of private equity, SWFs’ main task as an LP was manager selection. In the game of direct equity investing, different competences are needed. An SWF’s internal staff must be trained and experienced in transaction related activities, including due diligence, operational and monitoring capabilities that are outside the traditional LP skill set. In sourcing the right team is a serious organizational challenge, entailing additional costs and new risks. That is why, as SWFs move away from full delegation models and embark on direct equity investment, they enhance cooperation to pool capabilities and skills with strategic investment partners. In this evolutionary process involving investment models, collaborative direct equity investing becomes a rational response to disintermediation.
In this evolutionary process involving investment
models, collaborative direct equity investing becomes a
rational response to disintermediation.
Exhibit 2 | Investment models in private markets
Cooperation
Low Moderate High
D
el
eg
at
io
n Low Direct Solo Investments Direct Investment partnerships
Moderate Co-investments
High LP model Investment platforms
Source: Sovereign Investment Lab, Bocconi University
14 S O V E R E IG N W E A LT H FU N D S’ N E W S T R A T E G IE S I N P R IV A T E M A R K E T S
SWF investments in private
markets
The main source of data published in this report is the SIL’s Global SWF Transactions Database, one of the most comprehensive sources of global sovereign equity
investment (see Appendix 1 for a detailed description). The database reports 2,895 transactions from 2000 to 2018, representing an aggregated deal value of over US883bn. In this analysis, due to limited data availability about less recent deals, we restrict the sample period to 2009-2018.
Since 2009, our data show that SWF poured into equity markets new investments worth $585bn. In fact, this figure excludes the allocation to equity that is typically carried out by third parties fund managers operating in public markets on behalf of SWF. Our data however are a good starting point to identify total investments in private markets given by the sum of direct equity investments in unlisted firms and “alternatives” as broadly defined in the introduction.
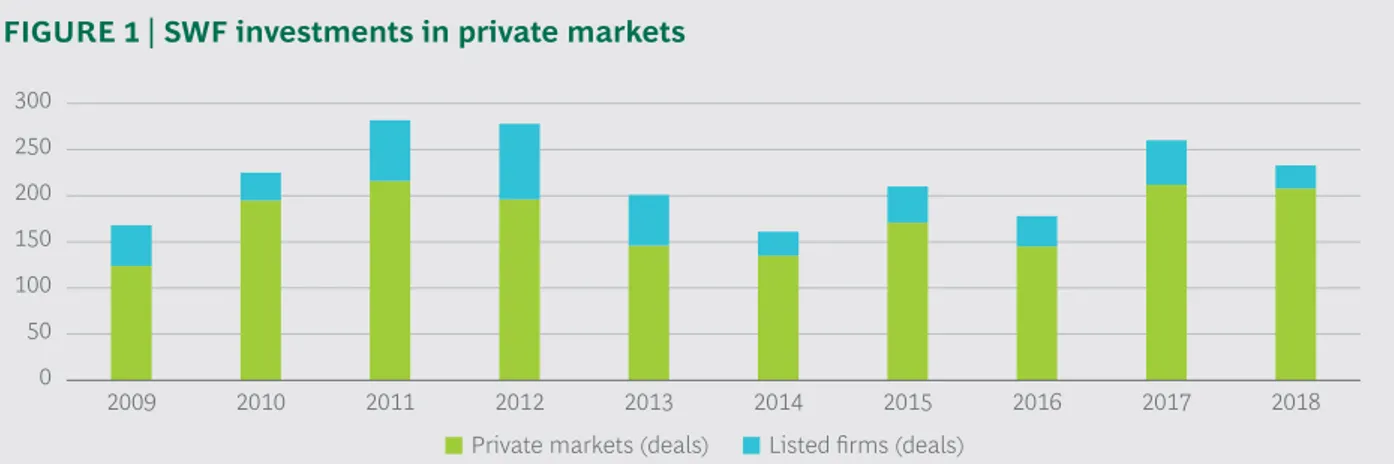
Historically, SWF have been investing heavily in private markets. The number of transactions reported in this category is 1.748 for a total deal value of $433bn. In the aftermath of the global financial crisis, however, the share of deals in this space has increased, rising from 73 per cent in 2009 to 89 per cent in 2018, reaching a peak in 2017 with 212 deals. Direct equity investments in listed firms in the second part of the decade declined, as a response to deep, structural changes taking place in global financial markets after the crisis.
By flooring interest rates, and purchasing unprecedented quantities of securities in the marketplace, all main central banks outcompeted one another in the
implementation of unconventional monetary policies, fueling an abnormal increase in equity prices and creating an ultra-low yields environment. In the last decade, the US S&P 500 stock index quadrupled in value, Japan’s Nikkei 225 would triple, followed closely by Hong Kong’s Hang Seng index. The subdued economic growth under the new normal combined with US corporate tax cuts induced companies to launch a large share buyback in order to boost returns, contributing to the equity boom. The elevated cost of capital in the financial market contributed to process that cut in half the number of publicly listed companies in the US, with significant decline in major developed markets. In the course of the last decade, public markets have become overtly expensive, less liquid, and more volatile. SWFs flocked with other like-minded financial institution into private markets, in a quest for better returns. FIGURE 1 | SWF investments in private markets
Private markets (deals) Listed firms (deals) 0 50 100 150 200 250 300 2009 2010 2011 2012 2013 2014 2015 2016 2017 2018
03
Source: Sovereign Investment Lab, Bocconi University
16 S O V E R E IG N W E A LT H FU N D S’ N E W S T R A T E G IE S I N P R IV A T E M A R K E T S
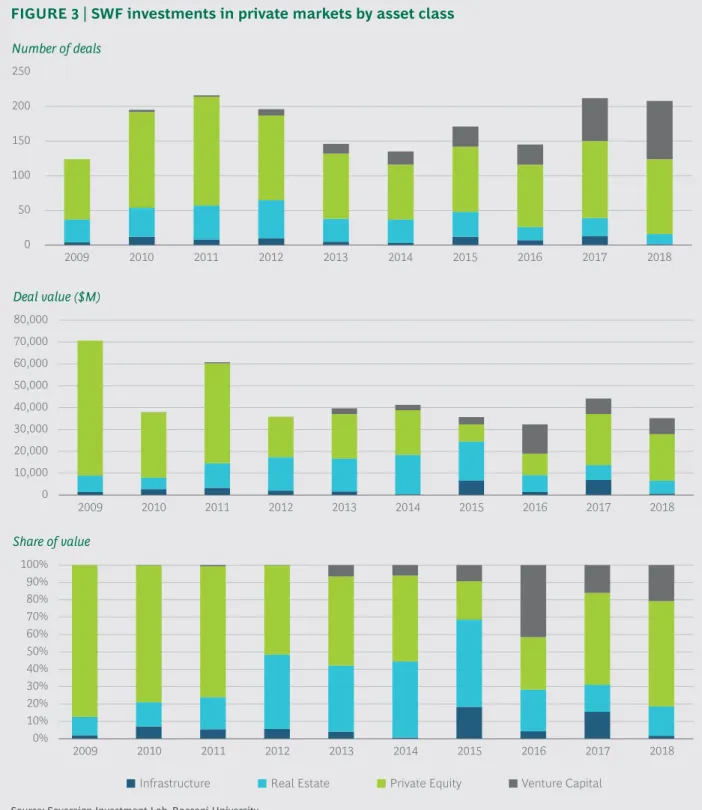
The distribution of private markets investments by asset class reveals that private equity (defined as the sum of direct investments in unlisted targets and private equity funds) gets the lion share with about 60 per cent of deals and investment value, followed by real estate in the 20-25 per cent range. Venture capital, broadly grouping investments at various stages in technological companies, ranges in total from 8 to 14 per cent by value and deals, respectively.
The aggregate data, however, mask some interesting dynamics taking place in the last decade in the individual asset classes. A first noteworthy trend is the impressive surge of investment value in real estate immediately after the crisis and until the record year 2015, when property attracted 50 per cent of total SWF investment in private markets. The real estate binge, however, came quite abruptly to a close as the sector remained almost completely under the radar screen in the last three years.
A second, related, fact is the staggering increase in venture capital investments. Since the mid of the sample period, SWF progressively and consistently increased the private market allocation to technology companies, fully embracing disruptive innovation as one of the main investment FIGURE 2 | SWF investments in private markets by asset class
Infrastructure Real Estate Private Equity Venture Capital
8% 6% 26% 14% 4% 20% 62% 60%
Share of value Share of deals
In the course of the last decade,
public markets have become overtly
expensive, less liquid, and more
volatile.
FIGURE 3 | SWF investments in private markets by asset class 0 10,000 20,000 30,000 40,000 50,000 60,000 70,000 80,000 2009 2010 2011 2012 2013 2014 2015 2016 2017 2018
Infrastructure Real Estate Private Equity Venture Capital
0% 10% 20% 30% 40% 50% 60% 70% 80% 90% 100% 2009 2010 2011 2012 2013 2014 2015 2016 2017 2018 Share of value Deal value ($M) Number of deals 0 50 100 150 200 250 2009 2010 2011 2012 2013 2014 2015 2016 2017 2018
themes. Venture capital investment, barely existing as an asset class SWFs’ portfolio at the beginning of the sample period, ended up to account for 40 per cent of
total deals.
Private equity to some extent retrenched during the real estate boom, but remained a solid pillar of private markets throughout the period. Infrastructure instead was kept underweight in SWF portfolio, even though a significant uptick is observed in the most recent years.
04
Source: Sovereign Investment Lab, Bocconi University
18 S O V E R E IG N W E A LT H FU N D S’ N E W S T R A T E G IE S I N P R IV A T E M A R K E T S
Applying the taxonomy:
deal types and trends in
investment models
Private markets have thus been gaining ground recently. In order to understand the details of this evolution, and how SWFs have approached this space, we apply the taxonomy of investment models developed in section 2.
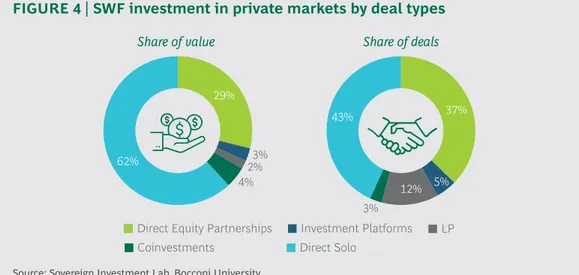
At the aggregate level, SWF have typically tapped private markets via solo direct equity investments and direct equity partnerships, accounting for about a 43 and 37 percent of deals, respectively. Conventional LP investments are found in 12 per cent of cases, while co-investments and platforms are marginal, accounting in total for about 7 per cent. The breakdown of dollar values shows a consistent picture, with the two main categories (solo and direct equity partnerships) getting a 91 per cent share of total investment. As to LP investment, however, a caveat is in order. As already mentioned in the data description, our source identifies SWF’s investments as LP but in several cases does not report the actual commitment, so as a consequence our analysis of deal value will underestimate the relevance of SWF investment in private equity funds. In what follows, therefore, more emphasis will be placed on activity in term of number of deals.
FIGURE 4 | SWF investment in private markets by deal types
Direct Equity Partnerships Investment Platforms LP
Direct Solo Coinvestments 29% 37% 3% 3% 5% 12% 43% 2% 4% 62%
Share of value Share of deals
The evolution over time in the distribution of deal types reveals that a major shift occurred in SWF approach to private markets over the last decade. Funds gradually but consistently replaced direct solo investments with direct equity partnerships and the outcome is quite striking. The snapshots taken in 2009 and 2018 show that the shares of these two deal types almost flipped: direct equity
partnerships increased from 19 to 61 per cent of total deals, while solo collapsed from 69 to 21 per cent over the same period, revealing a complete change of strategy in the direct equity space.
04
The evolution over time in
the distribution of deal types
reveals that funds gradually
but consistently replaced
direct solo investments with
direct equity partnerships.
Source: Sovereign Investment Lab, Bocconi University
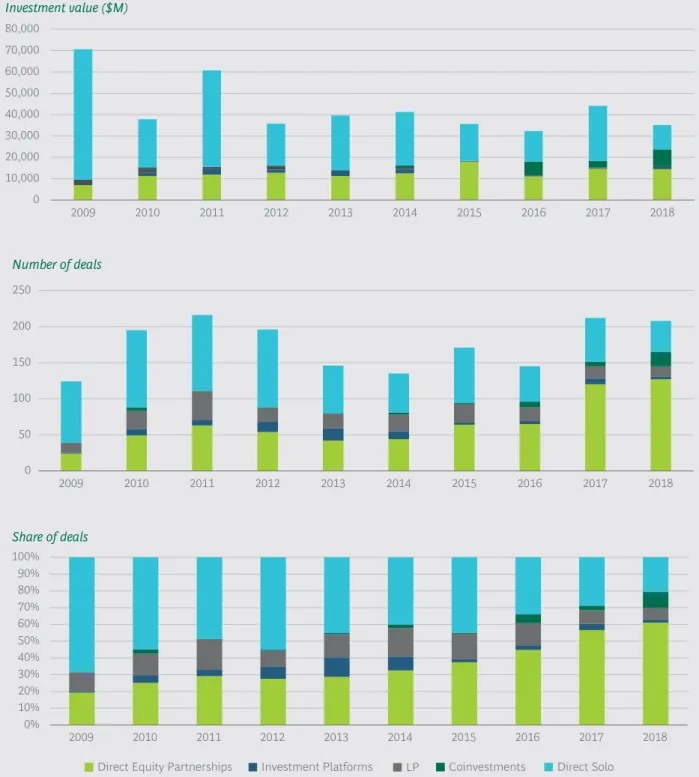
FIGURE 5 | The evolution of SWF investment in private markets by type
Direct Equity Partnerships Investment Platforms LP Coinvestments Direct Solo
0% 10% 20% 30% 40% 50% 60% 70% 80% 90% 100% 2009 2010 2011 2012 2013 2014 2015 2016 2017 2018 Share of deals 0 10,000 20,000 30,000 40,000 50,000 60,000 70,000 80,000 2009 2010 2011 2012 2013 2014 2015 2016 2017 2018 Investment value ($M) Number of deals 0 50 100 150 200 250 2009 2010 2011 2012 2013 2014 2015 2016 2017 2018
The data on LP and co-investments are also interesting. In the sample period, SWFs limited, albeit slightly, their investments as LPs from 11 to 7 per cent of total deals, while increasing co-investments from virtually zero to 10 per cent. Our readers would recall that amongst the collaborative models, co-investments entail a significant delegation to GP in deal origination and execution and as such are the “closer” model to conventional LP investing. Our data therefore suggest that the overall share of deals with private equity funds remained broadly constant overtime, but co-investments gained an increasing market share. With $12bn of total value since 2009, platforms represent an innovative investment model which gained ground especially in the 2012-2014, reaching a 3 per cent average share of deals in the last years.
Source: Sovereign Investment Lab, Bocconi University
20 S O V E R E IG N W E A LT H FU N D S’ N E W S T R A T E G IE S I N P R IV A T E M A R K E T S
The data on investment values are broadly consistent with the number of deals and support a first important conclusion. Collaborative investing, particularly in the form of direct equity partnership, is the new, emerging investment pattern on SWF operations in private markets, accounting in 2018 for a staggering 79 and 68 per cent of total deals and value, respectively.
While we observe a significant resilience of conventional private equity models, the reported investments values suggest that SWF have shown in the last three years a commitment to test the co-investment model as an alternative, maybe less expensive entry into private markets. In 2018, co-investments deals are worth for $7.9bn, accounting for 22 per cent of total value.
Our analysis of investment models in private market suggests that SWFs increased their exposure to direct equity investment with a twist: sharing risks and benefits with partners. It may be again useful to put this fact into the broader perspective of the post-crisis financial system. Forced by regulation and market pressure, since 2009 the banking industry has embarked in a deep deleveraging process, increasing capital cushions and cleaning up balance sheets. Global systemically important banks have been thus pulled down from excessive short-term risk taking and pushed into safer grounds. As El Erian (2016) pointed out, this process did not eliminate systemic risk. Rather, it just morphed and migrated out of banks into other sectors of the financial industry. A structural outcome of this mass migration of risk is the shrinking role of conventional, broker-dealer bank sponsored, intermediation and the increasing role of non-bank end users of capital, including pension funds, insurers, and SWFs. The shift towards direct equity that we have observed among is thus part and parcel of a wider, structural change in the global financial system, with far reaching implications for SWFs and institutional investors alike.
The overall share of deals with
private equity funds remained
broadly constant overtime,
but co-investments gained an
increasing market share.
Disentangling private markets:
deal types by asset class
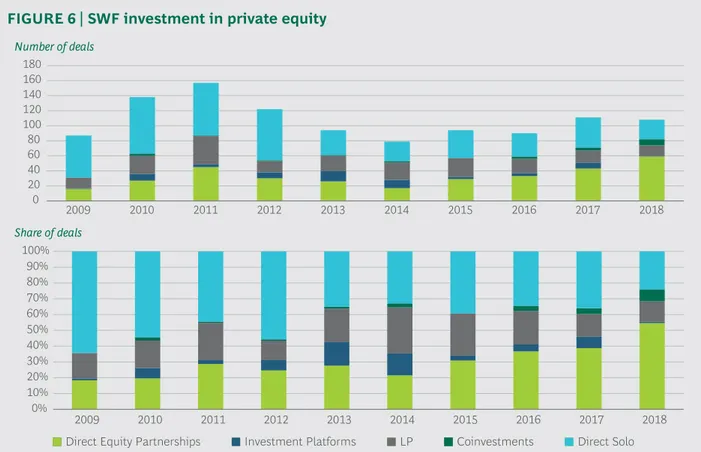
With more than a quarter of trillion of investments, private equity is the most significant asset class within alternatives, or private markets portfolio of SWFs. In this bucket, our data on activity based on deals show a remarkable transition in direct equity investment from solo to partnerships. Solo investment accounted for a staggering two thirds of deals in 2009, and progressively reduced to about one fourth in the last year. Conversely, the share of direct equity partnerships tripled in the sample period, reaching a stellar 55 per cent in 2018. Indeed, a total value of $14bn was poured into these partnerships in 2018, becoming by far the most popular SWF investment model in private equity. The conventional LP model gained relevance in the early years of the sample, but progressively lost market shares since 2014. In 2018, investments in private equity funds accounted only for 13 per cent of total deals. The data shows a clear trend of rising co-investments in private equity. SWFs have progressively embraced this new investment model, which has reached a 7 per center share of total deals over the last years. The dollar values of these deals have to be taken with some grain of salt, but in 2018 co-investments have been reported at a staggering 22 per cent of the total $7.9bn. As we mentioned already, the co-investment model represents a “soft landing” into direct equity, and the numbers suggest that SWFs are testing with this model in earnest, in spite of its inherent risks. SWFs have also been wary to continue sponsoring investment platforms in the private equity space, after the experiments carried out in 2014 and 2015, when they accounted for 15 per cent of activity by deals.
FIGURE 6 | SWF investment in private equity
0 20 40 60 80 100 120 140 160 180 2009 2010 2011 2012 2013 2014 2015 2016 2017 2018
Direct Equity Partnerships Investment Platforms LP Coinvestments Direct Solo 0% 10% 20% 30% 40% 50% 60% 70% 80% 90% 100% 2009 2010 2011 2012 2013 2014 2015 2016 2017 2018 Number of deals Share of deals
05
Source: Sovereign Investment Lab, Bocconi University
22 S O V E R E IG N W E A LT H FU N D S’ N E W S T R A T E G IE S I N P R IV A T E M A R K E T S
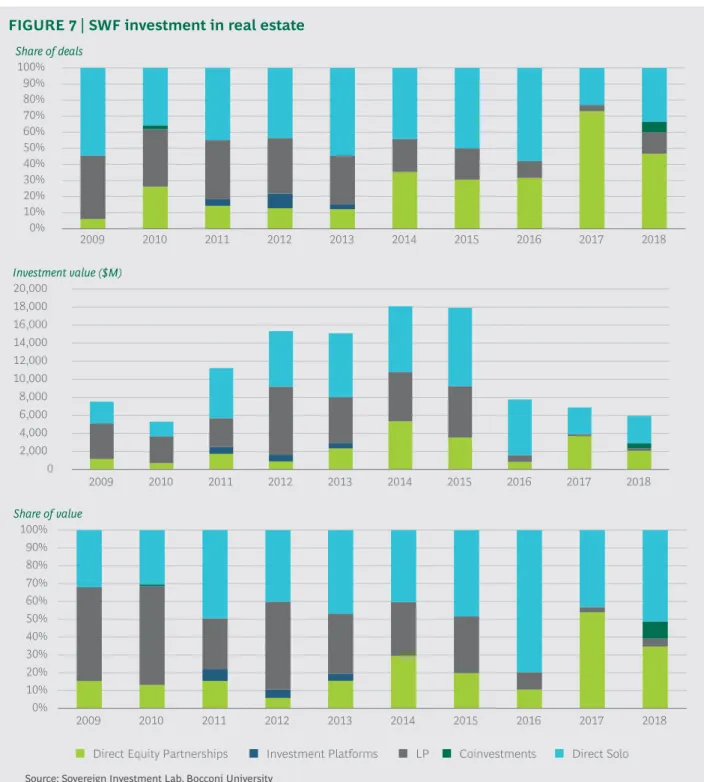
With 342 deals worth in total $111bn, real estate is the second largest asset class by SWF investment within the private markets bucket. The most interesting trend surfacing in this industry is the complete exit from the conventional LP models. Apparently, SWFs of all stripes have turned away from investing in real estate funds and moved towards direct equity investments in this asset class, especially using the partnership model. While right after the financial crisis property funds were capturing more than 50 per cent of investment value and about 40 per cent of deals, last year investments via real estate asset managers shrunk to only 5 per cent in value. In combination with a significant contraction of investment flows in the sector we are thus observing to a greater extent than in other private markets a full-fledged disintermediation processes, with SWFs dumping LP models in favor of direct equity investments both in terms of solo and, more recently, of partnerships with like-minded investors or specialized property operators. Co-investments do not appear a suitable investment model in this space, and the same holds for platforms that, in spite of a limited surge in activities in 2012-13, never really took off.
FIGURE 7 | SWF investment in real estate Share of deals Investment value ($M) Share of value 0% 10% 20% 30% 40% 50% 60% 70% 80% 90% 100% 2009 2010 2011 2012 2013 2014 2015 2016 2017 2018 0 2,000 4,000 6,000 8,000 10,000 12,000 14,000 16,000 18,000 20,000 2009 2010 2011 2012 2013 2014 2015 2016 2017 2018 0% 10% 20% 30% 40% 50% 60% 70% 80% 90% 100% 2009 2010 2011 2012 2013 2014 2015 2016 2017 2018
Direct Equity Partnerships Investment Platforms LP Coinvestments Direct Solo
Source: Sovereign Investment Lab, Bocconi University
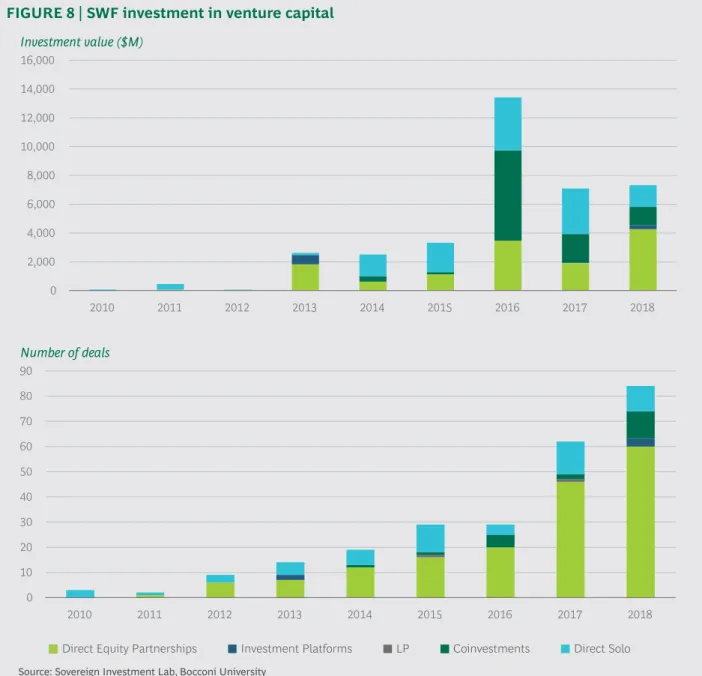
As widely recognized, technology has been the sector of choice for global SWFs in the second part of the last decade. SWFs flocked into this industry in earnest, executing 251 deals worth $37bn. As figure 6 shows, the pace of acceleration has been
impressive, turning sovereign investors into venture capitalist in a span of only a few years. Interestingly, SWFs’ entry into this space has not followed the conventional route of LP investments in VC funds, but rather resorting to the new models of collaborative investments, namely direct equity partnerships and co-investments. Indeed, these two deal types account for 66 and 36 per cent of total deals and value in technology respectively, with an increasing share throughout the period. According to our data, venture capital is the asset class within private markets where the investment model has been more seriously tested. The average ticket size of co-investments has been well above the $500ml threshold and in total are worth $10bn, with a strong concentration in the last three years. As in real estate, investment platforms has not been widely used. However, the picture would be completely different if we included the Vision Fund, the $100bn investment platform sponsored by Saudi’s PIF and managed by Masayoshi Son’s Softbank. As explained in the below sidebar, there are good reasons to analyze it separately.
FIGURE 8 | SWF investment in venture capital
Direct Equity Partnerships Investment Platforms LP Coinvestments Direct Solo
0 2,000 4,000 6,000 8,000 10,000 12,000 14,000 16,000 2010 2011 2012 2013 2014 2015 2016 2017 2018 0 10 20 30 40 50 60 70 80 90 2010 2011 2012 2013 2014 2015 2016 2017 2018 Investment value ($M) Number of deals
Source: Sovereign Investment Lab, Bocconi University
24 S O V E R E IG N W E A LT H FU N D S’ N E W S T R A T E G IE S I N P R IV A T E M A R K E T S
UNDERSTANDING SOFTBANK’S VISION FUND
The largest VC/tech fund ever raised,Softbank Vision Fund was established by Softbank Group, with a focus on providing large-scale, long-term investments in next-gen innovating companies and platform
businesses. Target investments mainly include growth-stage companies in tech, including IoT, AI, robotics, etc., with an investment period limited to five years, and a fund’s lifecycle expected to last about 12 years.
With its $100bn capital, starting in 2018 the Vision Fund has dramatically changed the global dynamics of investing in technology, giving access to a handful of large global investors to unique large-scale tech deals and opportunities. At the same time, the Fund has given its LPs the opportunity to invest
significantly large amounts of capital in a relatively difficult asset class and within a very short timeframe; this is particularly
remarkable given the market conditions and the pressure to generate high returns. Main LPs include Public Investment Fund of Saudi Arabia ($45bn), Softbank Group Corp.
($28bn), Mubadala ($15bn), and Apple ($1bn). Despite its uniquely large scale and the relatively short time span, the Vision Fund has already deployed around 70% of its capital, actively investing across Asia, Americas and EMEA, with a total of 77
investments in 65 companies completed until today. The majority of investments completed so far have focused on VC financing across different stages of maturity, with 56 VC investments out of the 77 in total completed (the remainder primarily across growth, corporate and secondary).
While providing a unique opportunity to gain exposure to tech investments through the LP/ GP relationship, the Fund has also proven to be a strong platform for LPs to co-invest alongside SoftBank, effectively doubling-down on attractive investment opportunities while leveraging SoftBank’s sector expertise and access. In fact, 58 out of the 77 deals completed so far by the Vision Fund have multiple investors, mostly with SoftBank in the lead. An interesting example of this is the 2018 investment in ParkJockey, a parking technology solutions provider, that secured funding from the SoftBank Group. Later the same year, ParkJockey and Mubadala have partnered to acquire Atlanta-based Citizens Parking Inc, and have agreed to acquire Imperial Parking Corporation (deal expected to close in the first half of 2019). This
approach has given Mubadala the opportunity to further deploy capital, building on
SoftBank’s pipeline and access, while reducing risk exposure through SoftBank’s sector expertise.
CASE STUDY
1
$30B $20B $10B 0 11% 2018 2017 13% 45% 9% 33% 5% 53% 27% 2019 YTD 7% 24% 45% 24% $15B $25B $22B PE Secondary TransactionEarly Stage VC Later Stage VC PE Growth/Expansion Other
Softbank Vision Fund: Investment analysis
Source: Sovereign Investment Lab, Bocconi University
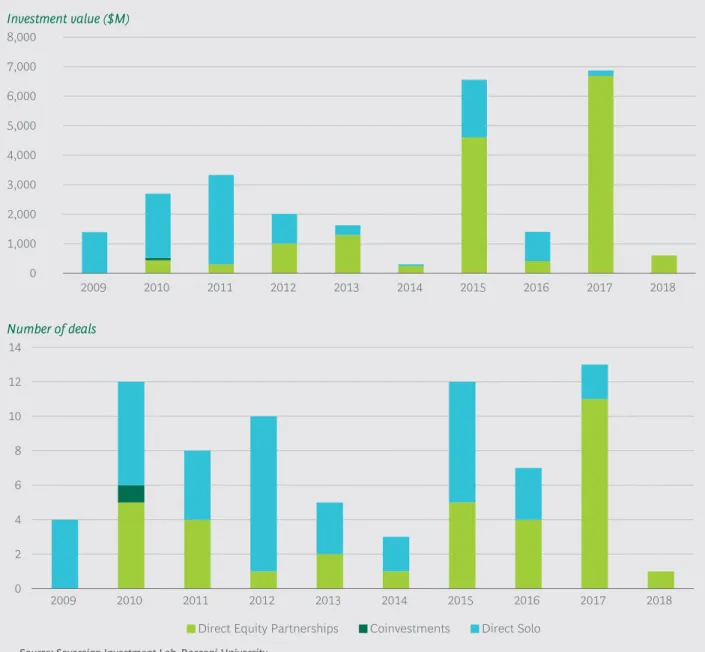
FIGURE 9 | SWF investment in infrastructure 0 1,000 2,000 3,000 4,000 5,000 6,000 7,000 8,000 2009 2010 2011 2012 2013 2014 2015 2016 2017 2018
Direct Equity Partnerships Coinvestments Direct Solo
0 2 4 6 8 10 12 14 2009 2010 2011 2012 2013 2014 2015 2016 2017 2018 Investment value ($M) Number of deals
With high risk-adjusted yields, underlying physical assets, and sizable economic spillovers, infrastructure fits nicely with the investment preferences of SWFs. In practice, however, the total investment in this sector has been quite limited, even it is gaining momentum in the last years. We report in total 75 deals worth $27bn, of which almost 60 per cent executed in the last four years. The distribution of deal types in this asset class is completely skewed in favor of direct equity, with an equal split between solo and partnerships, which as in many other private markets, have become the prevailing model for SWF to approaching private markets.
Source: Sovereign Investment Lab, Bocconi University
26 S O V E R E IG N W E A LT H FU N D S’ N E W S T R A T E G IE S I N P R IV A T E M A R K E T S
The geography of private
markets
A first, broad distinction to be made when analyzing the geographical pattern of SWF investments in private markets is between domestic and international deals. Indeed, these two categories of operations are carried out with different objectives, with foreign investment primarily aimed at portfolio diversification and financial returns, while investment at home often focused to support the local economy in bad times or to boost long-term investment and socio-economic development.
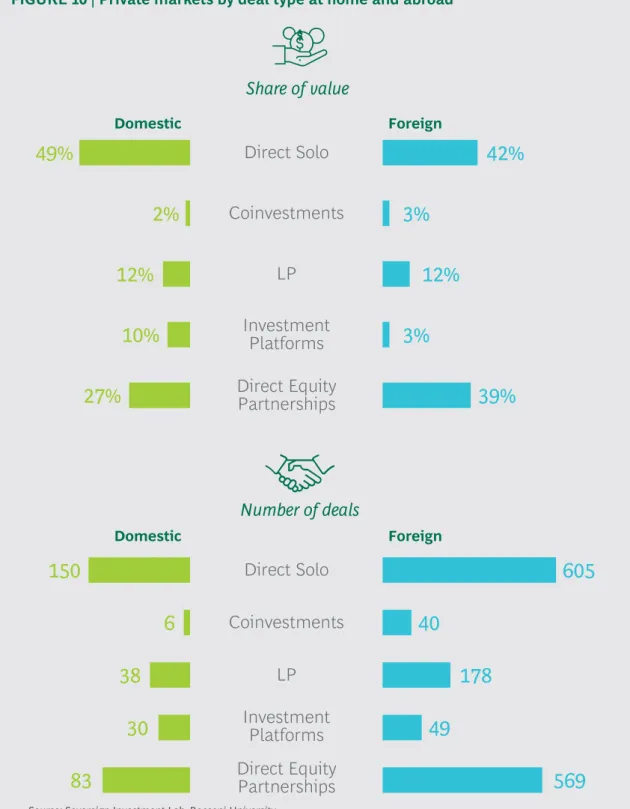
In private markets as in other asset class, foreign deals are largely predominant and account for 80 per cent of total transactions and for 79 per cent of reported deal value. The international profile of investments seems however to matter also in terms of the investment model chosen. Indeed, when investing directly abroad, SWFs tend to evenly split deals between solo and equity partnerships. At home, instead they have a much stronger preference to direct solo investments. This different behavior can be explained in terms of better access to information and investment opportunities in the local market, so that SWFs can more easily source and execute deals at home. Direct equity partnership instead are more valuable in distant markets, where the collaboration with an experienced partner can mitigate adverse selection and boost returns.
In what follows, we try to look in more detail where SWFs are investing when they seek opportunities in private markets. First, the bulk of investments is concentrated in three main regions, namely Europe, Pacific Asia, and North America, accounting for three quarters of total activity by deals and dollar value. Europe is particularly relevant in terms of value, reporting one third of the total, while Pacific Asia reports 31 per cent of deals. North America attracts around 18 per cent of private market investments by both measures of activity. Private markets in other regions are
under the radar screen of SWFs, with the exception of Non Pacific Asia and MENA, surpassing albeit slightly the 10 per cent share in term of deals and value, respectively. The regional distribution over time looks quite stable, even if we report some recent uptick in favor of Pacific Asia over the last three years. In the same period, Europe has gained ground in terms of investment value, while North America in terms of transactions.
06
When investing directly abroad,
SWFs tend to evenly split
deals between solo and equity
partnerships. At home, instead
they have a much stronger
preference to direct solo
investments.
FIGURE 10 | Private markets by deal type at home and abroad
Against this backdrop, the geography of private markets is certainly interesting to put our deal type analysis in perspective. The aggregate data suggest that even when investing in different destinations, SWF typically chose direct equity rather than resorting to financial intermediaries as private equity funds. The regional comparison, however, highlights significant differences in the use of collaborative investment models such as direct equity partnerships. This deal type is much more frequently found in Asia (both Pacific and Non-Pacific) and North America, where it accounts for more than 40 per cent of overall transactions. Latin America and the MENA region instead tend to favor direct equity solo. Quite systematic differences surface when regions are compared according to the relevance of the conventional, intermediated LP model. In this space, the three main destinations by value of SWF investments, namely Europe, Asia Pacific, and North America are in stark contrast
Direct Solo
49%
42%
Direct Solo
150
605
Direct Equity
Partnerships
83
569
Coinvestments
6
40
LP
38
178
Investment
Platforms
30
49
Direct Equity
Partnerships
27%
39%
Coinvestments
2%
3%
LP
12%
12%
Investment
Platforms
10%
3%
Share of value
Foreign Domestic Foreign DomesticNumber of deals
Source: Sovereign Investment Lab, Bocconi University
28 S O V E R E IG N W E A LT H FU N D S’ N E W S T R A T E G IE S I N P R IV A T E M A R K E T S
with the rest, displaying a share of LP deals well above 10 per cent, with Europe well above 20 per cent. The data on the regional distribution of investments by value are broadly consistent with this picture, even if they enhanced the economic relevance of co-investments in some regions such as Asia Pacific, Europe and the US.
FIGURE 11 | SWF investment in private markets by regions
0 10,000 20,000 30,000 40,000 50,000 60,000 70,000 80,000 2009 2010 2011 2012 2013 2014 2015 2016 2017 2018
Asia-Pacific Europe Latin America MENA Non-Pacific Asia North America Sub-Saharan Africa
Investment value ($M)
Source: Sovereign Investment Lab, Bocconi University
FIGURE 12 | Private markets deal types by regions
Direct Equity Partnerships Investment Platforms LP Coinvestments Direct Solo
0% 10% 20% 30% 40% 50% 60% 70% 80% 90% 100%
Asia-Pacific Europe Latin America MENA Non-Pacific Asia North America Sub-Saharan
Africa
Asia-Pacific Europe Latin America MENA Non-Pacific Asia North America Sub-Saharan
Africa 0% 10% 20% 30% 40% 50% 60% 70% 80% 90% 100% Share of value Share of deals
Source: Sovereign Investment Lab, Bocconi University
Previous sections of this report have clearly shown that dramatic transition are underway in SWF approach to private markets. It is thus interesting to look at the evolution of investment models within the main target regions, possibly identifying commonalities and differences across destinations, starting from Asia Pacific. In this region, the data show a stark decline of direct equity investment in favor of partnerships, which have become the predominant deal type in the last years. After a robust growth at the beginning of the period, SWFs have instead lost appetite in conventional private equity funds, while testing in earnest the co-investment model. Indeed, this new deal type has progressively increased its market share in the last years, reaching a total of $4.1bn of investment value in 2017-18.
We now turn to the second largest target region, Europe. Broadly speaking, the reported trends are the same as in Asia, but the rate of change is different. Indeed, FIGURE 13 | SWF investment in private markets in Asia Pacific
Investment Platforms LP Direct Solo
0 5,000 10,000 15,000 20,000 25,000 30,000 2009 2010 2011 2012 2013 2014 2015 2016 2017 2018 0% 10% 20% 30% 40% 50% 60% 70% 80% 90% 100% 2009 2010 2011 2012 2013 2014 2015 2016 2017 2018 0% 10% 20% 30% 40% 50% 60% 70% 80% 90% 100% 2009 2010 2011 2012 2013 2014 2015 2016 2017 2018
Direct Equity Partnerships Coinvestments
Investment value ($M)
Share of value
Share of deals
Source: Sovereign Investment Lab, Bocconi University
30 S O V E R E IG N W E A LT H FU N D S’ N E W S T R A T E G IE S I N P R IV A T E M A R K E T S
direct equity has been overcome by the quite impressive growth of partnerships. Yet, the former deal type, especially when measured in dollar terms, has remained a solid pillar in private markets also in the most recent years, while it lost ground in Asia. Similarly, the LP model, which grew spectacularly at the beginning of the decade contracted quite severely in the last years. The same marked increasing trend of co-investments is also observed in Europe, but here their growth has been even more spectacular, accounting for a staggering 40 per cent of total investment value. The end points of these different temporal patters is not dramatically different between Asia and Europe, with one important exception. European private markets have remained accessible via solo direct equity. Successful entry in Asia requires instead either professional managers or knowledgeable strategic partners. FIGURE 14 | SWF investment in private markets in Europe
Direct Equity Partnerships Investment Platforms LP Coinvestments Direct Solo
0 5,000 10,000 15,000 20,000 25,000 30,000 2009 2010 2011 2012 2013 2014 2015 2016 2017 2018 0% 10% 20% 30% 40% 50% 60% 70% 80% 90% 100% 2009 2010 2011 2012 2013 2014 2015 2016 2017 2018 0% 10% 20% 30% 40% 50% 60% 70% 80% 90% 100% 2009 2010 2011 2012 2013 2014 2015 2016 2017 2018 Investment value ($M) Share of value Share of deals
Source: Sovereign Investment Lab, Bocconi University
A regional analysis would not be complete without North America, home of the largest target country of SWF investments, the United States. The evolution of the investment patterns in the region has been to some extent similar to Asia. The rise of direct equity partnership has been staggering across the Pacific as well, while the contraction of LP deals much more pronounced. SWFs investing in this region have been more wary to embrace the co-investment model.
As already noticed, SWF investments in private markets in the other macro-regions have been quite marginal over the last decade. Unreported data shows however that in Non-Pacific Asia the partnership model gained ground as in the other regions,
FIGURE 15 | SWF investment in private markets in North America
Direct Equity Partnerships Investment Platforms LP Coinvestments Direct Solo
0 2,000 4,000 6,000 8,000 10,000 12,000 14,000 16,000 2009 2010 2011 2012 2013 2014 2015 2016 2017 2018 0% 10% 20% 30% 40% 50% 60% 70% 80% 90% 100% 2009 2010 2011 2012 2013 2014 2015 2016 2017 2018 0% 10% 20% 30% 40% 50% 60% 70% 80% 90% 100% 2009 2010 2011 2012 2013 2014 2015 2016 2017 2018 Investment value ($M) Share of value Share of deals
Source: Sovereign Investment Lab, Bocconi University
32 S O V E R E IG N W E A LT H FU N D S’ N E W S T R A T E G IE S I N P R IV A T E M A R K E T S
while in Latin America, MENA and South Saharan Africa solo investments are the default deal type.
Finally, we take the perspective from home countries and try to understand how SWF from specific regions are approaching private markets. As a preliminary analysis, we break SWF investments by region of investing entity to understand their relevance as a source of funds. In terms of deals in private markets, Asia dwarfs all other regions, accounting for 62 per cent, followed by MENA reporting a share of 33 per cent. The third region by deals, Europe, reports only a small 5 per cent. The data on deal value provide a more nuanced picture, with exactly a half of investments originating from Asia, and the MENA share rising significantly to 42 per cent.
These data are certainly not surprising and reflect the widely recognized relevance of SWFs established in trade surplus countries such as China and Singapore and in the resource rich nations of the Gulf. More interesting, from our point of view, is the evolution over time of the relative positions of these two economic blocs.
Figure 17 highlights a dramatic change in the share of SWF investment value from Asia, from 22 per cent in 2009 to a staggering 71 per cent in 2019, with percentages for MENA regions flipping over the same period. The new “age of plenty” in
commodities market which brought down oil prices since 2013 had redistributive effects between exporting and importing nations, and different implications for commodity as opposed to surplus, non-commodity SWFs. While low prices strain the fiscal position of exporters and their growth prospects, they lower energy costs
for countries that are net importers, strengthening the competitive position. One would expect a boost in exports for large energy consumers especially amongst emerging countries, leading to significant accumulation of reserves, while an opposite trend should be observed in resource rich countries, forced to tap sovereign assets to support their battered economies.
In spite of their diversity in term
of volume of activity in private
markets, the distribution of deal
types among the key regions is
remarkably similar.
FIGURE 16 | SWF investments in private markets by home region
Direct Equity Partnerships Investment Platforms LP Coinvestments Direct Solo
0 50,000 100,000 150,000 200,000 250,000
Asia MENA Europe 0%
20% 40% 60% 80% 100%
Asia MENA Europe
0 200 400 600 800 1,000 1,200
Asia MENA Europe 0%
20% 40% 60% 80% 100%
Asia MENA Europe
Investment value ($M)
Deals Share of deals
Share of value
Source: Sovereign Investment Lab, Bocconi University
In spite of their diversity in term of volume of activity in private markets, the distribution of deal types among the key regions is remarkably similar. Direct equity partnerships are reported in the range of 40 per cent across all regions, and very similar figures (around 20 per cent) are found in Asia and Europe for the share of conventional LP deals. MENA funds stick out in terms of the preference afforded to direct solo investments, accounting for more than a half of deals. Interestingly, co-investments have been almost entirely developed by Asian funds, and never seriously tested by funds from other geographies. The same holds for platforms, which originated almost exclusively in Asia.
Dollar value data provide a quite consistent picture for Asia, amplifying the
economic relevance of the $17bn co-investments in the region, accounting for 8 per cent of total investments. MENA SWFs’ strong penchant towards direct equity is confirmed. The limited investments carried out by European SWFs display a quite different deal type distribution by value, suggesting solo direct equity as the most widely used investment model.
As usual, the data about the evolution over time of deal type preferences reveal interesting facts also within individual regions. Quite strikingly, in spite of two completely diverging trends of overall investment in private markets, with Asia picking up strongly in the last years, and MENA retrenching, the distribution over time among investment models is very similar, suggesting that neither geography, nor macroeconomic outlook matter much in explaining how deal making in private markets evolved in recent times. Structural factors have changed the industry and steadily shifting incentives in favor of collaborative investment models predominantly in the form of direct equity partnerships and against solo and conventional LP models. On a similar vein, co-investments have gained ground recently in the two most important regions for global SWF investment. Any clearly discernible pattern is instead visible in the SWF deals originating from Europe, maybe due to the scant activity also reflected in our data.
FIGURE 17 | SWF investments in private markets by home region
0% 10% 20% 30% 40% 50% 60% 70% 80% 90% 100% 2009 2010 2011 2012 2013 2014 2015 2016 2017 2018
Asia MENA Europe
Share of value
Source: Sovereign Investment Lab, Bocconi University
34 S O V E R E IG N W E A LT H FU N D S’ N E W S T R A T E G IE S I N P R IV A T E M A R K E T S
FIGURE 18 | Investments in private markets
Source: Sovereign Investment Lab, Bocconi University 0% 10% 20% 30% 40% 50% 60% 70% 80% 90% 100% 2009 2010 2011 2012 2013 2014 2015 2016 2017 2018 0% 10% 20% 30% 40% 50% 60% 70% 80% 90% 100% 2009 2010 2011 2012 2013 2014 2015 2016 2017 2018
Direct Equity Partnerships Investment Platforms LP Coinvestments Direct Solo
Asian SWFs
MENA SWFs
36 S O V E R E IG N W E A LT H FU N D S’ N E W S T R A T E G IE S I N P R IV A T E M A R K E T S
Sectoral analysis
The breakdown by sector reveals some interesting patterns of SWF investment in private markets. Probably one of the most striking fact is the whopping concentration in the financial sector and in real estate, accounting for about a half of overall deal activity. The financial industry gets a share of 27 and 19 per cent of deals and value, respectively, while the property market gains more relevance measured by dollar value of investment, boasting a share of 23 per cent raised in $101bn worth of deals. Average ticket size consistently show that deals in real estate tend to be much larger than in the financial sector. Banks have been historically a target of choice for SWF. The relevance of financial sector in our data on private markets, however, can also be enhanced by the classification of SWF operations in private equity funds into this bucket, independent of the actual sectoral destination of investments.
The other main target is the transport sector, accounting for 5 per cent of deals and 11 per cent of investment value. One quarter of investment value (slightly less by deal) is evenly split in four sectors, namely personal and business services, infrastructure, chemicals and oil&gas. Out of these main sectors, SWF investment activity looks widely diversified, with all other sectors well below the 2 per cent threshold of investment value.
But how did the sectoral allocation in private markets change over the last decade? Again, our yearly data reveal that a seismic change unfolded throughout the period. The overall equity investment activity measured both in deal counts and dollar value highlights the unfolding of three distinct, albeit related, trends: the lost SWFs’ appetite for the financial industry, the real estate binge in the first half the decade, and the amazing rise in personal and business services. Taking into account that this label flags the lion share of SWF investments carried out in the technology sector, we can conclude that a major shift has occurred in SWF private markets in favor of disruptive technology, venture capital deals as already documented in our analysis by asset classes. While in the 2009-2018 period the share of investments in banks fell from 32 to 10 per cent, services grew from 4 to 38 per cent, hitting the record of $17.6bn in 2016. SWF investment in property boomed initially, and then progressively declined, even if in the last year with $8.4bn it remained the sector of choice.
07
FIGURE 19 | SWF investments in private markets by target sector Real Estate
Banking, Insurance, Trading Transportation
Personal & Business Services
Chemicals
Petroleum & Natural Gas Infrastructure & Utilities
Other
Banking, Insurance, Trading Real Estate
Personal & Business Services Transportation
Infrastructure & Utilities
Petroleum & Natural Gas Other
Restaurants, Hotels, Motels
Share of value Share of deals
4% 23% 19% 12% 9% 7% 6% 20% 28% 17% 16% 5% 4% 4% 3% 23%
Source: Sovereign Investment Lab, Bocconi University