Alma Mater Studiorum – Università di Bologna
DOTTORATO DI RICERCA IN
Scienze Ambientali: Tutela e Gestione Delle Risorse
Naturali
Ciclo XXV
Settore Concorsuale di afferenza: 03/A1 – CHIMICA ANALITICA
Settore Scientifico disciplinare: CHIM/12 - CHIMICA DELL’AMBIENTE E DEI BENI CULTURALI
TITOLO TESI
Advanced spectroscopic techniques and chemometric
analysis for atmospheric organic aerosol
characterization and source apportionment
Presentata da: Dott. MARCO PAGLIONE
Coordinatore Dottorato:
Prof. Enrico Dinelli
Tutore:
Relatore:
Emilio Tagliavini
Dott. Stefano Decesari
Table of contents
Table of contents ... I
Executive summary of the thesis ... 1
Papers on the international refereed literature originating from this thesis ... 6
1 - Atmospheric Aerosol ... 7
1.1 Definition ... 7
1.2 Size distribution ... 8
1.3 Chemical composition ... 11
1.4 Organic Aerosol (OA) ... 12
1.5 Aerosol and Climate: Direct and Indirect Effects ... 14
1.6 Aerosol Health Effects and Air Quality ... 17
2 - Measurement of organic aerosol (OA) chemical composition ... 21
2.1 Overview ... 21
2.2 Off-line high-resolution OA measurements ... 23
2.3 On-line techniques ... 25
2.4 Introduction to 1H-NMR analysis of organic aerosol ... 27
2.4.1 NMR analysis of specific tracers ... 29
2.4.2 NMR analysis of functional groups and related source apportionment ... 30
2.4.3 NMR fingerprints and factor analysis for identification of OOA types ... 35
3 – Source apportionment of atmospheric aerosol ... 37
3.1 Overview on source apportionment models of atmospheric aerosol ... 37
3.2 Source Apportionment of OA environmental data ... 39
3.2.1 Overview of OA source apportionment techniques ... 39
3.2.2 Factor analysis of OA chemical datasets ... 40
4 - Experimental ... 43
4.1 Sampling sites ... 43
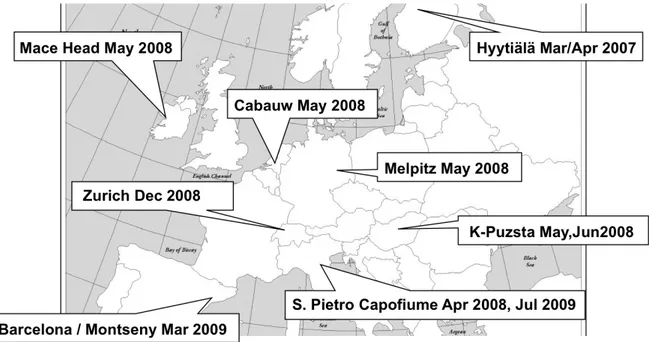
4.1.1 Overview of the EUCAARI project ... 43
4.1.2 EUCAARI sampling sites and Intensive Observation Periods analyzed ... 44
4.1.2.1 Mace Head ... 46
4.1.2.2 Hyytiälä ... 46
4.1.2.4 Cabauw ... 47
4.1.2.5 San Pietro Capofiume ... 48
4.1.2.6 Melpitz ... 48
4.1.2.7 Zurich ... 49
4.1.2.8 Barcelona & Montseny ... 49
4.2 Samples handling and analysis ... 50
4.2.1 Sampling methods ... 50
4.2.2 Analytical methods ... 51
4.2.2.1 Total Carbon (TC) analysis ... 52
4.2.2.2 Water Soluble Organic Carbon (WSOC) analysis ... 52
4.2.2.3 Ion Chromatography (IC) ... 52
4.2.2.4 Water Soluble Organic Nitrogen (WSON) ... 53
4.2.2.5 WSOC separation by High Performance Liquid Chromatography (HPLC) ... 53
4.2.2.6 WSOC characterization by proton-Nuclear Magnetic Resonance (1H-NMR) spectroscopy ... 54
4.3 Factor Analysis of NMR spectra ... 54
4.3.1 General description of factor analysis procedure and algorithms ... 54
4.4 Aerosol Mass Spectrometer (AMS) ... 58
5 - Characterization and source apportionment of atmospheric organic aerosols
during the EUCAARI measurement campaigns by means of nuclear magnetic
resonance (NMR) spectroscopy ... 61
5.1 Analyses of NMR datasets from the EUCAARI intensive observation periods (IOPs) .. 61
5.2 Application of factor analysis to the EUCAARI NMR datasets ... 63
5.2.1 Choosing the number of factors ... 63
5.2.2 Input uncertainty determination ... 66
5.2.3 Rotational problems ... 68
5.3 Factor analysis of NMR-datasets from individual EUCAARI campaigns (IOPs) ... 69
5.4 Factor analysis of the whole European EUCAARI dataset ... 74
5.5 Comparison between NMR and AMS results within EUCAARI project ... 77
5.6 Conclusion ... 80
6 - Determination of the biogenic secondary organic aerosol fraction in the
boreal forest by NMR spectroscopy ... 81
6.2 Aerosol sampling and analysis ... 81
6.3. Concentrations of main submicrometer aerosol components ... 82
6.4 Source apportionment by NMR factor analysis ... 85
6.5 Comparison between AMS and NMR in OA source apportionment ... 90
6.6 Summary and final remarks ... 93
7 - Identification of Humic-Like Substances (HULIS) in oxygenated organic
aerosol using NMR and AMS factor analysis and liquid chromatogaphic
techniques ... 95
7.1 Introduction to the Cabauw experiment ... 95
7.2 Aerosol sampling and analysis ... 95
7.3 Meteorological regimes and air mass origin ... 96
7.4 PM1 chemical composition from filter measurements ... 98
7.5 NMR factor analysis for WSOC source apportionment ... 100
7.6 Comparison between NMR and AMS factors for oxygenated organic aerosols ... 103
7.7 Comparison of HULIS from chromatographic and spectroscopic techniques ... 108
7.7 Summary and final remarks ... 109
8 - Primary and secondary biomass burning aerosols determined by
1H-NMR
spectroscopy during the 2008 EUCAARI campaign in the Po Valley (Italy) .... 113
8.1 Introduction to the Po Valley experiment ... 113
8.2 Aerosol sampling and analysis ... 114
8.3 NMR characterization of WSOC ... 114
8.4 NMR factor analysis and comparison with PMF-AMS ... 116
8.5 Identification of biomass burning POA and SOA data ... 120
8.6 Isotopic measurements and carbon budget ... 124
8.7 Final remarks ... 126
Acknowledgements ... 129
References ... 131
Executive summary of the thesis
by Marco Paglione
Atmospheric aerosol particles directly impact air quality, visibility and atmospheric transparency, through scattering and absorption of light (i.e., direct climate forcing effect) and by modulating the formation and properties of clouds (i.e., indirect climate forcing effect) which in turns contribute to control the climate system at both regional and global scales (Ravishankara, 2005; IPCC, 2007; Ghan, 2007). Organic Aerosol (OA) in general accounts for a large fraction (10–90%) of the global submicron (PM1) particulate mass (Kanakidou et al., 2005; Zhang et al., 2007) whereas the rest of the mass consists of soot, inorganic salts, metals and elements. The inorganic and elemental fraction of the particle mass has been quite well characterized, while much less is known about the composition of the organic fraction. The characterization of OA chemical composition and mass concentration is limited by analytical challenges arising from the fact that atmospheric OA is a complex mixture of thousands of organic compounds characterized by vastly different properties, such as oxidation state, volatility and hygroscopicity, and extremely diverse sources and atmospheric reactions.
Organic particles are either emitted directly into the atmosphere as primary organic aerosol (POA) or form in the atmosphere as secondary organic aerosol (SOA) due to the photochemical conversion of gaseous precursors, including both anthropogenic and biogenic species (Pankow, 1994; Kroll and Seinfield, 2008; Calvert, 2002; Atkinson and Arey, 2003). Current atmospheric chemical transport models estimate that SOAs dominate the aerosol organic composition at the global scale (Baltensperger et al., 2005; Lanz et al., 2007). Nevertheless, current estimates of global SOA production remain extremely uncertain due to the lack of observations capable to constrain the contributions from the various SOA sources.
In general, OA measurement methods can be divided into two broad categories: off-line and on-line. Off-line techniques, e.g., gas chromatography/mass spectrometry (GC/MS), liquid chromatography/MS (LC/MS), nuclear magnetic resonance (NMR) and Fourier transform infrared (FTIR) spectroscopy, provide detailed information on individual chemical species or functional groups but require large amounts of sample, resulting in low time resolution (hours to days). On-line techniques (e.g., aerosol mass spectrometry, AMS, or Proton-Transfer-Reaction Mass Spectrometry, PTR-MS) usually provide less specific information on composition, with little details
on individual species concentrations, but benefit from fast acquisition times, providing near real-time data (Saarikoski et al., 2012; Duarte and Duarte, 2011).
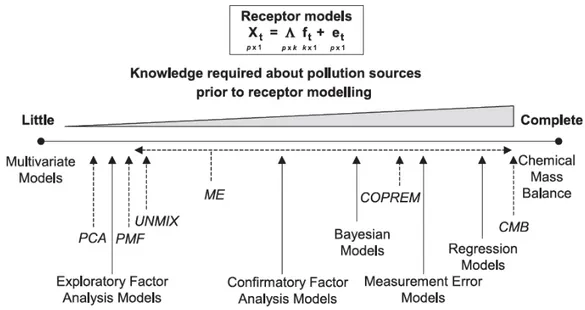
A universal technique for atmospheric organic aerosol analysis does not exist, and trade-offs between specificity or resolution and recovery have to be applied, resulting in a certain degree of complementariness between the analytical techniques (Hallquist et al., 2009). For this reason, a comprehensive characterization can be attempted by employing suitable combinations of techniques. This approach, however, involves the problem of treating heterogeneous chemical datasets with a large number of variables, up to 102 - 103 in the case of mass spectra or high resolution NMR. In order to reduce the database complexity, algorithms for multivariate statistical analysis and factor analysis are increasingly used for the identification of “hidden” information in the datasets and for explanation of the variability in the chemical records obtained at a given site using a limited number of relevant variables (“receptor modelling”) (Viana et al., 2008).
Multivariate statistical techniques, overall called Factor Analysis, such as Positive Matrix Factorization (PMF) (Paatero and Tapper, 1994; Paatero, 1999) and Multivariate Curve Resolution (Terrado et al., 2010) are used to deconvolve a time series of simultaneous measurements into a set of “factors” or “components”, representing groupings of chemical species that correlate in time, and their time-dependent concentrations. These factors can be related to specific emission sources or atmospheric reactions, on the basis of chemical tracer profiles or of the links between time trends and atmospheric transport (e.g., wind direction respect to sources). Because receptor models require no a priori knowledge of source-specific emission inventories, they are ideal for use in locations where emission inventories are poorly characterized or where atmospheric processing and secondary formation play a major role.
Several publications in last years dealt with factor analysis applied to datasets of OA chemical compositions from both off-line and on-line measurements. Most consistent results are based on the deconvolution of AMS mass spectra and allowed the separation of OA components into a few chemical classes: oxygenated OA (OOA), hydrocarbon-like OA (HOA), and sometimes other components such as biomass burning OA (BBOA) (Zhang et al., 2011). It was found that the majority of OA mass is accounted for by OOA which can be further decomposed into a more oxidized component, the low-volatility OOA (LV-OOA), and a less oxidized one, the semi-volatile OOA (SV-OOA) (Ng et al., 2010). Moreover, there is strong evidence that most atmospheric OOA is of secondary origin since its concentration is strongly correlated to photochemical activity tracers (Volkamer et al., 2006). Laboratory and field observations and state-of-the-art gas-to-particle partitioning models suggest that atmospheric OOA are a highly dynamic system, tightly coupled to gas-phase oxidation chemistry (Jimenez et al., 2009). Examination of a large AMS dataset for
Northern Hemisphere environments (Ng et al. 2010) showed that in spite of the great variability in compositions in near-source areas, all compositions tend to converge to highly oxidized LV-OOA at background sites and whose composition is confined in a relatively narrow range of the most characteristics mass fragments, that must be considered as an endpoint of OA transformation (“ageing”) in the troposphere. Nevertheless, the relative contribution of POA and SOA to the overall OA budget remains controversial due to the persistent discrepancies between measured OA concentrations and predictions of atmospheric chemistry models. Finally, preliminary comparison of the AMS groupings for OA with those emerging from other techniques (i.e. FT-IR or NMR) indicates that the actual diversity of aerosol organic chemical classes (and especially of its secondary fraction) is greater than suggested by AMS alone, and hence it requires information from complementary analytical techniques.
Chemometric methods for sample source identification are used in many disciplines, but contrary to other scientific fields, methods relying on the analysis of NMR datasets are rarely used in atmospheric sciences. This thesis work is a first attempt to fill this gap. It provides an original application of NMR-based chemometric methods to atmospheric aerosol source apportionment. The method was tested on chemical composition databases obtained from sample sets collected at both pristine and polluted environments in Europe, hence exploring the impact of a great diversity of natural and anthropogenic sources. In this work, we focused on sources of water-soluble organic aerosols, for which the NMR analysis provides substantial advantages compared to alternative methods. Moreover, aerosol water-soluble organic carbon (WSOC) represents a fraction of aerosol organic matter for which the traditional source apportionment methods, relying on the GC/MS analysis of tracer compounds, is less reliable and for which the development of new methods, more suitable for the analysis of very polar compounds, is advisable.
In recent years, progress in the application of NMR techniques to the analysis of atmospheric aerosols showed that:
a) the sensitivity of proton-NMR (H-NMR) analysis of atmospheric samples conducted in strong magnetic fields (≥ 400 MHz) is not inferior to that of GC/MS analysis, making H-NMR suitable for the analysis of full time series of samples collected during experimental field campaigns;
b) the availability of new spectral datasets from laboratory studies, like in reaction chambers (“smog” chambers) provided the basis for the assignment of NMR spectral fingerprints to specific aerosol sources.
In this context, this thesis work starts from nine NMR datasets for submicron aerosol WSOC samples collected during field campaigns of the research project EUCAARI, characterized by
different levels of complexity and source variability. Standard factor analysis algorithms are then applied and compared. A minimum spread in the results from the various mathematical algorithms was indicative of genuine solutions, suitable for the estimation of specific source contributions to the WSOC mass concentrations. Most of the following discussion will deal with the interpretation of factor “profiles” and “contributions”. While profiles represent the characteristic NMR spectra for each factor and are interpreted on the basis of the underlying functional group composition and by comparing with libraries of NMR spectra, the contributions are the time trends and contributing amounts to the total aerosol concentrations. Comparison of factor time trends with those of tracer compounds derived by ancillary techniques, such as ion chromatography, supported the assignment of factors to specific sources.
The factor analysis techniques, applied independently to the NMR datasets from the various field campaigns, allowed the identification of recurrent source contributions to the aerosol WSOC in the European background lower troposphere:
1. Marine SOA, containing methane-sulphonate (MSA) and found at coastal stations and in Mediterranean countries;
2. Aliphatic amines from ground sources (soil respiration, agricultural activities, waste management, etc.) which were found in northern countries and in the Po Valley;
3. Biomass burning POA, containing tracers of cellulose and lignine pyrolysis and occurring especially in samples collected in the cold seasons and at both rural and urban sites;
4. Biogenic SOA from terpene oxidation, with spectral features matching those of SOA generated in smog chamber experiments starting from monoterpene ozonolysis and photooxidation, and occurring at forest sites in Scandinavia and central Europe;
5. “Aged” SOAs, of unclear biogenic/pyrogenic origin, characterized by polysubstitued aliphatic compounds including humic-like substances (HULIS) and which were found at all European sites;
6. Other factors found at the forest sites, possibly including contributions from Primary Biological Aerosol Particles (PBAPs), and during summer at SPC, possibly representing the products of cooking activities.
The contributions of such factors varied considerably between stations and according to the period of the year. POA from biomass burning accounted for more than 50% of the water-soluble organic carbon in the winter months, even in the urban station (Zürich). Aged SOA associated with HULIS was predominant during the spring-summer at rural background stations (> 75%), suggesting that secondary sources and transboundary transport become more important with respect to local sources
in determining concentration levels of organic aerosol (oxygenated) in Europe in spring and summer.
The complex aerosol measurements carried out during the EUCAARI field campaigns, involving several foreign research groups, provided the opportunity to compare the source apportionment results obtained by NMR analysis in this thesis with those provided from modern, more widespread techniques and in particular from the Aerodyne aerosol mass spectrometers (AMS). Factor analysis methods applied to AMS datasets have now provided categorization schemes of atmospheric organic aerosols (the above mentioned OOAs, HOA, etc.) which are becoming a standard for atmospheric chemists. The results emerging from this thesis work partly confirm the AMS classification and partly challenge it. In particular, NMR factors for aerosol WSOC were linked to AMS oxidized organic aerosol (OOA) types in some environments: HULIS compounds, found at all continental polluted sites, were linked to the AMS Low-Volatility OOA, while the biogenic SOA from terpenes oxidation, found at forest stations by NMR analysis, was linked to less oxidized AMS OOA types. Finally, the biomass burning POA NMR factor overlaps with the AMS biomass burning aerosols (BBOA), even if a better match of total biomass burning source contributions from AMS respect to NMR was found when accounting for oxygenated compounds believed to form by atmospheric chemical reactions in biomass burning plumes, hence of secondary origin (SOA). Fewer similarities were observed between the other classes of organic aerosol components identified separately by AMS and NMR factor analysis, with no simple scheme of assignment. Reasons for these discrepancies are discussed in the final sections of this thesis. In brief, the different sensitivities of AMS and NMR to specific chemical structures and functional groups have an impact on the variables determining the results of factor analysis. Therefore, even if AMS and NMR spectroscopies exhibit much greater recoveries in the analysis of complex matrices with respect to gaschromatographic techniques, differences in analytical selectivity between spectroscopic methods remains an issue for receptor modeling of organic aerosols. In conclusion, this study shows that the picture of the chemical composition of the organic fraction of the aerosol is more complex than AMS or NMR can individually explain. Conversely, identification of “factors” in multiple methods, provides better chances that the chemical structures underlying factors correspond to “real” chemical classes rather than being mere collections of spectral signals extracted by statistical algorithms. Therefore, the use of complementary spectroscopic techniques during field experiments is a powerful tool to test and constrain the conceptual schemes of particulate organic compound categorization and evolution in the atmosphere which have been proposed in the recent literature.
Papers on the international refereed literature originating from this thesis
• Decesari S., Finessi E., Rinaldi M., Paglione M., Fuzzi S., Stephanou E. G., Tziaras T., Spyros A., Ceburnis D., O'Dowd C., Dall’Osto M., Harrison R. M., Allan J., Coe H., Facchini M. C., Primary and secondary marine organic aerosols over the north Atlantic Ocean during the MAP experiment, J. Geophys. Res. A, doi:10.1029/2011JD016204, 2011. • Finessi E., Decesari S., Paglione M., Giulianelli L., Carbone C., Gilardoni S., Fuzzi S.,
Saarikoski S., Raatikainen T., Hillamo R., Allan J., Mentel Th. F., Tiitta P., Laaksonen A., Petäjä T., Kulmala M., Worsnop D. R., and Facchini M. C., Determination of the biogenic secondary organic aerosol fraction in the boreal forest by NMR spectroscopy, Atmos. Chem.
Phys., 12, 941-959, 2012.
• Landi T. C., Curci G., Carbone C., Menut L., Bessagnet B., Giulianelli L., Paglione M. and Facchini M. C, Simulation Of The Size-Segregated Aerosol Chemical Composition Over Northern Italy, accepted and under press on Atmospheric Reaserch.
• Paglione M., Kiendler-Scharr A., Mensah A., Finessi E., Giulianelli L., Sandrini S., Facchini M.C., Fuzzi S., Schlag P., Piazzalunga A., Tagliavini E., Decesari S., Identification of humic-like substances (HULIS) in oxygenated organic aerosols using NMR and AMS factor analyses and liquid chromatographic techniques, under submission to Atmos. Chem.
Phys. Discuss.
• Paglione M., Decesari S., Finessi E., Giulianelli L., Carbone C., Facchini M. C., Moretti F., Tagliavini E., Hillamo R., Carbone S., Saarikoski S., Worsnop D., Canagaratna M., Prevot A., Swietlicki E., Fuzzi S., Primary and secondary biomass burning aerosols determined by proton nuclear magnetic resonance (1H-NMR) spectroscopy during the 2008 EUCAARI campaign in the Po Valley (Italy), in preparation.
1 - Atmospheric Aerosol
1.1 Definition
Atmospheric aerosol is generally defined as a suspension of liquid or solid particles in the air, with particle diameters in the range of 10-9–10-4 m (lower limit: molecules and molecular clusters; upper limit: rapid sedimentation). The most evident examples of aerosols in the atmosphere are clouds, which consist primarily of condensed water with particle diameters on the order of approximately 100 µm. In atmospheric science, however, the term aerosol is most often restricted to refer to suspended to solid particles or to particles in which condensed water occurs in lower concentrations respect to the other chemical constituents, whereas clouds are considered as separate phenomena, even if aerosol and clouds are linked by a very fundamental process in the atmosphere which is cloud droplet nucleation (as explained below).
Atmospheric aerosol particles originate from a wide variety of natural and anthropogenic sources. Primary particles are directly emitted from sources such as biomass burning, incomplete combustion of fossil fuels, volcanic eruptions, and mechanical processes resulting from the friction of wind over land and sea surfaces leading to the suspension of mineral dust, sea salt, and biological materials (plant fragments, microorganisms, pollen, etc.). In urban environments, (re-)suspension of particles can be also promoted by traffic. Secondary particles, conversely, are formed by the transformation of reactive gases into particulate matter in the atmosphere caused by chemical reactions or upon cooling of the air mass (gas-to-particle conversion).
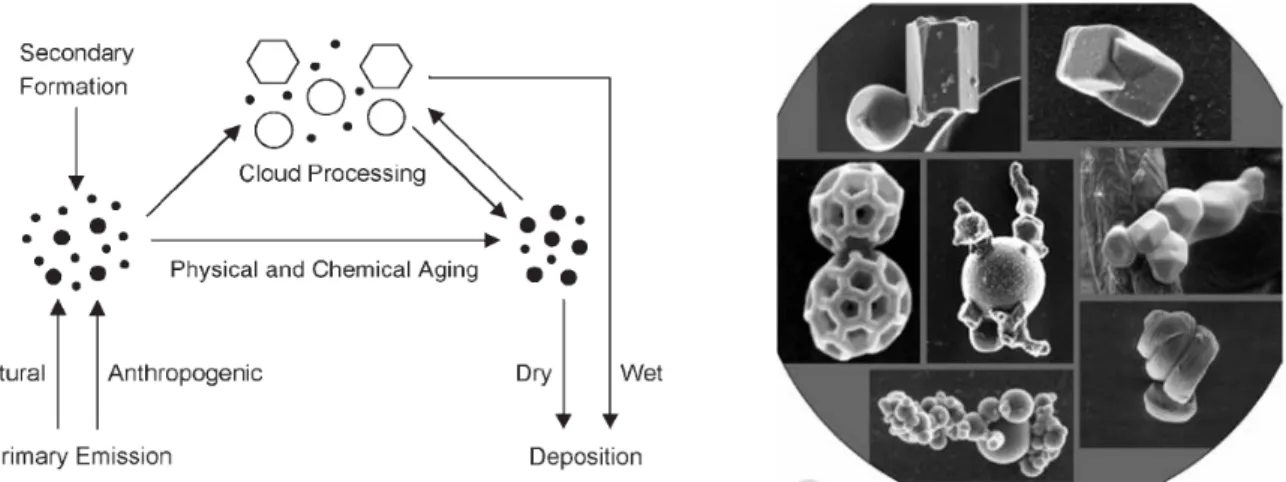
As illustrated in Figure 1.1, airborne particles undergo various physical and chemical transformations (atmospheric aging), encompassing changes of particle size, shape, structure, and composition. Cloud formation can also lead to fast aerosol ageing, as particles are scavenged into cloud droplets, gas absorption and chemical reactions occur in the aqueous phase and eventually droplet can re-evaporate producing particles with modified chemical composition with respect to the original aerosols. Such phenomenon is often referred as cloud processing. In cloud systems, aerosol particles can be scavenged either by direct nucleation of water vapor onto particles forming new droplets or by collision with cloud droplets. In the first case, aerosols serve as cloud condensation nuclei (CCN) or ice nuclei (IN).
Figure 1.1: Atmospheric cycling of aerosols and examples of common aerosol shapes and compositions as observed by
scanning electron microscopy, SEM (from Poschl, 2005).
In precipitating clouds, not only the condensation nuclei but also other aerosol particles are scavenged on the way to the surface and removed from the atmosphere. This process, termed “wet deposition”, is actually the main sink of submicrometric atmospheric particulate matter. Particle deposition without precipitation of hydrometeors that is, “dry deposition” by convective transport, diffusion, and adhesion to the Earth’s surface – is less important for fine aerosol fluxes at the global scale, but cannot be neglected at the urban scale.
Depending on aerosol properties and meteorological conditions, the characteristic residence times of aerosol particles in the atmosphere range from hours to weeks. The concentration, composition, and size distribution of atmospheric aerosol particles are temporally and spatially extremely variable. In the lower atmosphere (troposphere) the total particle number and mass concentrations typically vary in the range of about 102–105 cm-3 and 1–100 µgm-3, respectively.
1.2 Size distribution
The atmospheric aerosol particles size distribution spans over several orders of magnitude from a few nanometers (nm; 1nm = 10-9m) to about a hundred micrometers (µm; 1µm = 10-6m). To appreciate this wide size range one just needs to consider that the mass of a 10 µm diameter particle is equivalent to the mass of one billion 10 nm particles. As result of particle formation and removal processes, the atmospheric aerosol size distribution is characterized by multiple relative maxima or modes, corresponding to different populations of particles, generally classified as nucleation, accumulation and coarse mode particles (Figure 1.2).
Figure 1.2: ideal size distribution with their four principal modes. The diagram also shows the main mechanisms of
formation and growth of particles acting in the various size ranges.
These modes are generally found in to the following size ranges, defined on the basis of particle aerodynamic diameter (Da1) (Whitby, 1978):
- Nucleation and Aitken mode (Da < 0.1µm); - Accumulation mode (0.1 < Da < 1µm); - Coarse mode (Da> 1µm).
A more general distinction is made between “fine” and “coarse” aerosol: fine aerosol is made up of particles of the first two modes (PM1 with Da< 1µm), whereas coarse one of those with larger size (PM10 with Da< 10µm,). Other categorizations are provided by air quality regulations, the most popular being PM2.5, which is based on the deposition properties of aerosol particles in the human respiratory system.
The distinction between fine and coarse particles is fundamental in any discussion of the physics, chemistry, measurement, or health effects of aerosol because very different formation,
1 Aerodynamic diameter is the diameter that a particle with ideal unitary density should have to sediment at the same speed of a particle with its real density and diameter.
transformation and removal processes characterize the submicron and supermicron regimes (Seinfeld&Pandis, 1998) (Figure 1.3).
Coarse particles are formed mainly by mechanical processes like dust suspension or re-suspension or sea spray. Coarse particles have sufficiently large sedimentation velocities to make them settle by dry deposition within a few hours of transport in the lower troposphere, although longer transport (> 1 day) are possible at high elevations. Coarse particles never account for more than a few percent of the particles by number concentration, even if they can account for a large fraction in term of particulate mass.
Figure 1.3: microphysical processes that affect size distribution and chemical composition of atmospheric aerosol. The
diagram shows the wide size range of particles and as the aerosol participates in processes through atmospheric chemical reactions in homogeneous and heterogeneous phase or within clouds.
Conversely, fine particles are mainly produced by secondary processes such as gas-to-particle conversion mechanisms and by primary sources mostly represented by various types of combustion (open burning, vehicular emissions, etc.). The nucleation mode is the result of nucleation of new particles from rapid gas condensation. This occurs during the rapid cooling of an exhaust upon dilution in the background air, but may happen also at ambient temperature through photochemical reactions. The Aitken mode results from condensation of vapors onto nucleation mode particles and from their coagulation, as well as from primary combustion emissions. In turns, the accumulation mode typically results from prolonged condensation of vapors on Aitken particles and from the formation of particle mass by chemical reactions in non-precipitating cloud droplets. Since sedimentation is not effective for fine aerosols and coagulation is too slow for aerosol > 0.1 µm, particles in the accumulation mode tend to accumulate in the atmosphere and usually account for
most of the aerosol surface area. They also provide an equivalent or greater contribution to total aerosol mass with respect to coarse particles.
Fine particles, given their small size, penetrate deeply into the human respiratory system with detrimental effects on human health (as better explained in the section 1.5.2). Moreover, because of their long residence time, accumulation mode particles contribute to transboundary air pollution transport and to the modification of atmospheric transparency over vast geographical areas.
For these reasons my PhD and this thesis have been mainly focused on fine (submicron or PM1) particles which are the most representative of aerosol background concentrations and compositions in diverse environments.
1.3 Chemical composition
Respect to long-lived greenhouse gases, tropospheric aerosol exhibits a chemical composition characterized by a great spatial and temporal variability, reflecting the variety of sources, transformation, and removal processes. In general, aerosol particles consist of complex mixtures of inorganic and carbonaceous species, the most important classes being inorganic water-soluble salts such as sulfates, nitrates, ammonium salts and sea salt, soluble and insoluble carbonaceous material, and insoluble inorganic compounds from soil particles and combustion ash.
Carbonaceous particles are found in the troposphere as elemental (black) carbon (EC), organic carbon (OC) and carbonate carbon, the latter being negligible in the submicron size range. Produced solely by combustion processes, EC strongly absorbs light and was put in relation with degraded visibility (Bond and Bergstrom, 2006). Organic carbon is formed by both primary sources and gas-to-particle conversion (Castro et al., 1999).
Aerosol compounds derived from combustion or from gas-to-particle conversion, such as sulphate, ammonium, elemental and organic carbon, are found predominantly in fine particles whereas coarse particles are generally associated with sea salt and crustal species emitted by mechanical processes at the Earth surface. However, heterogeneous chemical reactions at particle surface may lead some compounds, like nitrate, to form by condensation in both fine and coarse modes. An overview of the average chemical composition of European tropospheric aerosols in the different size ranges was published by Putaud and co-workers (2003) and more recent studies provided detailed phenomenologies of the aerosol chemical composition for many specific European sites (Putaud et al., 2004 and 2010).
1.4 Organic Aerosol (OA)
Particulate organic compounds are widespread in all environments and represent a large, sometimes dominant fraction of atmospheric fine particles accounting for 20-90% of aerosol mass in the lower troposphere (Kanakidou et al., 2005; Zhang et al., 2005; Jimenez, 2009). Figure 1.4 shows the average mass concentrations of aerosol particles in the fine mode determined by aerosol mass spectrometric measurements across the Northern Hemisphere. The fractional abundance of sulphate (red) nitrate (blue), ammonium (orange) and organics (OM, green) is given in the pie charts, showing an OM significant fraction in all measurements independent of location.
While it is relatively easy to get insights to the physical properties such as size distribution or refractive index of aerosol particles, compositional analysis especially of the organic fraction is still very challenging. Although a substantial amount of new data on organic aerosol composition emerged from a number of dedicated studies in the last decade, the current understanding of OA chemical composition and on the relative importance of natural vs. anthropogenic sources remain unsatisfactory (Fuzzi et al., 2006).
Figure 1.4: Aerosol mass spectrometric measurements of the fine particulate aerosol fraction. Colors for the study
labels indicate the type of sampling location: urban areas (blue), <100 miles downwind of major cities (black, and rural/remote areas >100 miles downwind (pink). Pie charts show the average mass concentration and chemical composition: organic matter (organics, green), sulphate (red), nitrate (blue), and ammonium (orange) [Zhang et al.,
A wide range of both natural and anthropogenic sources for ambient OA were identified, including combustion of fossil fuels, direct injection of un-burnt fuel and lubricants, industrial emissions, plant matter, biomass burning, and biogenic emissions (Jacobson et al., 2000).
Organic aerosols can be separated into primary (POA) and secondary (SOA) depending on their process of formation (Figure 1.5). POA consists of particles that are directly emitted into the atmosphere such as organic compounds associated to elemental carbon formed by combustion processes (contributing mostly to the fine fraction of OA) or plant debris from biogenic sources (more representative of the coarse fraction). Spray of organic-rich liquid surfaces may inject primary organic particles also in the submicron mode. Such mechanism can contribute to the formation of submicron organic particles over high biologically productive oceanic waters (O’Dowd et al., 2004).
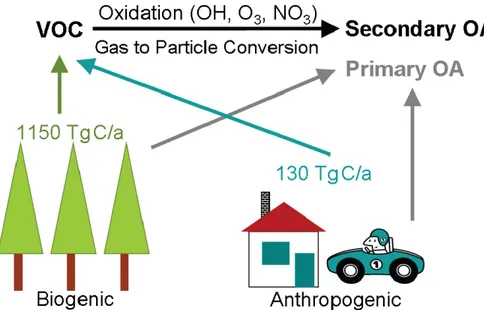
SOA in contrast is mainly formed by gas-to-particle conversion of volatile organic compounds (VOC) after their oxidation and participates almost entirely to the fine OA fraction. The global VOC budget is dominated by biogenic emissions, which are estimated to be at the order of 1150 Tg C/yr, almost tenfold the flux of anthropogenic volatile organic compounds (Guenther et al., 1995). However SOA in the broad sense can be generated in the atmosphere also by chemical transformation (aging) of primary components in the condensed phase that can lead to the formation of multiple generations of secondary chemical components.
Figure 1.5: Sources of organic aerosol particles. Emission rates are taken from (Guenther et al., 1995).
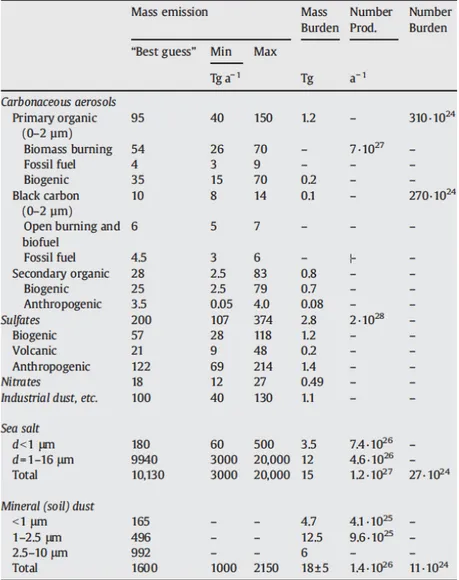
Recent estimations of primary and secondary, biogenic and anthropogenic emissions are reported in the table below (Table 1.1). Nevertheless, the relative contribution of POA and SOA to the overall OA budget and the determination of their main sources remain controversial due to the persistent
discrepancies between measured OA concentrations and predictions of atmospheric chemistry models often showing an underestimation of the real concentrations.
Table 1.1: Particles emission/production burdens estimated for the year 2000 (taken from Andreae and
Rosenfeld, 2008). Range reflects estimates reported in the literature.
Therefore, in order to improve models simulations and to develop strategies of reduction or mitigation of the aerosol potential adverse effects on environment and human health, it is very crucial to delve into the knowledge of sources, transformation mechanisms and chemical features of organic primary and secondary aerosols.
1.5 Aerosol and Climate: Direct and Indirect Effects
Anthropogenic aerosol modifies the transparency of the atmosphere, hence exerting a radiative
forcing. Radiative forcings are changes in the energy fluxes of solar radiation (short-wave) and
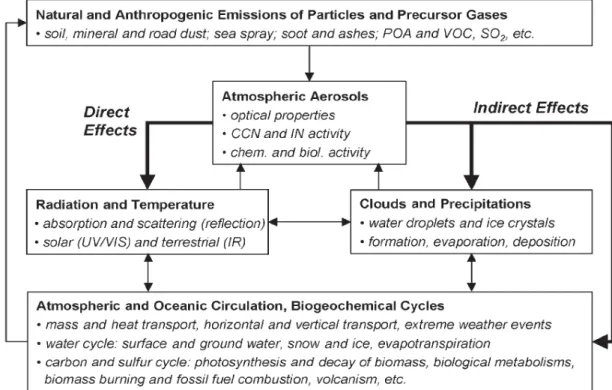
atmospheric composition and Earth surface respect to pre-industrial times. Negative forcings such as the scattering and reflection of solar radiation by aerosols tend to cool the Earth’s surface whereas positive forcings such as the absorption of terrestrial radiation by greenhouse gases warm it (greenhouse effect). Figure 1.6 illustrates the distinction between direct and indirect aerosol effects and some major feedback loops in the climate system. Direct forcings of aerosols are due to their effect on atmospheric transparency because of light scattering and absorption by aerosol particles, whereas indirect forcings refer to the modifications induced by aerosol on other actors of the climate system, such as clouds (cloud brightness is influenced by the availability of aerosol particles acting as CCN and IN).
Figure 1.6: Direct and indirect aerosol effects and major feedback loops in the climate system.
The optical properties relevant for the direct effects (scattering and absorption coefficients or extinction cross-section and single scattering albedo, etc.) as well as the ability to act as CCN or IN are determined by the aerosol size-distribution, morphology and chemical composition. Such characteristics depends in turn on aerosol sources as well as on the atmospheric processes outlined above (coagulation, condensation, sedimentation, chemical transformation, cloud processing). The climate feedback loops in Figure 1.6 illustrate the complexity of the possible interactions of atmospheric aerosols with solar and terrestrial radiation, clouds and precipitation, atmospheric circulation and the hydrological cycle. Each interaction highlighted in Figure 1.6 comprises a
multitude of physicochemical processes that depend on atmospheric composition and meteorological conditions and are largely not quantitatively characterized. Thus the actual climate system responses and feedback to natural or anthropogenic perturbations such as industrial and traffic-related greenhouse gas and aerosol emissions, volcanic eruptions, etc. are highly uncertain. In many cases, even the sign or direction of the feedback effect is unknown, that is, it is not clear whether a perturbation will be reinforced (positive feedback) or dampened (negative feedback). For example, enhanced deposition and uptake of aerosol particles and trace gases on vegetation, soil, or surface water can lead to an increase or decrease in biogenic POA and SOA precursor emissions, depending on the fertilizing, toxic, or reproductive biological activity of the aerosol and trace gas components. The increase in atmospheric CO2 and global warming is expected to enhance photosynthesis, biogenic emissions of VOC, and the formation of SOA particles, which may act as CCN, increase cloudiness, and lead to a cooling effect (negative feedback). On the other hand, the negative feedback mechanism could be counteracted by temperature-related biological stress and eutrophication effects which may lead to a decrease in photosynthesis, biomass production, VOC emissions, SOA formation, and cloudiness, and further enhance global warming (positive feedback). A recent review article by Lohmann and Feichter (2005) provides an overview of indirect aerosol effects, their estimated magnitude, and climatic implications.
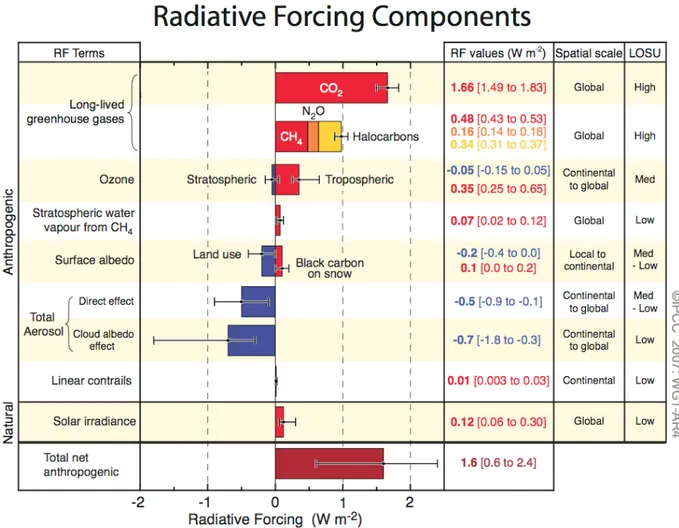
Overall, the current aerosol radiative forcing relative to that in preindustrial times is estimated to be around -0.7 [from -1.8 to -0.3] W m-2, as opposed to a total forcing of about +1.6 [from +0.6 to +2.4] W m-2, as evaluate by the last report of the Intergovernmental Panel on Climate Change (IPCC) elaborating in 2007 (Figure 1.7).
Owing to the limited understanding of the numerous feedbacks, however, it is still unclear if clouds provide a positive or negative feedback to an increase in atmospheric carbon dioxide and other greenhouse gases. The uncertainties of aerosol, cloud, and precipitation interactions and feedback effects are among the main reasons for the high uncertainty of climate sensitivities and for the projected global mean surface temperature increase over the next century (1–6 °C or more). My doctoral work and this thesis, although not specifically addressing the climate change issues, deals with the scientific question of the aerosol source apportionment, by contributing to the development of experimental techniques aimed to assess the anthropogenic vs. natural fractions of atmospheric aerosol particles. It is worth to remind that, if all aerosol particles including desert dust and marine seasalt particles exert en effect on atmospheric transparency, only anthropogenic particles or the perturbations in the amount of natural particles due to anthropogenic activities are counted as forcings. In the case of the organic aerosols, object of this thesis, it is not trivial to discriminate between the anthropogenic and natural (e.g., biogenic) contributions. However, the concept of
climate forcing requires a clear split between the anthropogenic contribution and the natural background.
Figure 1.7: Global average radiative forcing (RF) estimated in 2005 for the carbon dioxide (CO2), methane (CH4),
nitrous oxide (N2O) and other anthropogenic important agents and mechanisms, together with the range reported IGT
(scale space) of the forcing and the level of scientific understanding reached (LOSU - Level Of Scientific Understanding). It also shows the net anthropogenic radiative forcing. These forcing require an estimate with sums of
factors asymmetric and can not be obtained by simple addition of the individual terms. Forcing additional factors not included in this chart are considered to have a low LOSU. The contribution of volcanic aerosols and other additional
natural forcing are not included in this figure due to their episodic nature.
1.6 Aerosol Health Effects and Air Quality
Numerous epidemiological studies show that fine air particulate matter and traffic-related air pollution are correlated with severe health effects, including enhanced mortality, cardiovascular, respiratory, and allergic diseases (Bernstein et al. 2004; Gauderman et al., 2004; Katsouyanni et al., 2001; Pope et al., 2004; Samet et al., 2005).
Moreover, toxicological investigations in vivo and in vitro have demonstrated substantial pulmonary toxicity of model and real environmental aerosol particles, but the biochemical mechanisms and molecular processes that cause the toxicological effects such as oxidative stress and inflammatory response have not yet been resolved. Among the parameters and components
potentially relevant for aerosol health effects are the specific surface, transition metals, and organic compounds (Bernstein et al. 2004; Bommel et al., 2003; Donaldson et al., 2003; Schinset al., 2004). Some of the possible mechanisms by which air particulate matter and other pollutants may affect human health are summarized in Table 1.2.
Ultrafine particles (Da<100 nm) are suspected to be particularly hazardous to human health, because they are sufficiently small to penetrate the membranes of the respiratory tract and enter the blood circulation or be transported along olfactory nerves into the brain (Oberdorster et al. 2004; Nemmar et al., 2002; Oberorster et al., 2005). Neither for ultrafine nor for larger aerosol particles, however, it is clear which physical and chemical properties actually determine their adverse health effects (particle size, structure, number, mass concentration, solubility, chemical composition, and individual components, etc.).
Table 1.2: some of the possible mechanisms by which aerosol particles and other air pollutants may affect human
health (Poschl, 2005).
Particularly little is known about the relations between allergic diseases and air quality. Nevertheless, traffic-related air pollution with high concentration levels of fine air particulate matter, nitrogen oxides, and ozone is one of the prime suspects besides non-natural nutrition and excessive hygiene practices, which may be responsible for the strong increase of allergies in industrialized countries over the past decades. A molecular rationale for the promotion of allergies by traffic-related air pollution has been proposed by Franze et al. (2003; 2005).
the identity, sources, atmospheric interactions, and sinks of hazardous pollutants.. In this context, my doctoral work and this thesis, though not focused on assessing aerosol health impacts, contributes to a) the development of experimental and statistical tools to discriminate the contribution of pollution sources to ambient PM2.5 levels, which can inform the evaluation of new regulatory actions for air quality control; and to b) the chemical characterization of the aerosol water-soluble organic carbon (WSOC), not including “traditional” micropollutants (such as PAHs) and for which inflammatory effects mediated by redox reactions have already been shown (Varma et al. 2009), but whose toxicological effects certainly require to be fully clarified and linked to specific sources.
The techniques of aerosol source apportionment developed in my doctoral work have been introduced and employed in the scientific project “Supersito”, started in 2011 and coordinated by ARPA-ER, and focusing on the aerosol health effects in Emilia-Romagna.
2 - Measurement of organic aerosol (OA) chemical composition
2.1 Overview
The determination of OA composition covers a wide range of analytical techniques and a number of reviews have been published in recent years on this topic (McMurry, 2000; Hoffmann and Warnke, 2007; Rudich et al., 2007). The aim of this section is to present some of the most recent advances in OA and SOA analysis extracted from the work of Hallquist et al. (2009), but with a focus on the characteristics and applications of the main technique employed in this study, i.e. proton-nuclear magnetic resonance spectroscopy (1H-NMR).
One of the main limitations to complete characterization of OA, and especially SOA, is the sheer number of individual species present. Most of the OA mass is accounted for by complex mixtures of compounds, including many isomeric forms, and each occurring in very low concentrations. Goldstein and Galbally (2007) showed that for alkanes with 10 carbons there are about 100 possible isomers, increasing to well over 1 million C10 organic species when all typical heteroatoms are included. For this reason, the recovery of particulate compound measurements varies dramatically between techniques: methods for individual compounds analysis cannot cope with the full molecular complexity of the samples and generally exhibits low recoveries (≤ 10%), while spectroscopic methods for functional group determination provides a more complete analysis, since for the same chemical composition the number of functionalities is much smaller than the number of individual compounds.
Methods for OA chemical analysis are generally classified into off-line and on-line techniques. Off-line high complexity techniques, e.g., gas chromatography/mass spectrometry (GC/MS), liquid chromatography/MS (LC/MS), nuclear magnetic resonance (NMR) and Fourier transform infrared (FTIR) spectroscopy, provide detailed information on individual chemical species or functional groups in OA but generally require large amounts of sample, resulting in low time resolution (hours to days) and low aerosol size resolution. On-line techniques (e.g., aerosol mass spectrometry, AMS) usually provide less specific information on composition (with respect to chromatographic techniques), i.e., some level of chemical characterization with less details on individual species, but have the advantage of fast acquisition times, providing near real-time data.
Figure 2.1 highlights how some of the most important techniques suitable for field applications compare in respect to completeness, chemical resolution, and time/size resolution.
Figure 2.1: Three-dimensional representation of some techniques currently used for the analysis of the organic content
of aerosol, highlighting their complementary nature. Definition of the acronyms is provided in the text and in the list of abbreviations.
As described above, techniques that provide molecular speciation, represented by GC/MS in the figure, can only do so for a small mass fraction of the OA (of the order of 10%) present in ambient aerosol. Time resolution is typically of many hours although automatic GC/MS systems for semi-continuous measurements, increasing time resolution up to 1 h, are now available (Williams et al., 2006, 2007). Improvements in this type of speciation techniques are highly desirable and are being actively pursued (e.g. Goldstein et al., 2008) but it is very unlikely that in the foreseeable future a single technique will provide full quantitative speciation of OA with a high time resolution.
Thermal-optical EC/OC analyzers can quantify total OC with 1 h time resolution but without size-resolution. The PILS-WSOC technique, which involves the use of a particle-into-liquid sampler (PILS) combined with analysis for water-soluble organic compounds (WSOC), can be used to quantify water-soluble OC with a time resolution of minutes and without size resolution (and also water-insoluble OC by difference from e.g. a thermal-optical instrument, but then limited to 1 h time resolution).
Spectroscopic techniques, like AMS, FTIR and NMR, can be employed to improve completeness of analysis by exploiting their selectivity to specific chemical classes or functional groups. Mass
spectrometric methods, like AMS, benefit of a much higher time and size resolution respect to the other techniques (e.g. DeCarlo et al., 2008) and are suitable for on-line elemental analysis (Aiken et al., 2008). Conversely, FTIR and NMR analysis can be carried out at a reduced time resolution but the resulting spectral data provide a much clearer information on functional group distribution with respect to AMS (e.g. Maria et al., 2003; Decesari et al., 2007).
In conclusion, a perfect field instrument does not exist, and at present a combination of techniques is required for a more complete characterization of OA and in particular of SOA.
2.2 Off-line high-resolution OA measurements
Generally the detailed analysis of OA is performed in the laboratory using aerosol samples collected onto filters followed by standard solvent extraction (Cheng and Li, 2004), supercritical fluid extraction (Chiappini et al., 2006) or thermal desorption (Greaves et al., 1985; Veltkamp et al., 1996). A range of solvents and pre-treatments of the analytes can be used, including chemical derivatization, to increase the range of species analyzed. The specific solvent is often used as an empirical definition for fractions of aerosol organic carbon e.g., the “water-soluble organic carbon” (WSOC).
Thermal desorption has gained increasing popularity over the last few years for the measurement of semivolatile, thermally stable organic aerosol components and can be used without any sample preparation when combined with high resolution chromatographic techniques (Hays and Lavrich, 2007).
Solvent extraction or thermal desorption methods allow to extract the majority of particulate organic compounds from the sample, though rarely > 80%, but the real bottleneck in the analysis is the recovery and resolution of the chromatographic techniques. Because of the tremendous molecular complexity, the majority of the eluted mass being present as an “unresolved complex mixture” (e.g., Williams et al., 2007). In addition, the large amounts of oxygenated organic compounds present in ambient samples, and especially in SOA, cannot be resolved by conventional GC analysis, although recovery and resolution can be increased by adopting suitable derivatization techniques (e.g., Yu et al., 1998, 1999; Kubàtovà et al., 2000; Docherty and Ziemann, 2001; Ho and Yu, 2002; Edney et al., 2003, 2005; Claeys et al., 2004a, b, 2007; Jaoui et al., 2005; Surratt et al., 2006; Szmigielski et al., 2007a, b; Healy et al., 2008)). Liquid chromatography (LC) is becoming increasingly popular for the analysis of polar compounds in aerosol and is routinely used for the analysis of carboxylic acids (Anttila et al., 2005; Römpp et al., 2006; Warnke et al., 2006). LC is particularly suited to high-MW species and very polar molecules, without the need for derivatization prior to analysis.
Ion chromatography (IC) is also suitable for the separation of organic aerosol components, especially for the analysis of very acidic, short-chain carboxylic or dicarboxylic acids, such as oxalic acid and glyoxylic acid (Jaffrezo et al., 1998; Kerminen et al., 2000; Röhrl and Lammel, 2001). Mass spectrometric detection is rarely coupled to IC, because of the necessity to use buffers that are often not compatible with MS detection. However, some IC-MS techniques were explored to investigate the composition of SOA in reaction chambers (Fisseha et al., 2004).
Semi-preparative ion-exchange chromatography was to separate WSOC fractions prior to proton NMR analysis (Decesari et al., 2000, 2001). This method allowed the characterization of very polar polycarboxylic acids, including high-molecular weight compounds. The NMR spectra of aerosol polyacids were found to be similar to those characteristic of terrestrial fulvic acids, for example Suwannee River fulvic acid (SRFA, Cappiello et al., 2003). Standards of fulvic acids were often used as surrogates for ambient aerosol in studies of physiochemical properties (Parsons et al., 2004; Topping et al., 2005b; Dinar et al., 2006b).
As already mentioned, functional group analysis using spectroscopic techniques can be used to reduce the complexity of the analysis and improve recovery. The most popular application among the off-line methods is the collection of aerosol on impactors or filters followed by analysis by FTIR spectroscopy to determine the concentration of organic functional groups such as saturated aliphatic (C-C-H), unsaturated aliphatic (C=C-H), aromatic (C=C-H), organosulfur (C-O-S), carbonyl (C=O), organic hydroxyl (COH), etc. (Blando et al., 1998; Havers et al., 1998a; Maria et al., 2003; Sax et al., 2005; Polidori et al., 2008). The strength of this technique is the ability to measure the total concentrations of certain functional groups, such as amines or organosulfur species, which are difficult to quantify with alternative methods. FTIR spectroscopic analysis was applied during many field campaigns (e.g. Maria et al., 2003; Polidori et al., 2008; Coury and Dillner, 2008, 2009; Russell et al., 2009). Maria et al. (2003) used aerosol concentrators to obtain sub- 1 h time resolution for employ onboard research aircrafts. The OA concentration determined by FTIR spectroscopy showed good agreement with co-located AMS measurements in several studies (Gilardoni et al., 2007; Russell et al., 2009). Sequential solvent rinsing can be used to further separate the organic compounds by polarity (Maria et al., 2002, 2003; Polidori et al., 2008). The OM/OC ratio can also be estimated from these measurements (Gilardoni et al., 2009).
NMR techniques were also used in numerous studies (comprising this that I am writing). Both solid and liquid NMR techniques were explored, and the analysis was performed with or without chemical derivatization aimed to increase selectivity to specific functional groups such as carboxylic acids and ketones (Tagliavini et al., 2006, Moretti et al., 2008). Proton NMR
spectroscopy was successfully used to characterize biomass burning aerosols in tropical environments (Decesari et al., ACP 2006), and was also proposed as a tool for source attribution of water-soluble organic aerosol including biomass burning, marine and SOA particles (Decesari et al., ES&T 2007). A better description of NMR techniques applied to aerosol samples will be carried out in next sections 2.4 and 2.5.
2.3 On-line techniques
The analytical techniques described above are suitable for time-integrated samples (using filters, impactors, etc.) analysed off-line (i.e., in laboratory). This implies the risk of positive and negative artifacts due to adsorption, evaporation, and chemical reactions during sampling, storing or during analysis in laboratory (e.g., Turpin et al., 2000; Schauer et al., 2003; Subramanian et al., 2004; Dzepina et al., 2007). Off-line techniques are particularly problematic when used on mobile observatories (e.g., research aircrafts). Therefore, on-line techniques, which provide real-time measurements, have revolutionized the chemical analysis of aerosols. The two main types of online techniques currently in use are PILS-WSOC and AMS with a growing interest in TD-PTR-MS ones.
Particle-into-liquid-samplers (PILS) collect particles into water for subsequent analysis (e.g., IC) (Weber et al., 2001; Orsini et al., 2003; Sullivan et al., 2004; Sorooshian et al., 2006a). A liquid TOC analyzer for continuous measurement of WSOC with a time resolution of a few minutes was coupled to a PILS instrument and deployed in several aircraft campaigns (e.g., Sorooshian et al., 2006a, b, 2007a, b; Peltier et al., 2007a; Weber et al., 2007).
Since the first studies using aerosol mass spectrometers (McKeown et al., 1991), the number of on-line MS techniques has rapidly increased, and scientific achievements of the AMS have been subject of several reviews (Noble and Prather, 2000; Sullivan and Prather, 2005; Canagaratna et al., 2007; Murphy et al., 2007). The operating principle of AMS involves the introduction of airborne particles into the instrument, followed by vaporization and ionization of the material before analysis of the ions using MS. Particle beams can be introduced in the ion source under vacuum using nozzles, capillaries or aerodynamic lenses. The AMS instruments commercialized by Aerodyne Inc. were proven to be very useful for fast quantitative determination of non-thermally refractory aerosol chemical components (Jayne et al., 2000; Jimenez et al., 2003; Canagaratna et al., 2007). The AMS combines thermal desorption (flash evaporation) of the aerosol components and ionization of the desorbed components by electron impact (EI). Quantitative data for sulfate, nitrate, ammonium, chloride and organic matter concentrations can be achieved through standard AMS operations (Allan et al., 2003; Jimenez et al., 2003). The EI ionization at 70 eV upon vaporization at 600 °C
results in significant fragmentation of the OA fraction with complete loss of molecular ions. For this reason, individual compounds can hardly be identified by AMS. Conversely, the AMS provides the distribution of major molecular fragments, which can be linked to the bulk composition (e.g., the functional groups) of OA, in an analogous manner to some of the off-line techniques such as FTIR and NMR spectroscopy. On the other hand, the derivation of functional group distribution from the AMS fragmentation patterns is less straightforward with respect to the other two techniques.
Recently, the quadrupole in the AMS instrument was replaced by a time-of-flight mass analyzer (ToF-AMS) (Drewnick et al., 2005; DeCarlo et al., 2006). The high-resolution version (up to m/Δm ≈ 5000) of the ToF-AMS, or HR-ToF-AMS, allows the separation of isobaric ions. This facilitates the identification of mass fragments containing heteroatoms such as N or, and provides better differentiation of spectra of POA respect to SOA, resulting in improved accuracy of factor analysis for OA source apportionment (Ulbrich et al., 2009). The elaboration of HR-TOF-AMS data allows the determination of O/C, N/C, and H/C atomic ratios of organic matter directly and with high time resolution (Aiken et al., 2007).
Many of the above characteristics of AMS are unparalleled by any other aerosol instrument. The AMS has therefore become a standard for aerosol chemical observations, and the classification of observed AMS spectral patterns provided a new paradigm in categorizing ambient OAs. However, the information on OA chemical composition derived by the AMS is limited by the fact that the ionization method is highly destructive and complex chemical structure as well as the molecular weight distributions are completely lost during the analysis.
Over the last decade, alternative methods of desorption and ionization were investigated. Some of these designs were tested in field studies, while others were mainly employed in laboratory applications, primarily due to sensitivity limitations. The most promising technique is the Proton-Transfer Reaction Mass Spectrometry (PTR-MS, Holzinger et al., 2007) which was recently introduced to evaluate both the bulk composition and volatility of organic aerosol. In particular, the new Thermal-Desorption version of the instrument (TD-PTR-MS, Holzinger et al., 2010) consists of a modified commercial PTR-MS (Ionicon Inc., Innsbruck, Austria) equipped with both a gas and an aerosol inlet. The use of PTR-MS as detector for aerosol compounds is highly advantageous for the following various reasons: 1) PTR-MS is a relatively soft ionization technique and so many compounds do not fragment and are detected at their protonated mass (molecular weight +1); 2) PTR-MS is very sensitive and therefore low detection limits in aerosol analysis can be achieved; 3) virtually all compounds constituting the “organic carbon” fraction in aerosols can be detected, and 4) although compounds are only identified by their mass to charge ratio in the mass spectrometer
they can still be quantified at the ≈ 30% accuracy level because of the well-defined conditions in the drift tube and the fact that proton-transfer reaction rates are usually close to the ion-molecule collision rate when a reaction is energetically possible. Other techniques, such as the thermal desorption particle beam mass spectrometer (TDPBMS), capture particles in a cryo-cooled surface and then desorbs them by slow heating allowing volatility separation before MS analysis (Docherty and Ziemann, 2003; Lim and Ziemann, 2005). Finally laser-ablation mass spectrometers can analyze individual particles by using a laser to vaporize and ionize single particles followed by TOFMS (McKeown et al., 1991; Noble and Prather, 1996; Murphy, 2007) and allow the analysis of positive and negative ions simultaneously (Hinz et al., 1996). An instrument of this type, the aerosol TOF mass spectrometer (ATOFMS), is commercially available from TSI Inc. The OA fraction produces characteristic fragmentation patterns, but matrix effects make quantification difficult. Under certain conditions (e.g., matrix composition, instrument tuning), fragmentation in laser-ablation instruments can be reduced and higher-MW compounds, such as oligomers formed in chamber experiments, can be identified with this technique (Gross et al., 2006; Denkenberger et al., 2007).
2.4 Introduction to
1H-NMR analysis of organic aerosol
Despite its widespread application in all disciplines involving organic chemistry, Nuclear Magnetic Resonance (NMR) spectroscopy was rarely applied to the analysis of atmospheric aerosol. In fact, the relatively poor sensitivity with respect to mass spectrometric techniques makes NMR challenging for the analysis of µg-levels of airborne particulate organic matter. Nevertheless, starting from the pioneering studies of Havers et al. (1998) and Suzuki et al., (1998), the technique has gained interest in the last decade, especially for overcoming specific limitations inherent to the more diffused MS and FTIR methodologies.
Nuclear Magnetic Resonance Spectroscopy (NMR) is an analytical technique that allows obtaining detailed information on the molecular structure of organic compounds. It measures the electromagnetic radiation absorbed and released by spinning nuclei in molecules immersed in a strong magnetic field. 1H and 13C are the most common nuclei, but there are many others like 31P, 17O, 15N, 19F, etc.. Studies on aerosol samples were so far focused on mono-dimensional proton-NMR (1H-NMR) whereas the inherent low sensitivity of NMR based on nuclei other than 1H prevents at the moment their routinely implementation, although some tests with solid and liquid 13C-NMR techniques have been carried out.
In NMR spectroscopy, chemical information about molecular structures is inferred by observing the behavior of spinning atomic nuclei: depending on the electron density distribution around them,
nuclei absorb electromagnetic pulses with different frequencies allowing to distinguish adjacent functional groups contributing to the “chemical environment” of the nuclei. . The signal intensity in 1H-NMR spectra is proportional to the number of hydrogen atoms that generate it. Therefore, provided a sufficiently long relaxation time (a few seconds), it is therefore possible to perform a qualitative analysis or organic hydrogen in specific chemical structures starting from the integrals of the 1H -NMR peaks and using an a-specific internal standard.
The horizontal scale in 1H-NMR spectra reports the chemical shift (δ), which is the frequency difference of the signals of a defined proton compared to a reference signal:
δ i = (νi - νs)/ νs * 106
where νi and νs are the resonance frequencies of the proton i and of the reference proton s respectively. The reference signal is most often provided by an internal standard. Examples are tetramethyl-silane (TMS) for organic solutions and sodium 3-(trimethyldilyl-)-2,2,3,3-d4-proponiate (TSPd4) in the case of aqueous solutions. The frequency difference is very small, and is measured in parts per million (ppm). As already mentioned, the integrals of NMR bands is directly related to the moles of organic protons in the sample.
The advantage of 1H-NMR on vibrational spectroscopy (like IR or Raman) are:
a) little interference from inorganic salts and water. The resonance for H atoms from H2O, HDO, OH-, H3O+ (H-O groups) occur at 4.8 ppm from that of the internal standard. In water solutions the acidic H atoms from inorganic ions like sulfate and ammonia are exchanged with the molecules of the solvent and also contribute to the peak at 4.8 ppm. By contrast, the organic protons bound to carbon atoms do not exchange protons with water and exhibit response signals in a broader range (0 to 10 ppm), resulting in a spectrum which is only marginally affected by the signal of O-H. The main difficulty is encountered when the concentration of organic proton is much lower than that of O-H, because the strong signal from O-H lowers the detector gain, decreasing total sensitivity. This is typically the case for the analysis of atmospheric samples, in which large amounts of water are present while the amount of organic compounds is much lower. Increased sensitivity may be obtained by instrumental techniques, which suppress the H-O signal. This can be achieved by selective excitation of protons at 4.8 ppm (presaturation), followed by acquisition of the spectrum before the H-O signal relaxes. In this way, the solvent signal is suppressed or strongly attenuate in the final spectrum.
b) high resolution, which allows to distinguish individual compounds within the same chemical class. Contrary to IR, NMR analysis of mixtures of different compounds is straightforward. For 1