www. wsforum.org
Article
Urban freight transport measures: environmental evidences
from the cities
Francesco Russo1 and Antonio Comi 2,*
1
Department of Computer Science, Mathematics, Electronics and Transportation – Mediterranea University of Reggio Calabria / Feo di Vito, 89060 Reggio Calabria (Italy)
2
Department of Enterprise Engineering – Tor Vergata University of Rome / via del Politecnico 1, 00118 Rome (Italy)
E-Mails: [email protected] ; [email protected]
* Author to whom correspondence should be addressed; Tel.: +39-06-72597059; Fax: +39-06-7259-7053
Received: / Accepted: / Published:
Abstract: The paper, within the field of city logistics sustainability, recalls the overview of
measures to be implemented, in a “what if” framework, with strong references to the ex-post assessment carried out in order to support the definition of city logistics scenarios that should have to be evaluated ex-ante by simulation models. The analysis is done in relation to the goals of environmental sustainability to be pursued and the main characteristics of the analyzed cities (e.g. population, density).
Keywords: city sustainability, urban freight transport, city logistics, environmental impacts.
1. Introduction
Today, there is growing interest in the concepts of sustainable development and then on sustainable transport. Sustainable city logistics solutions have to be implemented in order to reduce the effects of freight transport without penalizing the life of the city. For example, as it happens in passenger mobility we can brave the problems related to externalities related to transport addressing to transit. It allows us to do not reduce accessibility and penalize the life of the city. At the same way, city logistics OPEN ACCESS
has to investigate the possible solutions that allow us to reduce externalities, to increase sustainability without damaging the city life.
Around the world, different types of city logistics measures have been proposed and implemented, but sometimes they have not given the expected results [1, 2]. Thus, as it happens in the analysis of passenger mobility, in which we have different classes of measures that can be implemented in relation to city structure and level of demand, the same should be desired for freight mobility.
The current development must be characterized by the definition of economic, environmental and social sustainability [3]. In fact, referring to the main accepted definition of sustainable development it
meets the needs of the present without compromising the ability of future generations to meet their own needs [4] and, thus, of sustainable transport a sustainable transport system is one that is accessible, safe, environmentally-friendly and affordable [5] - it is necessary to propose new development models.
Then, the rapid freight transportation increasing in urban and metropolitan areas contributes to congestion, air pollution, noise (environmental) and to raise logistic costs, and hence the price of products (economic). In addition, a combination of different types of vehicles on the road increases the risk of accidents (social). Importantly, the objectives of sustainable development can be pursued by means of measures that are sometimes conflicting, and generate impacts that are influenced by the acceptance of stakeholders and external factors.
In this context, the paper, within the field of environmental sustainability, recalls the overview of measures to be implemented, in a “what if” framework, with strong references to the ex-post assessment carried out in order to support the definition of city logistics scenarios that should have to be evaluated ex-ante by simulation models (Figure 1). The study presents the empirical relations among outcomes (e.g. reduction of greenhouse gas – CO2 - or air pollutant emissions – CO, NOx, SOx, PM) and city logistics measures. The trends of expected results related to environmental sustainability in function of city characteristics will be deepened. From this type of analysis, it will be possible to identify the maximum expected reduction of externalities obtainable from a given city logistics measure in relation to a specific city.
Figure 1. City logistics ex-post and ex-ante assessment.
Revealed data E x-post asse ssm ent Ex-ante assessment A gg re ga te / D is ag gr eg at e m ea su re s Im pl em en tin g m ea su re s D ata co lle cting model data
2. Urban Freight Transport and City Logistics measures
As confirmed by several empirical studies the total urban freight vehicles account for 6 – 18% of total urban travel [6, 7, 8] and for 14% of vehicle-kilometers, 19% of energy use and 21% of CO2 emissions [9]. Some studies have also evidenced the importance of light vehicle against the heavy in the production of negative impacts within urban areas [10]. Others have studied the impacts due to the implementation of measures in order to shift logistics operations to night-time hours [11] or to the implementation of an urban distribution center verifying that it can be more effective in reducing environmental externalities than policies based on vehicle fleet renewal [12] or to the implementation of governance measures, such as access restrictions and charging scheme, that can cause some important changes in freight transport patterns [13].
It has to be also noted that in some cases it was difficult to quantify the impacts due to the implementation of recalled measures, at least for two reasons. For one hand, as several authors agree, the implemented measures are not yet fully validated for lack of interest by local authorities. For the other hand, there is a shortage of data. In a few cases comprehensive surveys have been carried out.
In order to make urban mobility more sustainable, measures to reduce the economic, social and environmental impacts of freight transport have to be implemented. Thus, the analysis and classification of implementable measures has to do taking into account the possibility to use methods and models for the ex-ante assessment. As proposed by Russo and Comi [14], a general modeling framework should allow us to simulate the choices of each decision-maker involved in the urban freight transport and logistics and to investigate how the policies and the following measures can influence her/his choices. In particular, the urban freight demand modeling is part of a general transportation modeling framework commonly used to assess and design the urban transportation system [15]. The used transportation models are also characterized in relation to their based assumptions, whether they represent user behavior or whether they are only statistical relations. Thus, there are descriptive models (empirical relations between freight demand and variables of the economic and transportation system), and behavioral models, in which there are explicit hypotheses on the decision-makers involved in the choices. It may be noted that for some analytical functions both the models can have the identical form. A recent overview of how models allow us to obtain behavioral solutions from descriptive data is given by Russo and Vitetta [16].
Respect to the city logistics measures, a classification that allows us to point out the involved decision-makers, outcomes and goals, planning horizons should be desirable. Then, we refer to that proposed by the authors in previous studies [17, 18]. Their classification should allow, in an easy way, to aggregate and analyze the city logistics measures respect to who takes the decision (public authorities, private company, public-private partnership) or which links of logistics system are interested (producer-wholesaler, wholesaler-retailer, producer-retailer), and which class of goals or outcomes can be pursued by their implementation.
The used classification of measures consists of four classes:
• material infrastructures, consisting of building new infrastructures in order to optimize the freight transport (e.g. urban distribution center, sub-network only for freight vehicles);
o goals: to increase sustainability within the urban area by building new features (linear and surface) in order to optimize freight transport;
o planning horizons: strategic (or tactical);
• non-material infrastructures, consisting, generally, of solution related to research, learning and training, while we also consider the telematics in terms of Intelligent Transportation System (ITS);
o impacted decision makers: local government, logistics and transport operators;
o goals: to improve effectiveness (in terms of high service levels) and efficiency (in terms of cost reduction) of logistics flows, and reduce negative externalities, also improving enforcement efficiency and broadening the scope of enforcement;
o planning horizons: tactical and operative (sometimes strategic e.g. traffic monitoring);
• equipment, consisting of the introduction of new standards for loading and transportation units;
o impacted decision makers: logistics and transport operators;
o goals: to optimize handling and transport by new low-emission vehicles (loading units); to reduce environmental impacts of transport units (e.g. reduction in truck emissions and use of electric vehicles, methane vehicles, metropolitan railways, trams);
o planning horizons: strategic or tactical or operative
• governance, consisting of the actions related to traffic regulations and limits; o impacted decision makers: logistics and transport operators;
o goals: to reduce the interference with other components of urban mobility, to reduce the number of driving vehicles;
o planning horizons: strategic or tactical or operative.
This used framework mainly refers to specific measures and not to cross measures, such as measures related to promotion, cooperation and enforcement which need different types of models to assess. For more details on implementation steps and/or difficulties encountered, the reader can refer to large literature on this topic [19, 20, 21 and references quoted therein].
3. Results and Discussion
Starting from the ex-post analysis of implemented city logistics scenarios in Europe in the last 6 years, some environmental indicators will be proposed in order to support the definition of freight planning within the urban transport planning. Moreover, sustainable transportation is difficult to measure directly so various performance indicators could be used to evaluate them. For example, pollutants can be directed measured or not, and then we can have direct (e.g. NOx) or indirect (e.g. CO2) measures.
In order to find possible relationships among city characteristics, city logistics measures and environmental outcomes (i.e. reduction of CO2 that, in general, can be assumed to be a proxy of air pollutant emissions; CO, NOx, SOx and PM), a depth desk-research has been carried out. It has to note that, in the paper, we mainly refer to European cities and to urban structure (location) typically found
in Europe and in the East coast of North American (USA and Canada) and Australia. Although around the world we found very different urban structures characterizing the megalopolis of countries as China, India, Central and South American, and Africa that differ from European cities (in terms of population and width), many of the results presented in the paper can be extended to other metropolises that can be considered extensions of cities.
The Table 1 lists the investigated cities with the impacted population and density. It should be noted that, generally, in the cities we find a city logistics scenario defined as mix of previous recalled measures. Thus, it makes the identification and quantification of specific measure outcomes near to very difficult. Thus, only the cities, where the outcomes related to a given measure can be extracted with a good approximation, have been considered. Moreover, the city center is interested by both passenger and commercial vehicles, but many times the local administrators implement the city logistics scenario without modifying the passenger regulations. Then, the outcomes related to freight due to city logistics scenario implementation can be estimated. Moreover, it should be noted that the following analyses are only based on data and ex-post assessment directly available in literature.
Table 1. Characteristics of investigated cities
City Population * [inhabitants] Density * [inh./km2] Amsterdam 767,849 4,618 Bordeaux 215,374 4,672 Bremen 547,685 1,676 Bristol 433,100 3,639 Canton Thurgau 244,33 247 Enschede 157,321 1,116 Genoa 59,883 2,5 Gothenburg 240,000 5,714 Gyır 130,476 731 Kassel 194,774 1,824 La Rochelle 76,711 2,737 Lisbon 564,657 6,643 London 1,806,200 10,792 Lucca 84,939 458 Milan 77,000 9,39 Padua 213,941 2,304 Paris 2,203,817 20,909 Regensburg 150,003 1,845 Rome 55,000 9,167 Siena 54,391 461 Sorrentina Peninsula 84,827 1,156 Stockholm 1,440,000 1,176 Tilburg - Eindhoven 214,036 2,441 Utrecht 16,596 3,093 Vilnius 560,192 1,397 Zurich 1,284,052 743
* impacted /involved by city logistics measures
The reduction of pollutants per month has been investigated for the following set of measures: material measures (i.e. sub-network, urban distribution center and nearby delivery area), non-material measures (i.e. intelligent transportation system), equipment measures (i.e. sustainable performance and railway) and governance measures (i.e. time windows and area-pricing).
The outcomes to be obtained by each measure are analyzed in function of specific characteristics of cities (e.g. population, density). In the following the results will be analyzed both for class of measures
(aggregate) and for specific ones (disaggregate). This analysis should be considered a pre-guide that should be a useful source of information to identify the measures which have the potential to be applied in a specific city. In other words, given a city the study wants to evidence the existing relations among environmental outcomes and city logistics measures.
3.1. Aggregate class outcomes
For each investigated city, the monthly reduction of CO2, CO, NOx, SOx and PM has been expressed as a function of attributes related to the city (i.e. population) and class of city logistics measures. For each city, the monthly reduction of greenhouse gas and air pollutants (ROPz) has been expressed as follows:
z POP ,z h,z h
h
ROP =β ⋅POP+
∑
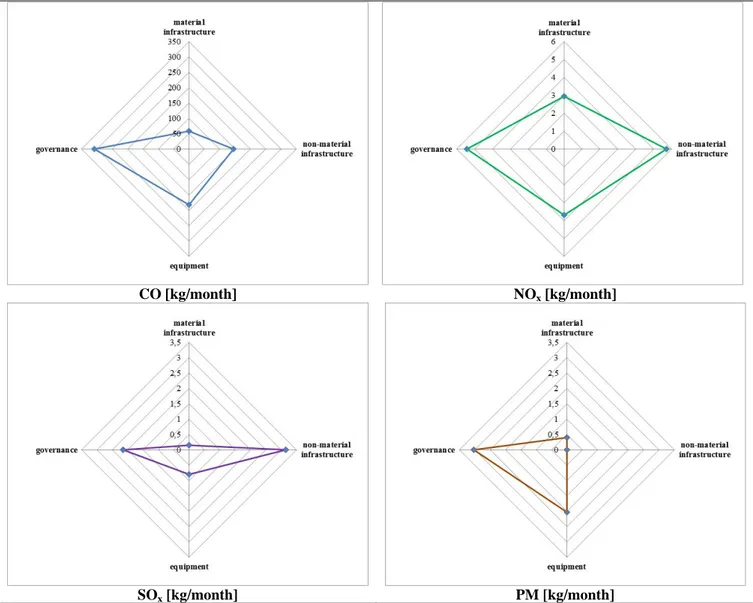
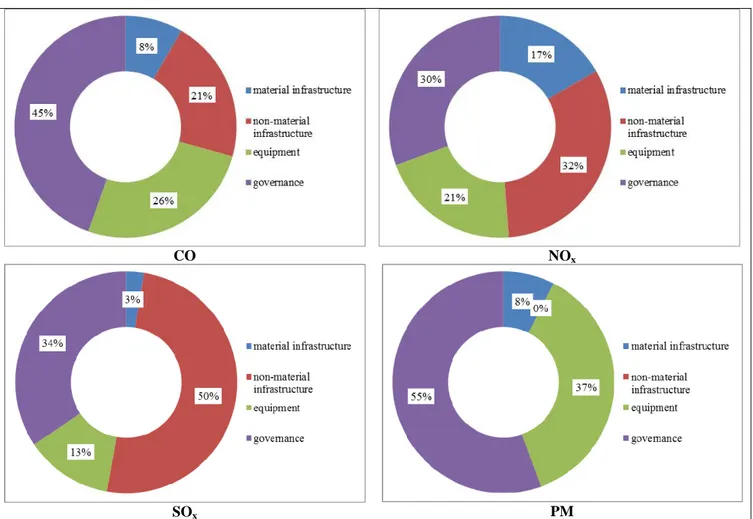
β ⋅X (1) where POP is the impacted population, Xh is a dummy variable specific for each class of city logistics measures h, and β.,h is the parameter to be calibrated.The following pictures (Figure 2 and 3) report the obtained results in terms of sustainable outcomes and allow us to do a comparison among the four measure classes. It should be noted that no available data have been found for PM reduction due to ITS implementation. In general, the material infrastructures measures produce averagely not good results. The best results could be obtained by the implementation of governance measures as well as time windows and area-pricing. This analysis does not consider the investment costs, but it has to note the investment costs are one of the most important factors for city logistics measures assessments. Further analyses are in progress in order to study the relationships between city logistics outcomes and investment costs.
The Figure 3 highlights, given a city, which could be the average contribution of each class of measures in relation to the sustainability goals. We can note that the incidence of non-material infrastructure is always higher than 32%, exception for CO emission for which is it is 21%. If we refer to the CO2 emission (it can be considered a proxy of energy consumption and air pollutant emissions), we can see that the better results are always given by non-material infrastructure, but similar results could be also obtained by equipment measures (Figure 4).
Figure 2. The monthly reduction of air pollutants for class of measures (direct measures).
CO [kg/month] NOx [kg/month]
Figure 3. The incidence of each class of measures on the monthly reduction of air pollutants
(direct measures).
CO NOx
SOx PM
Figure 4. The monthly reduction of greenhouse gas and incidence of each class of
measures (indirect measures).
3.2. Disaggregate measures outcomes
Starting from the previous aggregate results, the analysis has been deepened for each specific implemented measure. A monthly reduction index (IRz) has been calculated as follows:
,
z k z k
k
IR =
∑
β ⋅X (2)where IRz is the monthly reduction of greenhouse gas or air pollutant z (ROPz, see eq. 1) respect to density of the given city, Xk is a dummy variable specific for each city logistics measure k, and βk is the parameter to be calibrated.
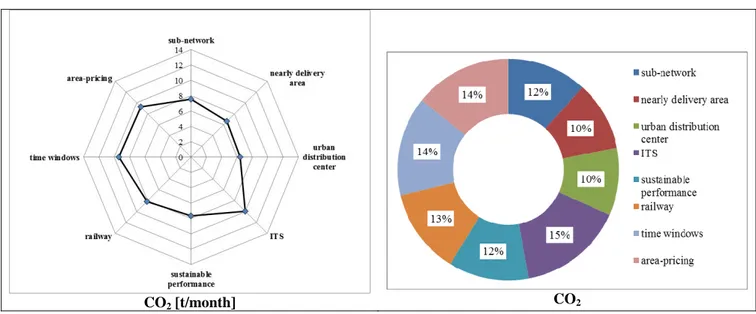
The results for greenhouse gas and air pollutants are reported in Figures 5 and 6. Given a city, the best results in terms of index reduction (i.e. monthly reduction respect to city density) could be obtained by sustainable performance and ITS and time window measures. The lower values refer to material infrastructure measures that also require high investments. Further analysis should be required to consolidate these first results.
The results show the large differences in the index among the analyzed city logistics measures; the material infrastructure (i.e. urban distribution center and sub-network) and equipment (i.e. sustainable performance) measures produce lower reduction of index than other classes of measures do. The non-material measures as well as governance measures allow us to obtain higher values of reduction.
In Figures 6, the estimated parameters have been plotted in a graph in order to better evidence the incidence of reduction of externalities that can be obtained by a given city logistics measure in relation to a specific city. The diagram evidences that, starting from the equipment measures (sustainable performance) toward higher-sustainable performance measures (railway), the higher values of monthly reduction of air pollutants could be obtained by governance measures (i.e. time windows or area-pricing) and ITS. These last measures are those that also present the lower investment costs. Finally, Figure 7 reports this analysis in terms of greenhouse gas emissions. It confirms the role that could have the ITS and governance measures against the air pollutant emissions.
Figure 5. The monthly reduction of greenhouse and air pollutants for measure (direct
measures).
CO [kg/month] NOx [kg/month]
Figure 6. The incidence of each measure on the monthly reduction of greenhouse and air
pollutants (direct measures).
CO NOx
SOx PM
Figure 7. The monthly reduction of greenhouse gas and incidence of each class of
measures (indirect measures).
4. Conclusions
This paper reviewed some city logistics measures that can be taken to regulate freight transport and logistics within urban and metropolitan areas. The focus is on that measures that have been frequently found around the European cities. The paper recalls a city logistics measure classification proposed by the authors, and analyses some ex-post assessments carried out in many cities around the Europe. The paper provides an outline of measures that can be considered by analyst in the definition of project/scenario in relation to the goals to be pursued in his community, and gives some environmental results for each measures (magnitude); in this way the analyst can have some main indications about the results that he can wait in his community by their implementation. Each measure has been interpreted in terms of actors/decision-makers involved, temporal reference scale (strategic, tactical, operational), theoretical expected goals and tested results (outcomes).
The study focuses on environmental goals to be expected by their implementations. The analysis has been deepened in terms of greenhouse gas and air pollutants. The indications of this study can be considered a useful guide for: city authorities when designing measures, need to verify whether their expected results match the results obtained in the other cities in the way of defined goals; experts, when designing and assessing city logistics scenario and needing to identify who must take decisions or who has to abide by them, with strong references to the goals of sustainability.
In fact, from public utility point of view, the most important aspect is to promote a sustainable development strategy, monitoring and controlling the different types of costs generated by freight mobility in the urban area. These costs are mainly connected with the impact on traffic congestion of vehicles circulating for freight transport, as well as of the road capacity reduction caused by vehicle stops for loading or unloading operations, and of goods vehicle pollutant emissions. Thus, in order to make urban mobility more sustainable, measures to reduce the impacts of freight transport have to be implemented. Consequently, for ex-ante assessment, identification and classification of implementable measures, and models useful for the simulation of different scenarios are required. Then, the paper has wanted to define a tool that can be used in order to define a first set of implementable measures that can be used to reach the environmental sustainability goals.
It should be also evidenced that governance measures have positive effects by the point of view of end-consumer actors, but they are often rejected by logistics operators because they could determine an increasing of transportation costs. Thus, it is important to recognize and adequately understand the concerns of different actors and their problem identification with respect to urban freight transportation in order to introduce city logistic policies successfully.
While some measures are easier to implement and at least show a higher degree of acceptability among stakeholders, they could require a sound surveillance system to enforce compliance. For this purpose a consultation forum or public-private partnership should be pursued.
The results obtained and described in the paper evidence that not high cost investments are required to obtain good results in terms of environmental goals. Further analyses are in progress in order to find relationships among outcomes and investment costs. Finally, other developments could aim to improve the presented results and to investigate the other fields of sustainability (i.e. economic and social) in order to verify if relationships similar to those presented for environmental sustainability exist. Analogously, other fields within the environmental sustainability should be investigated such as noise, view and so on.
Conflict of Interest
The authors declare no conflict of interest.
References
1. Schoemaker, J. BESTUFS II – Improving attractiveness of cities with city freight solutions, 2006,
BESTUFS Consortium, www.bestufs.net..
2. BESTUFS - Good Practice Guide on Urban Freight, 2007, BESTUFS Consortium, www.bestufs.net.
3. European Commission (2001). A Sustainable Europe for a Better World: A European Union
Strategy for Sustainable Development. Commission of the European Communities, Bruxelles.
4. Brundtland Commission (1987). Our Common Future. Oxford University Press.
5. ECMT (2004). Assessment and Decision Making for Sustainable Transport. European Conference
of Ministers of Transportation, Organization of Economic Coordination and Development, www.oecd.org.
6. Cambridge Systematics. Accounting for commercial vehicles in urban transportation models,
2004, http://tmip.fhwa.dot.gov/ clearinghouse/docs/accounting.
7. Hunt, J.D., Stefan, K.J., Brownlee, A.T., McMillan, J.D.P., Farhan, A., Tsang, K., Atkins, D., Ishani, M. A commercial movement modelling strategy for Alberta’s major cities. Paper presented at the 2004 Annual Conference of the Transportation Association of Canada, 2004, www.calgary.ca.
8. Figliozzi, M. A. (2010). The impacts of congestion on commercial vehicle tour characteristics and costs. Transportation Research Part E 46 (4), 2010, Elsevier Ltd, pp. 496-506.
9. Schoemaker, J., Allen, J., Huschebek, M., and Monigl, J. Quantification of Urban Freight
Transport Effects I, 2006, BESTUFS Consortium, www.bestufs.net.
10. Browne, M., Allen, J., Nemoto, T., Visser, J. Light goods vehicles in urban areas. Procedia -
Social and Behavioral Sciences 2 (3), 2010, E. Taniguchi and R. G. Thompson (eds.), Elsevier
Ltd, pp. 5911-5919.
11. Sathaye, N., Harley, R. and Madanat, S. Unintended environmental impacts of nighttime freight logistics activities. Transportation Research Part A 44 (8), 2010, Elsevier Ltd, pp. 642-659.
12. Filippi, F., Nuzzolo, A., Comi, A. and Delle Site, P. Ex-ante assessment of urban freight transport policies. Procedia - Social and Behavioral Sciences 2 (3), 2010, E. Taniguchi and R. G. Thompson (eds.), Elsevier Ltd, 6332-6342.
13. Comi, A., Delle Site, P., Filippi, F. and Nuzzolo, A. Ex-post assessment of city logistics measures: the case of Rome. In Transport management and land-use effects in presence of unusual demand, L. Mussone and U. Crisalli (eds.), 2011, Franco Angeli, Milan, Italy, pp. 241-258.
14. Russo, F. and Comi, A. (2010). A modelling system to simulate goods movements at an urban scale. In Transportation 37 (6), Springer Science+Business Media, LLC, 987-1009.
15. Cascetta, E. (2009). Transportation Systems Engineering: Model and Application, Springer. 16. Russo, F. and Vitetta, A. (2011). Reverse assignment: calibrating link cost functions and updating
demand from traffic counts and time measurements. In Inverse Problems in Science and
17. Russo, F. and Comi, A. Measures for sustainable freight transportation at urban scale: expected goals and tested results in Europe. Journal of Urban Planning and Development 137 (2), 2011, American Society of Civil Engineers (ASCE), pp. 142-153.
18. Russo, F. and Comi, A. A Model System For The Ex-Ante Assessment Of City Logistics Measures. Research in Transportation Economics 31 (1), 2011, Elsevier Ltd, pp. 81-87.
19. LEAN. Integration of LEAN LOGISTICS in urban multimodal transport management to reduce
space demand and optimise use of transport mode. European Commission, 1998,
http://cordis.europa.eu/transport/src/lean.htm.
20. Dasburg, N. and Schoemaker, J. Quantification of Urban Freight Transport Effects II, 2008, BESTUFS Consortium, www.bestufs.net.
21. Browne, M., Allen, J. and Attlassy, M. Comparing freight transport strategies and measures in London and Paris. In International Journal of Logistics Research and Applications 10 (3), 2007, Taylor & Francis, pp. 205-219.
© 2011 by the authors; licensee MDPI, Basel, Switzerland. This article is an open access article distributed under the terms and conditions of the Creative Commons Attribution license (http://creativecommons.org/licenses/by/3.0/).