Unsaturated Soils – Alonso & Gens (eds) © 2011 Taylor & Francis Group, London, ISBN 978-0-415-60428-4
Comparison between the in situ and laboratory water retention
curves for a silty sand
A. Askarinejad, F. Casini, P. Kienzler & S.M. Springman
Institute for Geotechnical Engineering, ETH Zürich, Switzerland
ABSTRACT: After an extreme rainfall event in May 2002 a series of landslides occurred in Ruedlingen
in Canton Schaffhausen, North Switzerland. A 38° steep slope has been chosen in this area beside the
river Rhine to carry out an artificial rainfall experiment to investigate the dependence between rain-fall, suction, saturation and shear resistance. Two sprinkling experiments were conducted to represent
an extreme rainfall event, the second of which resulted in failure of 130 m3 of the slope. Several cycles of
wetting and drying were applied to the soil and suction and volumetric water content were measured at different depths in three locations of the slope, by which in-situ Water Retention Curves (WRC) can be derived. The WRC of an undisturbed sample was also determined from laboratory test. The in situ and laboratory WRCs are compared in this paper and the differences will be discussed.
2 TEST FIELD
The selected experimental area is a steep, forested slope in Ruedlingen, North Switzerland, where 42 surficial landslides occurred (Fischer et al. 2003) in spring 2002, after an extreme rainfall (100 mm fell in 40 minutes).
To investigate the hydrological and mechanical behaviour of the slope, a sprinkling experiment was carried out in autumn 2008. This test was fol-lowed by a triggering experiment in spring 2009. This paper is based on the data from the first test. 2.1 Geometry
The selected experimental area is located on an east facing slope on the banks of the river Rhine (Springman et al. 2009). The altitude is about 350 masl. The average gradient of the slope was determined using a total station theodolite to be 38°. During the preliminary investigations, sand-stone and marlsand-stone were located at a depth of between 0.5 m to more than 5 m along the 30 m × 7.5 m plan section.
2.2 Infiltration characteristics
Infiltration characteristics were evaluated with combined sprinkling and dye tracer tests. The tests were replicated across three different locations near to the investigated area (TP 3, TP 4, TP 5; Figure 1). The experiments revealed high infiltration capacity of the soil. No overland flow was observed during the sprinkling at any of the three locations. After 1 INTRODUCTION
The stability of slopes depends directly on the distribution of pore pressures inside its mass. This distribution can be strongly influenced by rain-fall due to the infiltration of water into the slopes (Alonso et al. 1995). The description, quantifica-tion and study of soil water flow processes leads to a consideration of the hydraulic properties of unsaturated soils. This involves the relationship between the soil water content, the hydraulic con-ductivity, and the soil water retention function, which relates the soil water content to the capillary suction (Braddock et al. 2001).
Soil water retention can be determined both in the laboratory and in the field. In the former, both values of suction and water content are measured in the same sample, while in the field the measure-ments are done at two different points and over different soil volumes.
The differences between insitu and laboratory WRCs have been investigated and attributed to inadequate representation of large pores in labora-tory, scale effects in the sample, disturbance, the spa-tial variability of the soil, hysteresis and overburden pressure (Field et al. 1985; Shuh et al. 1988).
Several cycles of wetting and drying were applied to the soil, suction and volumetric water content were measured at different depths in three loca-tions of the slope, by which in-situ Water Reten-tion Curves (WRC) of the soil were derived. The WRC of undisturbed sample was also determined from laboratory tests and will be compared with the insitu results in this paper.
excavation, flow paths of the infiltrated water were clearly visible by the dye patterns (Figure 2). In summary, the dye patterns showed complete and homogeneous saturation of the whole soil pro-file with only little preferential drainage and with perched saturation above the bedrock. With regard to the planned landslide triggering experiment, these results confirmed the high vulnerability of the slope to failure and led to expectations of a more deep-seated failure above the transition to bedrock rather than a more surficial failure that
is typical for many rainfall-induced landslides
(Springman et al. 2003).
However, stained fractures below the subsoil revealed that substantial drainage might occur into the bedrock, which may prevent complete saturation and failure of the instrumented slope (Springman et al. 2009).
2.3 Laboratory classification
The behaviour of soil was investigated under satu-rated and unsatusatu-rated conditions (Springman et al. 2009, Casini et al. 2010a & b). The average satu-rated permeability of soil was determined to be ksat= 1 * 10−7 m/s.
The grain-size distributions at different depths of TP2 are shown in Figure 3. The silt and clay frac-tions increase with depth, while the sand fraction decreases. The soil can be classified as Medium-Low plasticity silty sand (ML) according to USCS. The soil Water Retention Curve (WRC), which
links suction s = ua− uw and volumetric water
con-tent θw= Vw /V for a natural sample is presented in
Figure 4. The WRC was obtained under suction Figure 1. Test site plan showing dimensions and
posi-tion of Test Pits (TP).
Figure 2. Dye pattern in the middle section of TP5.
Figure 3. The grain size distribution at different depths of TP2.
Figure 4. Water retention curve of an undisturbed
controlled conditions with a Fredlund Apparatus (Perez Garcia et al. 2008). As the first step, a
suc-tion of s = 70 kPa was imposed to the sample and
some water was expressed from the soil. There-fore, the suction in the natural sample was less than 70 kPa. In the continuation step, the sample absorbed some water, following a scanning curve until reaching the main wetting and the main dry-ing durdry-ing desaturation (Figure 4).
The experimental points were fitted with the Van Genuchten (VG) model (1980):
θ θ θ θ α w w θ θ θ θ res wsat θθ θθwres n m s α =⎡ ⎣ ⎢ ⎡⎡ ⎣⎣ ⎤ ⎦ ⎥ ⎤⎤ ⎦⎦ 1 1 (+ )
where α, n, m are parameters while α > 0, m > 0,
n > 1 and m = 1 − 1/n. θwsat and θwres are the saturated
and residual volumetric water content, respectively. The values for the wetting and drying branch are reported in Table 1.
The air entry value is saev= 2.7 kPa for the drying
curve, which is consistent with the WRC expected for sandy soils (Lu and Likos, 2004).
2.4 Instrumentation
An extensive instrumentation plan was designed to measure hydrological and geo-mechanical responses of the slope. Detailed measurements of soil suction, water level and soil volumetric water content were measured combined with an investigation of subsurface flow at the lowest part of the slope by means of tracer experiments. Deformations were monitored during the experi-ment, both on the surface via photogrammetrical methods and within the soil mass, using a flex-ible probe equipped with strain gauges at differ-ent points and two axis inclinometers on the top (Askarinejad 2009).
The instruments were installed mainly in three clusters over the slope. The instruments included jet-fill tensiometers, TDRs, Decagons, piezometers, soil temperature sensor, deforma-tion probes, earth pressure cells, acoustic sensors and rain gauges (Figure 5). The tensiometers were installed at depths of 15, 30, 60, 90, 120, and 150 cm below the ground surface in each cluster. Decagons were installed at shallow depths of
15 to 60 cm every 15 cm, and TDRs from 60 cm to 150 cm, with aspacing of 30 cm. All the instru-ments were calibrated and checked in the labora-tory for proper functioning before installation in the field.
The hydrological responses of the soil were measured during the experiment with logging interval of 5 minutes.
3 EXPERIMENTAL PROCEDURE
AND INSITU MEASUREMENTS 3.1 Applied rainfall
The artificial rainfall was applied by means of 10 sprinklers with the same spacing located on the middle longitudinal line of the field. The lower sprinklers experienced higher hydraulic heads as the water was supplied from the upper part of the slope. Therefore, the rainfall was not uniformly distributed. The average applied rain intensity is shown in Figure 6 a.
As indicated in this figure the rain was applied with an average intensity of 35 mm/hr for 3 hours as the first wetting phase (W1), followed by a 20 hour stop allowing the soil to drain (first drying phase—D1). Afterwards, the slope was sprinkled for 1.5 days with an average intensity of 17 mm/hr, which increased with a first shock of 45 mm/hr to average value of 30 mm/hr for another 1.5 days (second wetting phase—W2) and then the second drying phase started (D2).
Table 1. van Genuchten parameters for Ruedlingen silty sand.
θwsat [-] θwres [-] α [kPa-1] N [-]
Wetting 0.44 0.20 0.90 1.53
Drying 0.44 0.25 0.37 1.72
measurements respond without significant time discrepancy in all 3 depths. This verifies the high infiltration capacity of the soil obtained from the earlier hydrological investigations.
At some points during the second wetting phase of the rainfall, the changes in VWC and suction are not contemporaneous. This can be due to either the hysteretic effect of the soil–water reten-tion curve or the difference in the locareten-tion of the sensors at each depth.
In figures 6 b and c, at the beginning of the sec-ond drying phase (D2), the VWC drops as the suc-tion increases, but in cluster 2 at depth of 120 cm (Figure 6 d), the suction increases up to 2.5 kPa and only after this point the VWC starts to decrease. This point can be described as the air entry value of the WRC which is consistent with the value
derived from the laboratory test (saev= 2.7 kPa).
Figures 7 to 9 show the insitu WRC derived from Figures 6 b, c, & d respectively, compared with laboratory curve.
The first wetting branch (W1) shows higher val-ues of suction at the same VWC compared with first drying curve (D1), which is in contrast with the 50 40 30 20 10 0 R a in in te n s ity [mm/ h r] 0 1 2 3 4 5 6 S u ct io n [kP a] 0.2 0.3 0.4 0.5 V o lu m e tri c w a ter con ten t [-] Suction VWC 2 2.5 3 3.5 4 4.5 5 5.5 Su c ti o n [k P a ] 0.1 0.2 0.3 0.4 0.5 V o lu m e tri c w a te r co nt e n t [-] 10 /2 7/ 08 10 /2 8/ 08 10 /2 9/ 08 10 /3 0/ 08 10 /3 1 /0 8 1 1 /1 /0 8 -4 -2 0 2 4 6 8 Su c ti o n [k P a ] 0.1 0.2 0.3 0.4 0.5 V o lu m e tri c w a te r con te n t [-] a b c d W W D1 D2 D2 D2 D2
Figure 6. (a) Average applied rain intensity, (b) Vari-ations of volumetric water content and matric suction in cluster 1 at depth of 60 cm, (c) cluster 2 at depth of 30 cm, and (d) cluster 2 at depth of 120 cm.
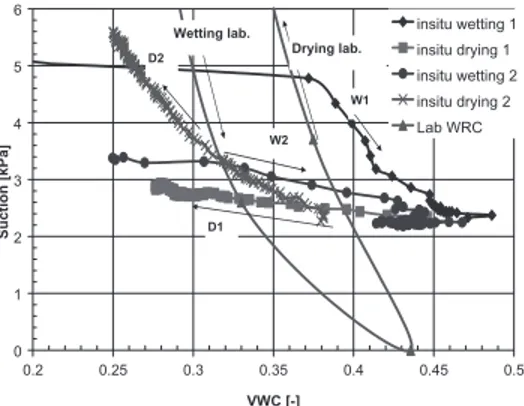
0 1 2 3 4 5 6 0.3 0.32 0.34 0.36 0.38 0.4 0.42 0.44 VWC [-] Su c ti o n [ k Pa ] insitu Wetting 1 Insitu Drying 1 insitu Wetting 2 Insitu Drying 2 Lab WRC D2 D1 W1 W2 Drying Lab. Wetting Lab.
Figure 7. Insitu water retention curve of cluster 1 at depth of 60 cm compared with laboratory results.
0 1 2 3 4 5 6 0.2 0.25 0.3 0.35 0.4 0.45 0.5 VWC [-] Suction [kPa] insitu wetting 1 insitu drying 1 insitu wetting 2 insitu drying 2 Lab WRC W1 W2 D1 D2 Wetting lab. Drying lab.
Figure 8. Insitu water retention curve of cluster 2 at depth of 30 cm compared with laboratory results. 3.2 Insitu water retention curves
Figures 6 b, c, and d show the variations of Volu-metric Water Content (VWC) and matric suction at three different depths of 30, 60, and 120 cm in clusters 1 and 2.
After changes in the intensity of applied rain-fall, the suction and volumetric water content
unsaturated-soils hysteresis theory (Mualem 1973). There are two hypotheses for this observation. i. As the soil is loose and the overburden pressures
are low, therefore, the volume of the soil could increase during the wetting due to reduction in effective stress (swelling), and on the other hand during the drying period, the soil volume decreases because of the build up of suction and increase in effective stresses.
ii. As the soil is granular and its response to the applied rainfall is relatively fast (medium to high permeability), small heterogeneity in the flow paths from the surface to the tensiometers and TDRs, like small channels due to dead roots, can affect the response time. Therefore, especially during the intense wetting phases, the readings of sensors at each time are maybe not exposed to the same conditions.
Also, it should be noted that tensiometers meas-ure suction in a thin soil layer around a ceramic cup of 7 cm length and a diameter of 2.2 cm, whereas a TDR measures soil volumetric water content in a cylindrical soil volume with a diameter and length of 5 cm and 15 cm, respectively.
There is also a possibility that the branches of W1, D1, and W2 in the insitu WRCs are not the main drying curves but are scanning curves. Accordingly, in order to be sure that the changes in suction and volumetric water content are on a main branch of the curve, the last drying part of the curves (D2) of clusters 1 and 2 at different depths has been compared with the drying branch of the curve obtained from the laboratory test. The results are presented in Figures 10 & 11.
In Figure 10, the laboratory curve is in quite good agreement with the insitu measurements. In cluster 1, the curves related to the depths of 120 cm and 90 cm show air entry values of around 2.2 kPa. This value is lower than the one implied by the laboratory WRC, which can be related to
the void ratio difference between the soil at these depths and the void ratio of the natural sample
tested in the laboratory (e = 0.8).
The insitu void ratio of the soil can be calculated from the volumetric water content under saturated conditions and using Equations 1 and 2.
θ = S n S = r ×n S S r ⇒θs S S ⇒θ s . ,n 1⇒ =⇒θθ 1 (1) e n n = − 1 (2)
The void ratios calculated from this approach are 1.04 and 0.96 at depths of 90 cm and 120 cm, respectively.
Similarly, in cluster 2 (Figure 11) at a depth of 120 cm, the air entry value is marginally higher than the one at 150 cm, while the soil has a lower void ratio at 120 cm compared with the one at 150 cm.
The data from figures 10 and 11 suggest that the trend lines of the insitu drying branches are less steep than the line from the laboratory results. 0 1 2 3 4 5 6 0.3 0.35 0.4 0.45 0.5 VWC [-] Suction [kPa] insitu wetting 1 insitu drying 1 insitu wetting 2 insitu drying 2 Lab WRC Wetting lab. W1 D1 W2 D2 Drying lab.
Figure 9. Insitu water retention curve of cluster 2 at
depth of 120 cm compared with laboratory results. Figure 10. Drying curve of insitu WRC for cluster 1
compared with laboratory results.
Figure 11. Drying branch of insitu WRC for cluster 2 compared with laboratory results.
This observation can be attributed to the fact that the laboratory curve has been derived from a one dimensional drainage path, while the insitu con-dition is a three-dimensional situation and the water can flow in different directions rather than only vertically, also it can be due to the different porosity of insitu and laboratory test. Therefore,
the differential water capacity defined as dθ /ds is
higher from field data than from laboratory data in the range of low soil water matric potentials. This should result in slower infiltration predictions based on the sorptivity from the laboratory data. These and similar observations indicate the need to pay more attention to the effects of scale on soil hydraulic properties (Pachepsky et al. 2001). 4 FURTHER TEST PLANS
In order to investigate the effect of cycles of wet-ting and drying on the void ratio of the soil, a series of tests will be performed on undisturbed samples from different depths of the slope profile, loaded to the same overburden pressures as in the field.
Also, more laboratory WRC tests will be done on undisturbed samples from different depths with higher resolution at higher VWCs and suctions lower than 15 kPa.
5 CONCLUSION
Two cycles of wetting and drying has been applied on a natural, steep, forested slope in northern Switzerland. At 3 different points of the slope, and at 6 depths, the values of volumetric water content and suction have been measured. Partial agreement was observed comparing the insitu values with a lab-oratory derived WRC on an undisturbed sample. In some of the insitu WRCs, it was observed that at the same water content, the wetting branch shows higher values of suction than the drying branch. This can be due to the change in void ratio of the soil during wetting and drying, to the heterogeneity of the soil along the flow path from the surface to the measure-ment depth of different sensors, and the difference in response time of different types of devices. The hypothesis of volume change and effect of initial porosity of the soil on the WRC will be investigated by testing samples with different void ratios.
The trend lines of the drying branches of insitu WRCs are less steep than the line from labora-tory results. This observation is attributed to the fact that the laboratory curve has been derived from a one dimensional drainage path, while three-dimensional flow is possible under situa-tion insitu condisitua-tion or also this can be related to the effect of sampling and needs to be verified by further laboratory tests.
ACNOWLEDGEMENTS
This research was funded by the Competence Centre for Environment and Sustainability (CCES) within the framework of the TRAMM—Project. Marco Sperl and Ernst Bleiker helped with the fieldwork. We are grateful to the Gemeinde of Rue-dlingen and their President Mrs. Katy Leutenegger for giving permission to carry out this experiment on their land.
REFERENCES
Alonso, E. Gens, A. & Lloret, A. 1995. Effect of rain infiltration on the stability of slopes. In Proc. of the
1st Intern. Conf. on Unsaturated Soils, Paris: 241–249.
Rotterdam: Balkema.
Askarinejad A. 2009. A method to locate the slip surface and measuring subsurface deformations in slopes.
4th Intern. Young Geotechnical Engineers’ Conf., Alexandria, Egypt: 171–174.
Braddock, R.D. Parlange, J.-Y. & Lee, J. 2001. Applica-tion of a soil water hysteresis model to simple water retention curves. Transport in Porous Media, 44: 407–420.
Casini, F. Jommi, C. Springman, S.M. 2010a. A labora-tory investigation on an undisturbed silty sand from a slope prone to landsliding. Granular Matter 12 (DOI: 10.1007/s10035-010-0182-y).
Casini, F., Minder, P., Springman, S.M., 2010b. Shear Strength of an unsaturated silty sand (this issue). Field, J.A. Parker, J.C. & Powell, N.L. 1985.
Compari-son of field- and laboratory measured and predicted hydraulic properties of soil with macropores. Soil Sci. 138: 385–396.
Fischer, C. López, J. Springman, S.M. 2003. Remedia-tion of an eroded steep slope in weathered sandstone after a major rainstorm. Intern. Conf. on Landslides,
Hong Kong: 878–883.
Lu, N. Likos, W. 2004. Unsaturated soil mechanics,
Wiley, New Jersey.
Mualem, Y. 1973. Modified approach to capillary hys-teresis based on a similarity hypothesis, Water Resour.
Res., 9: 1324–1331.
Pachepsky, Y. Rawls, W.J. & Giménez, D. 2001. Com-parison of soil water retention at field and laboratory scales. Soil Sci. Soc. Am. J. 65: 460–462.
Perez-Garcia, N. Houston, S.L. Houston, W.N. Padilla, J.M. 2008. An oedometer–type Pressure Plate SWCC Apparatus. Geotechnical Testing Journal 31: 1–9. Springman, S.M. Jommi, C. Teysseire P. 2003.
Instabili-ties on moraine slopes induced by loss of suction: a case history. Géotechnique, 53 (1): 3–10.
Springman, S.M. Kienzler, P. Casini, F. Asakrinejad, A. 2009. Landslide triggering experiment in a steep for-ested slope in Switzerland. 17th Intern. Conf. of Soil
Mech. & Geot. Eng. Alexandria, Egypt: 1698–1701.
Shuh, W.M. Cline, R.D. & Sweeney, M.D. 1988. Com-parison of a laboratory procedure and a textural model for predicting in situ water retention. Soil Sci.