doi:10.1016/j.ijrobp.2006.01.026
CLINICAL INVESTIGATION Brain
PATTERNS OF PRACTICE AND SURVIVAL IN A RETROSPECTIVE
ANALYSIS OF 1722 ADULT ASTROCYTOMA PATIENTS
TREATED BETWEEN 1985 AND 2001 IN 12 ITALIAN RADIATION
ONCOLOGY CENTERS
S
TEFANOM
ARIAM
AGRINI, M.D.,* U
MBERTOR
ICARDI, M.D.,
†R
ICCARDOS
ANTONI, M.D.,
‡M
ARCOK
RENGLI, M.D.,
§M
ARCOL
UPATTELLI, M.D.,
储I
NESC
AFARO, M.D.,
¶S
ILVIAS
COCCIANTI, M.D.,** C
LAUDIAM
ENICHELLI, M.D.,
††F
ILIPPOB
ERTONI, M.D.,
‡‡R
ICCARDOM
AURIZIE
NRICI, M.D.,
§§V
INCENZOT
OMBOLINI, M.D.,
"M
ICHELAB
UGLIONE, M.D.,*
AND
L
UIGIP
IRTOLI, M.D.
¶¶*Department of Radiation Oncology, University of Brescia, Brescia;†Department of Radiation Oncology, University of Turin,
Turin;‡Section of Radiation Oncology, Department of Biopathology and Imaging, University of Tor Vergata, Rome;§Department
of Radiation Oncology, University of “Piemonte Orientale,” Novara;储Department of Radiation Oncology, University of Perugia, Perugia;¶Department of Radiation Oncology, Istituti Ospitalieri, Cremona; **Department of Radiation Oncology, University of
Florence, Florence;††Department of Radiation Oncology, S. Donato Hospital, Arezzo;‡‡Department of Radiation Oncology,
Policlinico di Modena, Modena;§§Department of Radiation Oncology, University “La Sapienza,” Rome;"Department of Radiation
Oncology, University of L’Aquila, L’Aquila; and¶¶Section of Oncologic Radiology and Radiotherapy, Department of Human
Pathology and Oncology, University of Siena, Siena, Italy
Purpose: To analyze the patterns of practice and survival in a series of 1722 adult astrocytoma patients treated in 12 Italian radiotherapy centers.
Methods and Materials: A total of 1722 patients were treated with postoperative radiotherapy (90% World Health Organization [WHO] Grade 3– 4, 62% male, 44% aged >60 years, 25% with severe neurologic deficits, 44% after gross total resection, 52% with high-dose radiotherapy, and 16% with chemotherapy). Variations in the clinical–therapeutic features in three subsequent periods (1985 through 2001) were evaluated, along with overall survival for the different subgroups.
Results: The proportion of women, of older patients, of those with worse neurologic performance status (NPS), with WHO Grade 4, and with smaller tumors increased with time, as did the proportion of those treated with radical surgery, hypofractionated radiotherapy, and more sophisticated radiotherapy techniques, after staging procedures progressively became more accurate. The main prognostic factors for overall survival were age, sex, neurologic performance status, WHO grade, extent of surgery, and radiation dose.
Conclusions: Recently, broader selection criteria for radiotherapy were adopted, together with simpler tech-niques, smaller total doses, and larger fraction sizes for the worse prognostic categories. Younger, fit patients are treated more aggressively, more often in association with chemotherapy. Survival did not change over time. The accurate evaluation of neurologic status is therefore of utmost importance before the best treatment option for the individual patient is chosen. © 2006 Elsevier Inc.
Gliomas, Radiotherapy, Patterns of practice.
Reprint requests to: Stefano Maria Magrini, M.D., Brescia Uni-versity, Department of Radiation Oncology, Istituto del Radio “O. Alberti,” Spedali Civili, Piazzale Spedali Civili 1, Brescia I-25123, Italy. Tel: (⫹39) 030-3995271; Fax: (⫹39) 030-396700; E-mail: [email protected]
Supported in part by a grant from the Italian Ministry of Edu-cation, University and Research (no. 2001068774_004).
Acknowledgments—The authors thank Dr. Michael Brada, Profes-sor of Clinical Oncology, from the Institute of Cancer Research and the Royal Marsden Hospital, London, United Kingdom, for helpful suggestions and criticism. In addition to the authors, many colleagues from the participating institutions collaborated in the data collection and analysis process, or in the revision of the
manuscript. They are: Rita Bagnoli, M.D. (Arezzo); Debora Beldì, M.D. (Novara); Pierluigi Bonfili, M.D. (L’Aquila); Patrizia Ciam-melli, M.D. (Torino); Valeriana De Sanctis, M.D. (University “La Sapienza”, Rome); Patrizia Giacobazzi, M.D. (Modena); Cristina Mantovano, M.D. (Torino); Laura Masini, M.D. (Novara); Clelia Miracco, M.D. (Siena); Mattia Falchetto Osti, M.D. (University “La Sapienza,” Rome); Fabiola Pajar, M.D. (Florence); Pietro Ponticelli, M.D. (Arezzo); Dafne Ramundo, M.D. (Modena); Gio-vanni Rubino, M.D. (Siena); Andrea Somensari, M.D. (Cremona); Sandro Tonoli, M.D. (Brescia); and Maurizio Valeriani, M.D. (L’Aquila).
Received Oct 9, 2005, and in revised form Dec 31, 2005. Accepted for publication Jan 18, 2006.
0360-3016/06/$–see front matter
INTRODUCTION
Despite important advances in neuroimaging, surgery, radi-ation therapy, and chemotherapy, the prognosis of patients with malignant astrocytomas is still very poor (1, 2).
Surgery followed by high-dose radiotherapy is consid-ered the standard treatment for high-grade astrocytoma (3– 5). More recently, the addition of chemotherapy (temozo-lomide) to radiotherapy for newly diagnosed high-grade glioma (HGG) patients has produced a statistically signifi-cant survival advantage (6). However, the results obtained are generally unsatisfactory and suggest exploration of new approaches to this very aggressive disease.
To evaluate the clinical and therapeutic management of malignant astrocytoma patients in Italy, 12 Italian radiation oncology centers decided to collaborate in the analysis of their patterns of practice during the last 2 decades, to create a background for future studies. This report is related to the decision to create a group for the study of central nervous system tumors, which was approved by the Steering Com-mittee of the Italian Society for Radiation Oncology in June 2005.
The data pertaining to 1722 patients treated for primitive glial tumors (World Health Organization [WHO] Grade 1– 4) were collected and used for survival analysis (7).
METHODS AND MATERIALS
To analyze the patterns of practice and to better elucidate the variations in accrual, staging procedures, and treatment over time, the recruitment period was divided into three parts: 1985–1990, 1991–1996, and 1997–2001. Out of the 1,722 patients considered, 211 were treated in the first accrual period, 652 in the second, and 859 in the third. This is because the databases of the majority of the 12 participating centers did not date back to 1985, and two centers started their activity in the 1990s. When considering only the databases of the six centers contributing information on their patients consecutively treated since 1990, inclusive, the accrual for these tumors seems to be only slightly increasing (overall, 928 patients; average yearly accrual, 77 patients; range, 63– 83 pa-tients; accrual 1990 –1995, 450 patients, 48.5%; accrual 1996 – 2001, 478 patients, 51.5%).
These patients were treated according to the institutional policy of each center but without the strict selection criteria of a prospec-tive clinical trial. This is a largely unselected series, including approximately 90% high-grade and 10% low-grade astrocytomas. Forty-six percent of the patients with low-grade astrocytoma were aged ⬎50 years or had a neurologic performance status score (NPS) of 3 or 4, according to the Medical Research Council scale (8). Among WHO Grade 3 and 4 patients, approximately two thirds of the patients (68%) were aged⬎50 years or had an NPS score ⱖ3. This is at variance with most randomized trials and guidelines reports for high HGG, which include a much smaller proportion (ⱕ40%) of unfavorable patients (9).
Features of the centers
Twelve radiation oncology centers located in central and north-ern Italy participated in the analysis. Of these, nine are academic centers treating 500 –2000 patients per year, and three are regional
hospitals treating⬎1000 patients per year. The technical equip-ment in each institution includes at the time of this writing at least two high-energy treatment units and one three-dimensional (3D) treatment-planning system; however, the technological facilities have evolved in each center over time.
The fraction of all the new patients treated yearly for central nervous system tumors ranged, on average, for each center and during the evaluated period, from 1.7% to 9.1%.
The patients were usually referred for radiotherapy by the neu-rosurgeon and treated in accordance with different protocols in the different institutions and, within each center, according to the patient and tumor features. Nevertheless, all the centers were able to provide at least the basic data required for the pattern-of-practice study. Several meetings were held with the participating researchers to ensure the homogeneity of the data. In particular, the criteria chosen to reclassify histology according to the WHO classification, when needed, were clearly defined in “ad hoc” meetings.
The contribution of each center to the whole data set ranged from 1% to 21%.
No significant differences have been observed in the distribution of the different clinical and therapeutic features or in outcome between academic and regional institutions.
Patient and tumor features
Between 1985 and 2001, 1,722 patients aged 18 –91 years (median, 59 years), affected by histologically verified cerebral astrocytoma, underwent radiotherapy, after surgery, at the partic-ipating institutions. The original histology reports were reclassi-fied, when needed, according to the WHO classification (7); Grade 3 and Grade 4 tumors represent the overwhelming majority of the cases (18% and 72%, respectively). The male/female ratio for the entire series was 1.6/1 (1,070/652).
The NPS scores (Table 1) (8) at diagnosis, after surgery, and at the first and last follow-up visits after radiotherapy were collected or defined in retrospect from the clinical records, when possible. Owing to the retrospective nature of this study, data regarding the initial NPS scores were unavailable and/or could not be retrieved from the clinical records of the referring neurosurgical unit in a substantial fraction of the patients. Conversely, they were always obtainable after surgery from the clinical records of the radiother-apy departments participating to the study. The NPS scores at the first and last follow-up examinations after radiotherapy were also collected; however, mainly because two centers had a “no active follow-up” policy for these patients, these data were available only for approximately half of the patients. The fraction of cases with different NPS scores after radiotherapy was therefore calculated only for patients actively followed.
Table 1. Neurologic performance status
0–1 No or some neurologic deficit; function adequate for useful work
2 Neurologic deficit causing moderate functional impairment
3 Neurologic deficit causing major functional impairment
4 No useful function; inability to make conscious responses
Data on the Karnofsky performance status (10) were also col-lected, but they were even more incomplete and therefore are not reported here.
The site of origin of the tumor was detailed for each patient. Sites were defined as follows: frontal, parietal, temporal, occipital lobes, corpus callosum, periventricular area and basal ganglia, mesencephalon, and cerebellum. The involvement of two or more sites was also registered, with the dominant site specified. A single site was involved in 58.2%, two sites in 39.1%, and more than two sites in only 2.6% of the patients. Frontal lobes were most fre-quently involved (in 18.4% of the patients as a single site, plus in 18.9% as the dominant site when two or more than two sites were involved), followed by the parietal (12.2% single site, 15.4% dominant) and by the temporal lobes (18.1% single, 4.1% domi-nant). Overall, frontal, parietal, or temporal lesions (single or dominant) were present in 87.5% of the patients.
The largest diameter of the tumor as measured by the radiologist on the preoperative computed tomography (CT) and/or magnetic resonance imaging (MRI) scan (considering the entire lesion with the enhancing border, when present, but not the surrounding edema) was also retrieved from the original diagnostic report. Participating institutions agreed on this method of evaluating tu-mor diameter because it limits inter-institutional uncertainties.
Patient and tumor features for the whole series of 1,722 patients are summarized inTables 2and3.
Imaging procedures
Data were collected to analyze the imaging procedures used before surgery, after surgery, and at the first follow-up visit after radiotherapy (Table 4). The fraction of patients undergoing the different imaging procedures at the first examination after radio-therapy has been calculated considering only the total number of patients receiving active follow-up (n⫽ 1,252) and not the entire series (n⫽ 1,722), as specified previously.
Characteristics of treatment
The features of the treatments delivered are summarized in Table 5.
Before radiotherapy, all patients underwent different surgical procedures (biopsy only or partial or macroscopically radical re-moval of the tumor, respectively in 25%, 31%, and 44% of patients).
Approximately two thirds of the patients were treated with limited-volume radiotherapy: to the site of the disease with ade-quate margins, in one or two phases (64%), the remaining with whole-brain irradiation, with or without a boost (Table 5). Total
Table 2. Patients characteristics in the three accrual periods and for the entire series of 1722 patients
Factor Accrual period p 1985–1990 (n⫽ 211) 1991–1996 (n⫽ 652) 1997–2001 (n⫽ 859) All (n⫽ 1,722) Age (y) 0.000 ⱕ50 94 (45) 194 (30) 223 (26) 511 (30) ⬎50–ⱕ60 60 (28) 182 (28) 204 (24) 446 (26) ⬎60 57 (27) 276 (42) 432 (42) 756 (44) Gender Male 339 (66) 288 (65) 443 (58) 1,070 (62) 0.005 Female 172 (34) 158 (35) 322 (42) 652 (38) Initial NPS* 0.001* 0–1 36 (22) 117 (34) 88 (21) 241 (27) 2 103 (63) 151 (44) 185 (47) 439 (48) 3–4 25 (15) 78 (22) 126 (32) 229 (25) Unknown 47 306 460 813 Postsurgery NPS 0.000 0–1 125 (59) 264 (40) 323 (38) 712 (41) 2 52 (25) 278 (43) 380 (44) 710 (41) 3–4 34 (16) 110 (17) 156 (18) 300 (18)
First visit after radiotherapy NPS*† 0.04*
0–1 86 (64) 208 (53) 180 (50) 474 (54)
2 36 (27) 123 (31) 113 (32) 272 (31)
3–4 12 (9) 62 (16) 66 (18) 140 (15)
Unknown 77 259 500 836
Last visit after radiotherapy NPS*† 0.1*
0–1 55 (45) 108 (32) 113 (38) 276 (36)
2 39 (32) 121 (36) 84 (28) 244 (32)
3–4 26 (23) 108 (32) 102 (34) 236 (32)
Unknown 91 315 560 966
Abbreviation: NPS⫽ neurologic performance status.
Significance of the differences between periods for each factor analyzed were tested with the chi-square test. Percentages (in parentheses) refer to the total number of patients in each accrual period.
* Missing values are not considered for the calculation of the significance of the differences, nor in the computation of percentages.
†For the data on NPS at the follow-up visits after radiotherapy, only the patients with sound information in the clinical records out of
doses ranged from 5 to 74 Gy (average, 54.8 Gy; median, 60 Gy). The vast majority of the patients were treated with fraction doses in the range of 1.8 –2 Gy (conventional fractionation, 88%). Beam
energy was that of a cobalt unit in approximately half of the patients (45%); 6-MV or⬎6-MV photons from a linear accelerator were used in 41% and in 13% of patients, respectively. The Table 3. Tumor characteristics in the three accrual periods and for the entire series of 1,722 patients
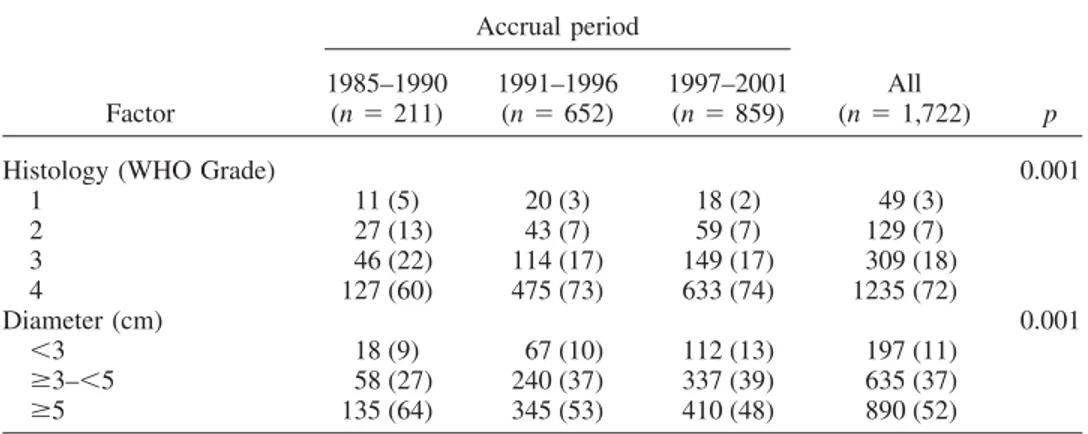
Factor Accrual period p 1985–1990 (n⫽ 211) 1991–1996 (n⫽ 652) 1997–2001 (n⫽ 859) All (n⫽ 1,722)
Histology (WHO Grade) 0.001
1 11 (5) 20 (3) 18 (2) 49 (3) 2 27 (13) 43 (7) 59 (7) 129 (7) 3 46 (22) 114 (17) 149 (17) 309 (18) 4 127 (60) 475 (73) 633 (74) 1235 (72) Diameter (cm) 0.001 ⬍3 18 (9) 67 (10) 112 (13) 197 (11) ⱖ3–⬍5 58 (27) 240 (37) 337 (39) 635 (37) ⱖ5 135 (64) 345 (53) 410 (48) 890 (52)
Abbreviation: WHO⫽ World Health Organization.
Significance of the differences between periods for each factor analyzed were tested with the chi-square test. Percentages (in parentheses) refer to the total number of patients in each accrual period.
Table 4. Imaging procedures in the three accrual periods and for the entire series of 1,722 patients
Imaging procedure Accrual periods p 1985–1990 (n⫽ 211) 1991–1996 (n⫽ 652) 1997–2001 (n⫽ 859) All (n⫽ 1,722) Before surgery Brain CT 163 (77) 336 (51) 216 (25) 715 (41) Brain MRI 2 (1) 53 (8) 118 (14) 173 (10) CT and MRI 46 (22) 263 (41) 525 (61) 834 (49) PET yes 2 (1) 2 (1) 5 (1) 9 (1) NS PET no 209 (99) 650 (99) 854 (99) 1,713 (99) SPECT yes 2 (1) 5 (1) 33 (4) 40 (2) 0.000 SPECT no 209 (99) 647 (99) 826 (96) 1,682 (98) After surgery 0.000 Brain CT 119 (57) 423 (65) 472 (55) 1,014 (59) Brain MRI 5 (2) 31 (5) 116 (14) 152 (9) CT and MRI 5 (2) 49 (8) 141 (16) 195 (11) Neither 82 (39) 149 (23) 130 (15) 361 (21) PET yes 1 (0.5) 1 (0.2) 0 2 (0.1) NS PET no 210 (99.5) 651 (99.8) 859 (100) 1,720 (99.9) SPECT yes 0 2 (0.3) 30 (3) 32 (2) 0.000 SPECT no 211 (100) 650 (99.7) 829 (97) 1,690 (98) After radiotherapy* 0.000 Brain CT 74 (42) 173 (35) 121 (22) 368 (30) Brain MRI 13 (7) 68 (14) 146 (27) 228 (19) CT and MRI 3 (2) 17 (3) 47 (8) 67 (5) Neither 87 (49) 241 (48) 235 (43) 563 (46) PET yes 1 (0.6) 5 (1) 0 6 (0.5) NS PET no 176 (99.4) 494 (99) 549 (100) 1,219 (99.5) SPECT yes 0 5 (1) 26 (5) 31 (3) 0.000 SPECT no 177 (100) 494 (99) 523 (95) 1,194 (97)
Abbreviations: CT ⫽ computed tomography; MRI ⫽ magnetic resonance imaging; NS ⫽ nonsignificant; PET⫽ positron emission tomography; SPECT ⫽ single photon emission computed tomography.
Significance of the differences between periods for each factor analyzed were tested with the chi-square test. Percentages (in parentheses) refer to the total number of patients in each accrual period. * For the data on imaging at the first follow-up visit after radiotherapy, only the 1,225 patients with sound information in the clinical records out of the 1,252 actively followed have been considered (refer to Methods and Materials).
majority of the patients were treated with a simple method of target identification (simulator, 64%); 24% had a two-dimensional (2D) and 12% a 3D plan. Data about more advanced techniques show that only a small fraction of the patients had conformal (16%) or stereotactic radiotherapy (0.1%).
Most patients (75%) were treated with steroid support during radiotherapy, and a limited number (272, 16%) received chemo-therapy. Single-agent chemotherapy was administered to 175 of 272 (64%). In decreasing order of frequency, nitrosoureas (81 patients, in 11 of whom the drug was administered intra-arterially), temozolomide (77 patients), lonidamine (9 patients), platinum deriv-atives (5 patients), and procarbazine (3 patients) were used. Te-mozolomide was almost exclusively used during the last period of accrual (76 of 77 cases), whereas nitrosoureas were used with the same frequency between 1990 and 2001 and only rarely before. The use of lonidamine was restricted to the 1985–1990 accrual period.
The remaining 97 chemotherapy-treated patients (36%) had combination chemotherapy. Nitrosoureas where used in combina-tion chemotherapy in 42 patients, vinca alkaloids in 31 patients, procarbazine in 25 patients, and platinum derivatives in 19 pa-tients. Procarbazine, vincristine, and CCNU (20 patients) was mainly administered.
Follow-up
The policy of follow-up was very different in the different centers, ranging from bimonthly visits and imaging (CT or/and MRI) to visits at different intervals (usually bimonthly to quar-terly) without imaging; two centers adopted a “no active follow-up” policy, sometimes collecting information from the general practitioner or not conducting any follow-up at all.
Part of the data about survival was collected from the statistical office of the patient’s city of residence, from the general practi-tioner, or from the relatives. Patients who did not have any visit Table 5. Treatment characteristics in the three accrual periods and for the entire series of 1,722 patients
Feature Accrual periods p 1985–1990 (n⫽ 211) 1991–1996 (n⫽ 652) 1997–2001 (n⫽ 859) All (n⫽ 1,722) Surgery 1,722 0.020 Biopsy 60 (28) 192 (29) 185 (22) 437 (25) Partial surgery 77 (37) 193 (30) 256 (31) 535 (31) Radical surgery 74 (35) 267 (41) 409 (48) 750 (44) RT volume 0.0000
Site of disease with margin 38 (18) 244 (37) 471 (55) 753 (44)
Site of disease with margin (two phases) 13 (6) 88 (14) 239 (28) 340 (20)
Whole brain 21 (10) 109 (17) 54 (6) 184 (10)
Whole brain and boost on the disease 139 (66) 211 (32) 95 (11) 445 (26)
RT total dose (Gy) 0.0000
⬍50 13 (6) 113 (17) 148 (17) 274 (16)
ⱖ50 ⬍60 60 (28) 219 (34) 270 (32) 549 (32)
ⱖ60 138 (66) 320 (49) 441 (51) 899 (52)
RT fraction size (Gy) 0.0000
⬍1.8 7 (3) 21 (3) 18 (2) 46 (3) 1.8 11 (5) 181 (28) 249 (29) 441 (26) 2 190 (90) 388 (59) 502 (59) 1,080 (62) 2.5–3 3 (2) 45 (7) 44 (5) 92 (5) ⬎3 0 (0) 17 (3) 46 (5) 63 (4) Beam energy 0.0000 Cobalt 60 101 (48) 305 (47) 386 (45) 792 (46) ⱕ6 MV 57 (27) 252 (39) 390 (45) 699 (41) ⬎6 MV 53 (25) 95 (14) 83 (10) 231 (13) RT plan 0.0000 Simulator 171 (81) 497 (76) 440 (51) 1,108 (64) 2D 40 (19) 143 (22) 223 (26) 406 (24) 3D 0 12 (2) 196 (23) 208 (12) Conformal techniques 0.0000 Yes 3 (1) 59 (9) 219 (26) 281 (16) No 208 (99) 593 (91) 640 (74) 1,441 (84) Chemotherapy 0.0000 Yes 19 (9) 76 (12) 177 (21) 272 (16) No 192 (91) 576 (88) 682 (79) 1,450 (84) Steroids 0.003 Yes 185 (70) 487 (72) 678 (78) 1,320 (75) No 56 (30) 165 (28) 181 (22) 402 (25)
Abbreviations: RT⫽ radiotherapy; 2D ⫽ two dimensional; 3D ⫽ three-dimensional.
Significance of the differences between periods for each factor analyzed were tested with the chi-square test. Percentages (in parentheses) refer to the total number of patients in each accrual period.
since the end of the treatment and for whom it was impossible to acquire sound information were considered lost to follow-up (ap-proximately 27% of the total number, 470 patients). This group of patients pertains mainly (401 of 470, 85%) to the two center that had a “no active follow-up” policy for this pathology; therefore, all the patients from these centers were excluded from the survival analysis. The median duration of follow-up for the remaining 1,321 patients was 238 days (range, 0 –5,801 days), with only 69 additional patients (5.2%) lost to follow-up and excluded from survival analysis. This left 1,252 patients available for survival analysis, with an average follow-up of 309 days (range, 1–5,801 days).
Patients not undergoing active follow-up or lost to follow-up were obviously also excluded from the evaluation of the postra-diotherapy pattern of practice.
It should be emphasized that, even with these precautions being taken, the quality-of-life data (neurologic status) can be considered less sound, owing to the differences in follow-up policies among the different centers.
Statistical analysis
The patterns of practice, the clinical, pathologic, and therapeutic features of the entire series, and the differences in their distribution in the three accrual periods previously defined were analyzed and their significance evaluated with the chi-square test.
Survival analysis was applied only to the 1252 patients receiv-ing active follow-up, as previously described, and their main features are reported inTable 6. The actuarial overall survival, not corrected for other causes of death, was calculated from the end of radiotherapy to the death date or to the last vital status information for living patients. Survival was calculated with the Kaplan-Meier method. Actuarial survival values in the different subsets were compared with the log–rank test (univariate analysis) and the Cox regression test (multivariate analysis). All the analysis was per-formed with the Statistical Package for the Social Sciences for Windows, version 12 (SPSS, Chicago, Ill.).
RESULTS Patterns-of-practice analysis
Patients and tumor features. During the most recent 10 years, an increase was evident in the fraction of patients aged ⬎60 years (27% during 1985–1990, compared with 50% during 1997–2001, p [chi-square] ⫽ 0.000) and of patients with worse initial NPS (score 3– 4 in 15% and 32% of patients treated 1985–1990 and 1997–2001, respectively, p [chi-square] ⫽ 0.001, Table 2). The same trend was evident for NPS registered after surgery and at the postra-diotherapy follow-up visits (Table 2). Although the data on the initial and the postradiotherapy NPS were flawed by a substantial number of missing values, it is interesting to note that the fraction of patients with the best NPS almost dou-bled after surgery, then remained stable up to the first follow-up visit, to decline again at the last postradiotherapy follow-up visit (Table 2).
A slight but significant increase in the fraction of female patients was also documented (Table 2).
Glioblastoma multiforme was the most frequent histologic subtype treated in the entire period (72%) and progressively
increased in frequency over time (p [chi-square] ⫽ 0.001,
Table 3).
The maximum tumor diameter at diagnosis progressively decreased with time; in particular, larger lesions (⬎5 cm) became less frequent (p [chi-square]⫽ 0.001,Table 3).
Imaging procedures. Brain CT scan was the main imag-ing procedure in all the accrual periods (used alone in 41% of the patients before surgery, in 59% after surgery, and in 30% after radiotherapy). A CT scan coupled with MRI or MRI alone was obtained, respectively, in 49% and 10% of the patients before surgery, 11% and 9% after surgery, and 5% and 19% after radiotherapy. One or more of these imaging procedures were always used for staging; approx-imately 60% of the patients had an MRI scan before sur-gery. However, no imaging procedure was used in 21% of the patients after surgery and in approximately half (46%) of them after radiotherapy (Table 4).
The increasing use of imaging and, in particular, of more sophisticated techniques was documented in the more recent years at diagnosis, before radiotherapy, and during follow-up. The fraction of patients not undergoing any imaging procedure decreased significantly in the subsequent accrual periods (p⫽ 0.000,Table 4). In addition, the data show that MRI is progressively replacing brain CT to evaluate brain tumors (Table 4).
These changes were less evident in the postsurgical phase of the diagnostic and therapeutic process.
Single photon emission computed tomography and posi-tron emission tomography were used in ⬍5% of the pa-tients, mainly during the last accrual period.
Treatment. Surgery became more often macroscopically radical with time (35%, 41%, and 48%, respectively, in the three periods, p [chi-square]⫽ 0.02,Table 5).
Radiotherapy was directed to smaller volumes in the most recent period compared with the previous ones (site of disease with margins, one or two phases: 83% of the pa-tients in the third period vs. 24% in the first period and 51% in the second, p [chi-square]⫽ 0.0000, Table 5).
A cobalt teletherapy source was used in approximately half of the patients throughout the three subsequent accrual periods; the fraction of the patients treated with ⬎6-MV beams decreased progressively among those treated with higher-energy beams from a linear accelerator (25%, 14%, 10%, p [chi-square]⫽ 0.0000, Table 5).
Bidimensional and 3D treatment planning, as well as conformal radiotherapy, were increasingly used in the last accrual periods (p [chi-square]⫽ 0.0000, Table 5).
The use of more sophisticated techniques seemed to be particularly relevant for patients treated with higher doses or with smaller fraction sizes. For example, the fraction of patients for whom 2D and 3D planning has been applied increased from 21% to 23% to 47% in the subgroups treated with total doses of ⬍50 Gy, 50–59 Gy, and ⱖ60 Gy, respectively; corresponding values for conformal treatments were 11%, 17%, and 17%. The use of simple plans (simu-lator only) was more frequent in patients treated with larger fraction sizes (ⱖ2.5 Gy, 87%) as opposed to the others
(62%); corresponding values for conformal treatments were 9% and 17%.
Total radiation doses ofⱖ60 Gy were used in the major-ity of the patients (52%), but the use of this dose level decreased in the last two accrual periods, after 1990 (from 66% to 49% and 51%, p [chi-square]⫽ 0.0000,Table 5). “Intermediate” doses (50 –59 Gy) were used in
approxi-mately the same proportion of patients in the three accrual periods (respectively, 28%, 34%, and 32%,Table 5). Thus, the decrease in the fraction of patients treated with the higher dose level was compensated by a parallel increase in the subgroup treated with the lowest doses (⬍50 Gy: 6%, 17%, and 17% in the three subsequent accrual periods, respectively).
Table 6. Median survival (in days) and percent surviving at 1, 2, and 5 years in the whole series of 1,252 patients actively followed and in the different clinical and therapeutic subgroups (Kaplan-Meier)
n (%) Median survival (d) p Percent survival⫾ SE 1 y 2 y 5 y All 1,252 299 38⫾ 1 17⫾ 1 7⫾ 0.8 Age (y) 0.0000 ⬍50 364 (29) 472 57⫾ 2 35⫾ 3 15⫾ 2 50–59 357 (29) 301 36⫾ 3 14⫾ 2 5⫾ 1 ⱖ60 531 (42) 227 26⫾ 2 7⫾ 1 ⬍1 Gender 0.02 Male 786 (63) 286 37⫾ 2 16⫾ 2 6⫾ 1 Female 466 (37) 311 42⫾ 2 20⫾ 2 8⫾ 1 Postsurgery NPS 0.0000 0–1 601 (48) 345 46⫾ 2 24⫾ 2 8⫾ 1 2 or 3–4 651 (52) 247 31⫾ 2 11⫾ 1 5⫾ 1 WHO Grade 0.0000 1 30 (2) 2,410 82⫾ 7 74⫾ 8 52⫾ 10 2 102 (8) 1,058 75⫾ 4 53⫾ 5 23⫾ 5 3 224 (18) 389 52⫾ 3 28⫾ 3 10⫾ 2 4 896 (72) 260 29⫾ 1 9⫾ 1 1⫾ 0.4 Tumor diameter (cm) 0.3 ⬍3 148 (12) 348 45⫾ 4 20⫾ 3 7⫾ 2 3–5 481 (40) 309 40⫾ 2 18⫾ 2 5⫾ 1 ⬎5 623 (48) 280 35⫾ 2 16⫾ 1 7⫾ 1 Surgery 0.0003 Biopsy 295 (24) 210 30⫾ 3 13⫾ 2 6⫾ 2 Partial 447 (36) 306 40⫾ 2 19⫾ 2 9⫾ 2 Radical 510 (40) 318 42⫾ 2 18⫾ 2 5⫾ 1 RT volume 0.0000
Site of disease⫾ boost 724 (58) 325 45⫾ 2 23⫾ 2 11⫾ 1 Whole brain⫾ boost 528 (42) 263 30⫾ 2 11⫾ 1 2⫾ 1
RT plan 0.2
Simulator 802 (64) 292 37⫾ 2 17⫾ 1 6⫾ 1
2D 273 (22) 284 39⫾ 3 16⫾ 2 6⫾ 1
3D 177 (14) 328 44⫾ 4 20⫾ 4 12⫾ 4
RT total dose (Gy) 0.0000
⬍50 183 (15) 146 15⫾ 3 6⫾ 2 2⫾ 1 50–59 290 (23) 312 42⫾ 3 24⫾ 3 14⫾ 1 ⱖ60 779 (62) 316 42⫾ 2 18⫾ 1 5⫾ 1 RT beam energy 0.06 Cobalt 60 470 (38) 276 34⫾ 2 15⫾ 2 6⫾ 2 ⱕ6 MV 565 (45) 310 42⫾ 2 17⫾ 2 7⫾ 1 ⬎6 MV 217 (17) 313 41⫾ 4 22⫾ 3 9⫾ 2
RT fraction size (Gy) 0.0000
ⱕ2 1,141 (91) 308 41⫾ 2 18⫾ 1 7⫾ 1 ⱖ2.5 111 (9) 197 16⫾ 4 6⫾ 2 3⫾ 2 Chemotherapy 0.02 Yes 231 (18) 358 49⫾ 4 23⫾ 3 5⫾ 2 No 1,021 (82) 284 36⫾ 2 16⫾ 1 7⫾ 1 Steroids 0.0000 Yes 998 (80) 272 35⫾ 1 15⫾ 1 5⫾ 1 No 254 (20) 374 51⫾ 3 27⫾ 3 11⫾ 2
Abbreviations as inTables 1,2, and4.
However, doses should be analyzed jointly as total dose and dose per fraction. The decrease in the use of the higher dose level during the more recent years is more understand-able when one considers the increase in the use of higher doses per fraction (ⱖ2.5 Gy) in the same accrual period (2%, 10%, and 10%, respectively, Table 5). In fact, of the 155 patients treated with doses per fractionⱖ2.5 Gy, 152 (98%) were treated after 1990 and 130 (84%) with doses ⬍50 Gy. As previously stated, these patients were treated more often than the others, with simpler treatment tech-niques. This same subgroup was characterized by a higher proportion of patients with NPS scores of 3 or 4 after surgery (37%, as opposed to 13% for the whole series, p [chi-square] ⫽ 0.0000) and of patients aged ⬎60 years (66%, as opposed to 44% for the whole series, p [chi-square]⫽ 0.0000).
Chemotherapy was increasingly used with time (p [chi-square] ⫽ 0.0000, Table 5). Chemotherapy was adminis-tered to 22% of the patients treated with total radiation doses ofⱖ60 Gy, as opposed to only 8% of those treated with lower radiation doses (p [chi-square]⫽ 0.0000). The use of chemotherapy was also strictly related to the NPS of the patient and was delivered to 21%, 13%, and 11% of the patients who after surgery had NPS scores of 0 –1, 2, and 3– 4, respectively (p [chi-square] ⫽ 0.0000). The group undergoing chemotherapy was characterized by a smaller proportion of patients aged⬎60 years (37% vs. 45% for the whole series, p [chi-square]⫽ 0.015).
The use of steroids also significantly increased with time (Table 5) and was particularly frequent in patients with worse NPS after surgery (69%, 79%, and 90%, respectively, in patients with NPS scores of 0 –1, 2, and 3– 4, p [chi-square]⫽ 0.000) and in those treated with lower radiation doses (83% and 75%, respectively, in patients treated with
⬍50 or ⬎50 Gy, p [chi-square] ⫽ 0.02). In the last accrual period (after 1996), the use of chemotherapy was twice as frequent in those patients not receiving steroids as in the others (22% vs. 11%).
Survival analysis
In the overwhelming majority of the 1252 evaluable patients, the cause of death was the tumor, and for this reason only the actuarial overall (uncorrected) survival was evaluated and is reported.
Univariate analysis. One-year and median survival val-ues did not change significantly (p [log–rank]⫽ 0.2) in the three subsequent accrual periods: 40% (median, 308 days), 36% (median, 292 days), and 40% (median, 299 days), as shown inFig. 1.
The subgroup analysis of survival is reported inTable 6. Among the factors related to the patient and to the tumor, older age, male gender, a worse postsurgical NPS, and Grade 3– 4 disease were all significantly related to worse survival (Table 6andFig. 2). A similar trend was evident for a larger tumor diameter and for a presurgical worse NPS. Among the therapy-related parameters, biopsy as the sole surgical procedure was strongly related to worse survival (p [log–rank]⫽ 0.0003).
A higher radiation dose was strongly and significantly related to a better outcome (p [log–rank]⫽ 0.0000,Table 6). A smaller fraction size and a smaller treated volume were also significantly related to a better outcome (Table 6). However, when patients treated with both higher (⬎50 Gy) or lower total doses were considered separately, a signifi-cant difference in survival according to the fraction size was not observed. Conversely, a significant dose effect existed for patients treated with both small and large (ⱖ2.5 Gy) fractions (Fig. 3). None of the other radiotherapy-related Fig. 1. Survival of patients treated 1985–1990 (n⫽ 193), 1991–
1996 (n⫽ 506), and 1997–2001 (n ⫽ 553). Differences are not statistically significant.
Fig. 2. Survival of patients with postsurgical neurologic perfor-mance status (NPS) score⬍2 (n ⫽ 601) or ⱖ2 (n ⫽ 651). The difference is statistically significant (p⫽ 0.0000).
parameters showed a significant correlation with prognosis. Survival was slightly but not significantly better for patients treated with a linear accelerator (as opposed to the cobalt unit) or with a 2D or 3D plan (as opposed to plans realized with the simulator only), as shown inTable 6.
Chemotherapy-treated patients (p [log–rank] ⫽ 0.02) and those able to be treated without steroid support (p [log–rank]⫽ 0.0000) also had a better outcome (Table 6). Multivariate analysis
Multivariate analysis for overall survival is reported in
Table 7. All the variables significant at univariate analysis were entered in the initial Cox model. The final model retained all these variables except for type of treatment planning and beam energy (Table 7).
However, as previously shown, smaller fraction sizes did not seem to have an independent prognostic effect; more-over, radiotherapy volume and fraction dose, as well as the use of steroids and of chemotherapy, were strictly related to the performance status of the patients. In fact, when all these variables were excluded from the initial Cox model, the significance of the differences in overall survival between the postsurgical NPS categories increased greatly (data not shown).
The factors retained in the final model did not change when the subdivision of the series into the three accrual periods was introduced into the initial model (data not shown).
DISCUSSION Pattern-of-practice analysis
The whole set of variations over time of the different patient, disease, and treatment features seem to point to a coherent change in the clinical behavior of the participating centers during the last two accrual periods.
Patients treated more recently were, on average, older, with worse NPS and more often with WHO Grade 4 disease. This might be an effect of the variation of the sample size in the three subsequent accrual periods, but it probably also reflects an increase in the incidence of gliomas in older patients (11) and a change in the selection criteria applied by the participating institutions, more recently offering ra-diotherapy to a larger fraction of the patients with worse prognostic features. This issue has been the subject of ample debate in the literature, but the option of not giving
radio-Fig. 3. Survival of patients (n⫽ 90) treated with low total doses (⬍50 Gy) and large fractions (ⱖ2.5 Gy); of patients (n ⫽ 93) treated with low total doses (⬍50 Gy) and small fractions (⬍2.5 Gy); and of patients treated with higher total doses (⬎50 Gy) and small (⬍2.5 Gy, n ⫽ 1048) or large (⬎2.5 Gy, n ⫽ 21) fractions. Differences in outcome according to fraction size, within each total dose group, are not significant. Differences in outcome according to total dose, within each fraction size group, are highly significant (p [log–rank]⬍0.000).
Table 7. Multivariate analysis (Cox model) of overall survival for the 1252 patients actively followed—final model
Feature Relative risk p (multivariate analysis) Gender 0.000 Male 1 Female 0.7 Age (y) 0.000 ⬍50 1 50–59 1.50 ⱖ60 1.88 Postsurgery NPS 0.02 0–1 1 2 or 3–4 1.20 WHO Grade 0.000 1 1 2 1.6 3 3.8 4 6.1 Tumor diameter (cm) 0.05 ⬍3 1 3–5 1.01 ⬎5 1.15 Type of surgery 0.000 Biopsy 1 Partial surgery 0.78 Radical surgery 0.71
RT total dose (Gy) 0.000
⬍50 1
50–59 0.48
⬎60 0.46
RT fraction size (Gy) 0.004
ⱕ2.5 1
ⱖ2 0.64
RT volume 0.01
Site of disease⫾ boost 1 Whole brain⫾ boost 1.16
Chemotherapy 0.002 Yes 1 No 1.31 Steroids 0.005 No 1 Yes 1.27
therapy at all has not gained much popularity and possibly should be applied only to older, bedridden patients who do not benefit from surgery or steroids, at least according to some guidelines and published evidence (12, 13).
Modern imaging procedures have been increasingly used for preoperative staging, after surgery, and after radiother-apy. Magnetic resonance imaging is progressively replacing brain CT over time. However, a relevant fraction of the patients did not undergo brain CT or MRI after surgery, and even more after radiotherapy, even in the most recent ac-crual period. Thus, in more recent years, the initial diagnos-tic process seems to be more complete, the disease seems to be diagnosed at an earlier stage, and a smaller proportion of patients (approximately 15%, with a median survival of only 5 months) is missing an accurate preradiotherapy di-agnostic workup. When these data are compared with data from other published series, some additional comments can be made. The Glioma Outcome Project (GOP) analyzed the patterns of care in a relevant series of 565 patients with HGG treated 1997–2000 in 52 clinical sites in the United States (14). In this series, MRI was obtained before surgery in 92% of the patients: this compares with a 75% value for the 1997–2001 accrual period of the present series. The majority of the published reports consider MRI as the im-aging procedure of choice for glioma patients (15, 16) and CT a complementary procedure. Therefore, in this relatively large sample of the centers caring for glioma patients in Italy, there is room for improvement in the use of imaging for staging and postsurgical evaluation.
In recent years, surgery has been more often macroscop-ically radical, probably because of the introduction of tech-nical innovations and because of the smaller average tumor size. Data from the GOP regarding the extent of surgery confirm that the majority of patients receive gross total surgery (57%) and a minority biopsy only (7%). Corre-sponding values for the present series are 48% and 22%, but only 22% of our patients had an NPS score of 0 –1 at diagnosis, whereas in the GOP series a mean Karnofsky performance status score of 81 was reported (14). More-over, comparisons regarding the completeness of the surgi-cal excision should be considered cautiously. The fact that in the GOP series 20 –30% of the surgical procedures were conducted with the neuronavigation technique testifies to the technical advances made in the surgical management of these patients.
The more recently accrued patients were also more often treated with radiation doses of ⬍50 Gy and with larger fraction sizes, but more sophisticated radiation techniques (such as 3D and conformal plans), smaller target volumes, and fraction sizes were increasingly used, especially when higher doses (ⱖ60 Gy) were prescribed.
This seems to point to the adoption of simpler techniques, smaller total doses, and larger fraction sizes for the worse prognostic categories of patients. This change probably reflects the attempts of many clinical researchers to identify hypofractionated schemes suitable for palliation for poor-prognosis patients (17–20). The Neuro Oncology Disease
Group of the Cancer Care Ontario Practice Guidelines Ini-tiative states that “this option would be particularly appro-priate for patients who are both older and with poor perfor-mance status” (12).
At the same time, younger, more fit patients are treated more aggressively, with higher total doses; consequently, smaller fraction sizes and treated volumes are used. These three parameters are, in fact, strictly related. This is in accordance with the randomized evidence of the favorable prognostic impact of higher total doses (1, 9, 12) and of the equivalence of survival rates in patients treated with smaller volumes (thus avoiding an unnecessary treatment burden) (21, 22).
In addition, chemotherapy has been more frequently used in the patients of the present series treated more recently (1997–2001, 21% of patients). The corresponding value for the patients recruited during the period 1997–2000 and reported by the GOP is, however, 54%. The difference between these observations might be explained by the neg-ative results of randomized trials using the older chemo-therapy schemes and by the fact that the efficacy of temo-zolomide was only recently documented (6, 23, 24).
The increase in the use of steroids during the radiotherapy course in the more recent accrual periods might well be due to the parallel increase in the fraction of patients with a worse NPS score after surgery.
Survival analysis
The factors more significantly related to survival in this series match the data from the literature (1, 2, 25–27): specifically, younger age and a lower WHO grade were among the major determinants of a better outcome. Female patients experienced a better outcome than male patients, as less frequently reported (28).
The analysis of the effect of the patient performance status on outcome was flawed by the small number of patients with the assessment of the Karnofsky index; in addition, the NPS was available for the entire series only after surgery. Nonetheless, a better postsurgical NPS was significantly linked with a better prognosis at both univar-iate and multivarunivar-iate analysis, and its relevance is clearly shown in the literature (25, 29). The prognosis of the pa-tients with a postsurgical NPS score of 2 or more is very bad (their median survival is approximately 8 months, Fig. 2). These patients represents more than half of our series, and the evaluation of NPS before an appropriate treatment op-tion is chosen is therefore of the utmost importance. Recent reports, in fact, suggest that, especially for poor-prognosis HGG, “quality adjusted survival” or “good quality survival” (strongly linked with neurologic status) is a better measure of outcome than uncorrected survival (30, 31).
Regarding treatment related factors, more extensive sur-gical procedures are strongly linked with a better prognosis at univariate and multivariate analysis, in accordance with the large majority of the contributions published on this issue (1, 9, 26, 32, 33). However, median survival in the present series was much lower for patients undergoing
biopsy alone (210 days) but not very different between the groups treated with “partial” or “radical” surgery (306 and 318 days, respectively). Similar data have been reported by Chang et al. (34) and by other groups (35).
Radiotherapy total dose was strongly related to survival at univariate and multivariate analysis. Although a clear advantage was documented for patients treated with doses ⬎50 Gy, the difference between the groups treated with 50 –59 Gy and with ⱖ60 Gy was much smaller. Similar observations were seen in randomized studies and guide-lines; however, the pattern of failure for malignant gliomas is such that a large number of studies explored and continue to explore dose-escalation protocols (12). This is probably one of the reasons why younger, fit patients of the present series underwent, particularly in more recent years, high-dose, more sophisticated treatments.
The use of smaller fraction sizes and limited-volume radio-therapy was significantly related to a better prognosis, but these factors clearly depend on the postsurgical NPS, be-cause more sophisticated treatments are offered mainly to more-fit patients. In addition, as previously shown, fraction size does not seem to reliably predict outcome indepen-dently of total dose. The available randomized studies do not show a survival advantage for patients treated with smaller volumes but rather only equivalent results compared with those treated with larger volumes (21, 22). Accord-ingly, in the present series, neither the use of conformal techniques nor the use of 2D and 3D planning were signif-icantly related to a better prognosis at univariate and mul-tivariate analysis. Finally, when all the factors defining the technical advances applied (including fraction size and treated volume) were omitted from the initial Cox model, the sig-nificance of the differences in outcome according to the postsurgical NPS greatly increased.
Similar considerations might be applied to the use of chemotherapy, which was also linked to a better prognosis at univariate and multivariate analysis. However, the data produced by the GOP also show better survival for
chemo-therapy-treated patients, and those investigators state that the association of chemotherapy and radiotherapy should be further explored and more frequently used (14). This might be a reasonable statement for some subgroups of malignant glioma patients, especially considering that important ran-domized data on temozolomide efficacy have been pub-lished after the recruitment period of the patients included in both our analysis and in that of the GOP (6).
In our series, the use of steroids was significantly linked with a worse prognosis at both univariate and multivariate analysis. In this case as well, a bias cannot be excluded, because the minority of patients not given steroids more frequently have a better NPS and, again, the significance of the differences in outcome according to the postsurgical NPS greatly increased when steroid use was excluded from the initial Cox model of multivariate analysis.
CONCLUSIONS
This study was conducted within the framework of an or-ganizational effort aiming at the establishment of an Italian cooperative study group for central nervous system tumors, under the aegis of the Italian Society of Radiation Oncol-ogy.
The data collected seem to confirm the empiric observa-tion that many Italian radiaobserva-tion oncology centers are moving toward two main patterns of practice: the use of rapid, tolerable, symptomatic–palliative treatments for poor-prog-nosis, high-grade gliomas; and the aggressive treatment of younger, fit patients with more favorable prognosis.
This background might favor the design and conduct of appropriate multicenter prospective trials, on a national basis, aiming at the definition of adequate standards of care for this often neglected group of tumors.
The definition of standards of care is particularly relevant in an era of limited funding for caregivers, because the allocation of resources proportional to the different needs of the malignant glioma patients should be stated, even more than in the past, on a sound and rational basis.
REFERENCES 1. Curran WJ Jr, Scott CB, Horton J, et al. Recursive partitioning
analysis of prognostic factors in three Radiation Therapy Oncology Group malignant glioma trials. J Natl Cancer Inst 1993;85:704 –710.
2. Stupp R, Janzer RC, Hegi ME, et al. Prognostic factors for low grade gliomas. Semin Oncol 2003;30:23–28.
3. Andersen AP. Postoperative irradiation of glioblastomas. Re-sults in a randomized series. Acta Radiol Oncol 1978;17:475– 484.
4. Walker MD, Alexander E Jr, Hunt WE, et al. Evaluation of BCNU and/or radiotherapy in the treatment of anaplastic glio-mas. A cooperative clinical trial. J Neurosurg 1978;49:333–343. 5. Kristiansen K, Hagen S, Kollevold T, et al. Combined mo-dality therapy of operated astrocytomas Grade III and IV. Confirmation of the value of postoperative irradiation and lack of potentiation of bleomycin on survival time: a prospective multicenter trial of the Scandinavian Glioblastoma Study Group. Cancer 1981;47:649 – 652.
6. Stupp R, Mason WP, van den Bent MJ, et al. Radiotherapy plus concomitant and adjuvant temozolomide for glioblas-toma. N Engl J Med 2005;352:987–996.
7. Kleihues PDR, Coons SW, Burger PC. Astrocytic tumors. In: Kleihues PDR, Cavenee WK, editors. Pathology and genetics of tumours of the nervous system. Lyon, France: International Agency for Research on Cancer Press, 2000.
8. MRC Brain Tumor Working Party. Prognostic factors for high grade malignant glioma: Development of a prognostic index.
J Neurooncol 1990;9:47–55.
9. Gupta T, Sarin R. Poor prognosis high grade gliomas: Evolv-ing an evidence-based standard of care. Lancet Oncol 2002; 3:557–564.
10. Schag CC, Heinrich RL, Ganz PA. Karnofsky performance status revisited: Reliability, validity, and guidelines. J Clin
Oncol 1984;2:187–193.
11. Behin A, Hoang-Xuan K, Carpentier AF, et al. Primary brain tumours in adults. Lancet 2003;361:323–331.
12. Laperriere N, Zuraw L, Cairncross G, et al. Radiotherapy for newly diagnosed malignant glioma in adults: A systematic review. Radiother Oncol 2002;64:259 –273.
13. Brada M, Stenning SP. Radiotherapy for malignant glioma in the elderly. Semin Oncol 2003;30:63– 67.
14. Chang SM, Parney IF, Huang W, et al. Patterns of care for adults with newly diagnosed malignant glioma. JAMA 2005; 293:557–564.
15. Hutter A, Schwetye KE, Bierhals AJ, et al. Brain neoplasms: Epidemiology, diagnosis, and prospects for cost-effective im-aging. Neuroimaging Clin N Am 2003;13:237–250.
16. Ricci PE. Imaging of adult brain tumors. Neuroimaging Clin N Am 1999;9:651– 669.
17. Chang EL, Yi W, Allen PK, et al. Hypofractionated radio-therapy for elderly or younger low performance status glio-blastoma patients: Outcome and prognostic factors. Int J Ra-diat Oncol Biol Phys 2002;56:519 –528.
18. Phillips C, Guiney M, Smith J, et al. A randomized trial comparing 35 Gy in ten fractions with 60 Gy in 30 fractions of cerebral irradiation for glioblastoma multiforme and older patients with anaplastic astrocytoma. Radiother Oncol 2003; 68:23–26.
19. McAleese JJ, Stenning SP, Ashley S, et al. Hypofractionated radiotherapy for poor prognosis malignant glioma: matched pair survival analysis with MRC controls. Radiother Oncol 2003;67:177–182.
20. Kleinberg L, Slick T, Enger C, et al. Short course radiotherapy is an appropriate option for most malignant glioma patients. Int J Radiat Oncol Biol Phys 1997;38:31–36.
21. Shapiro WR, Green, SB, Burger PC, et al. Randomized trial of three chemotherapy regimens and two radiotherapy regimens in postoperative treatment of malignant glioma. J Neurosurg 1989;71:1–9.
22. Kita M, Okawa T, Tanaka M, et al. Radiotherapy of malignant glioma—prospective randomized clinical study of whole brain vs local irradiation. Gan No Rinsho 1989;35:1289 –1294. 23. Medical Research Council Brain Tumour Working Party.
Randomized trial of procarbazine, lomustine, and vincristine in the adjuvant treatment of high-grade astrocytoma: A Med-ical Research Council Trial. J Clin Oncol 2001;19:509 –518. 24. Brada M, Viviers L, Abson C, et al. Phase II study of primary temozolomide chemotherapy in patients with WHO grade II gliomas. Ann Oncol 2003;14:1715–1721.
25. Barker FG, Chang SM, Larson DA, et al. Age and radiation response in glioblastoma multiforme. Neurosurgery 2001;49: 1288 –1298.
26. Herfarth KK, Gutwein S, Debus J. Postoperative radiotherapy of astrocytoma. Semin Surg Oncol 2001;20:13–23.
27. Buckner JC. Factors influencing survival in high-grade glio-mas. Semin Oncol 2003;30:10 –14.
28. Levin VA, Leibel SA, Gutin PH. Neoplasms of the central nervous system. In: DeVita VT Jr, Hellman S, Rosenberg SA, editors. Cancer: Principles and practice of oncology. 6th ed. Philadelphia: Lippincott, Williams & Wilkins; 2001. p. 2100 – 2160.
29. Soffietti R, Chiò A, Giordana MT, et al. Prognostic factors in well-differentiated cerebral astrocytomas in the adult. Neuro-surgery 1989;24:686 – 692.
30. McAleese JJ, Stenning SP, Ashley S, et al. Hypofractionated radiotherapy for poor prognosis malignant glioma: Matched pair survival analysis with MRC controls. Radiother Oncol 2003;67:177–182.
31. Murray KJ, Nelson DF, Scott C, et al. Quality-adjusted sur-vival analysis of malignant glioma. Patients treated with twice-daily radiation (RT) and carmustine: A report of Radi-ation Therapy Oncology Group (RTOG) 83-02. Int J Radiat Oncol Biol Phys 1995;31:453– 459.
32. Simpson JR, Horton J, Scott C, et al. Influence of location and extent of resection on survival of patients with glioblastoma multiforme: Results of three consecutive RTOG clinical trials. Int J Radiat Oncol Biol Phys 1993;26:239 –244.
33. Karim AMF, Maat B, Hatlevoll R, et al. A randomized trial on dose-response in radiation therapy of low-grade cerebral gli-oma: European Organization for Research and Treatment of Cancer (EORTC) study 22844. Int J Radiat Oncol Biol Phys 1996;36:549 –556.
34. Chang CH, Horton J, Schoenfeld D, et al. Comparison of postoperative radiotherapy and combined postoperative radio-therapy and chemoradio-therapy in the multidisciplinary manage-ment of malignant glioma. Cancer 1983;52:997–1007. 35. Curran WJ, Scott CB, Horton J, et al. Does extent of surgery
influence outcome for astrocytoma with atypical or anaplastic foci (AAF). A report from three Radiation Therapy Oncology Group (RTOG) trials. J Neurooncol 1992;12:219 –227.