i
DOTTORATO DI RICERCA IN
Scienze Agroambientali
Ciclo XXIV
Settore Concorsuale di afferenza: 07/B1
TITOLO TESI
Understanding The Physiological, Biochemical, and
Molecular Mechanisms of Salinity Tolerance in
Strawberry Cultivars and in
HvTPK1-Overexpressed Barley
Presentata da: Mohammad Alnayef
Coordinatore
Dottorato
Relatore
Prof. Giovanni Dinelli
Prof. Giorgio Prosdocimi Gianquinto
ii
Abstract
The research was carried out to investigate of main elements of salt stress response in two strawberry cultivars, Elsanta and Elsinore. Plants were grown under 0, 10, 20 and 40 mM NaCl for 80 days. Salinity dramatically affected growth in both cultivars, although Elsinore appeared to be more impaired than Elsanta. Moreover a significant reduction of leaf photosynthesis, evaporation, and stomatal conductance was recorded 24 hrs after the stress was applied in both cultivars, whereas physiological functions were differentially restored after acclimation. However, cv. Elsanta had more efficient leaf gas exchange and water status than cv. Elsinore. In general, Fruit yield reduced upon salinization, wheares fruit quality concerning fruit taste, aroma, appearance, total soluble solids and titratable acidity, did not change but rather was enhanced under moderate salinity. On the other hand fruit quality was impaired at severe salt stress. Fruit antioxidant content and antioxidant capacity were enhanced significantly by increasing salt concentration in both cultivars. The oxidative effects of the stress were defined by the measures of some enzymatic activities and lipid peroxidation. Consistently, an increase in superoxide dismutase (SOD), catalase (CAT), peroxide dismutase (POD) enzymes and higher content of proline and soluble proteins were observed in cv. Elsinore than in cv. Elsanta. The increase coincided with a decrease in lipid peroxidation. The research confirmed that although strawberry cultivars were sensitive to salinity, difference between cultivars exist; The experiment revealed that cv. Elsanta could stand severe salt stress, which was lethal to cv. Elsinore. The parameters measured in the previous experiment were proposed as early screening tools for the salt stress response in nine strawberry genotypes. The results showed that, wheares Elsanta and Elsinore cultivars had a lower dry weight reduction at 40 mM NaCl among cultivars, Naiad, Kamila, and Camarosa were the least salt-sensitive cultivars among the screened. In transgenic barley, the results showed that 13 lines were homozygous and resistance to hygromycin. Furthermore, the expression level of HvTPK1 in transgenic lines was slightly increased compared to wild type and this resulted in different ion content and growth rate.
Keywords: salinity, strawberry, stomatal conductance, fruit quality, antioxidants systems, barley, HvTPK1
iii
Table of contents
Abstract ... ii
Table of contents ... iii
List of figures ... vii
List of tables ... x
Dedication ... xiii
Acknowledgments ... xiv
List of Abbreviations ... xvi
Introduction ... 1
Low stomatal density and reduced transpiration facilitate strawberry adaptation to salinity . 4 1 Introduction ... 4
2 Materials and methods ... 6
2.1 Experiment 1 ... 6
2.1.1 Plant material and growth conditions ... 6
2.1.2 Treatments and experimental design ... 7
2.1.3 Growth and yield assessment ... 7
2.1.4 Stomatal size and density ... 7
2.1.5 Leaf gas exchanges ... 8
2.1.6 Plant water relations ... 8
2.1.7 K+, Na+ and Cl- contents ... 8
2.2 Experiment 2 ... 9
2.2.1 Plant material and growth conditions ... 9
2.2.2 Treatments and experimental design ... 9
2.2.3 Plant water relations ... 10
3 Statistical analysis ... 10
4 Results ... 10
4.1 Plant growth in response to salinity ... 10
4.2 Na+, K+ and Cl- distribution ... 11
4.3 Water relations and leaf gas exchanges ... 11
5 Discussion ... 13
5.1 A functional leaf area is associated with yield improvement in salt stressed strawberry plants... ... 13
5.2 Control of ion Na+ and Cl- fluxes and organ distribution ... 14
5.3 Low stomatal density and reduced transpiration facilitate strawberry adaptation to salinity. ... ……….15
iv
6 Conclusion ... 17
7 Tables ... 18
8 Figures ... 20
Response of endogenous proline, total soluble proteins, lipid peroxidation, and antioxidative enzymes in leaves of two strawberry cultivars (Elsanta and Elsinore) to long-terms of salt stress ... 29
1 Introduction ... 29
2 Materials and methods ... 31
2.1 Experimental design and growth conditions ... 31
2.2 Plant materials ... 31 2.3 Enzymatic activities ... 31 2.3.1 Catalase ... 31 2.3.2 Superoxide dismutase ... 31 2.3.3 Peroxidase ... 32 2.4 Lipid peroxidation ... 32 2.5 Proline content... 33
2.6 Total soluble proteins ... 33
3 Results ... 33
3.1 Lipid peroxidation (MDA) ... 33
3.2 Enzymes activities ... 34
3.3 Proline content... 34
3.4 Total soluble protein ... 34
4 Discussion ... 35
4.1 Enzymes activity ... 35
4.2 Lipid peroxidation (MDA) ... 37
4.3 Proline content... 37
4.4 Total Soluble proteins ... 38
5 Tables ... 39
6 Figures ... 40
Quality and bioactive compounds of strawberry fruit under long-term salt stress ... 42
1 Introduction ... 42
2 Materials and methods ... 44
2.1 Plant material and growth conditions ... 44
2.2 Treatments and experimental design ... 44
v
2.4 Sensory panel test ... 45
2.5 Determinations of phenolics and anti-oxidant activities ... 46
2.5.1 Total phenolic content ... 46
2.5.2 Total flavonoids content ... 46
2.5.3 Total anthocyanin content ... 47
2.6 Antioxidant activity ... 47
2.6.1 FRAP assay ... 47
2.6.2 DPPH assay ... 48
3 Statistical analysis ... 48
4 Results ... 48
4.1 pH, Brix, TA, Brix/TA ... 49
4.2 Appearance, Aroma, Taste ... 49
4.3 Antioxidants content ... 50
5 Discussion ... 51
6 Tables ... 55
7 Figures ... 61
Plant growth, gas exchange, water relations and osmotic adjustment as screening tools of salinity tolerance in nine cultivars of strawberry ... 63
1 Introduction ... 63
2 Materials and methods ... 65
2.1 Plant material and growth conditions ... 65
2.2 Leaf gas exchanges ... 65
2.3 Plant water relations ... 66
3 Statistical analysis ... 66
4 Results ... 66
4.1 Growth analysis ... 66
4.2 Leaf gas exchange ... 67
4.3 Plant water relations ... 69
5 Discussion ... 69
6 Tables ... 73
Morphological and physiological characterisation of barley plants that overexpress the vacuolar two-pore K+ channel (HvTPK1) ... 79
1 Introduction ... 79
2 Materials and methods ... 81
vi
2.2 Screening of homozygous HvTPK1-overexpressed lines using a leaf test method ... 81
2.3 DNA extraction from leaf tissue of barley ... 81
2.4 PCR analyses for screening of HvTPK1-overexpressed lines ... 82
2.5 Expression analyses of HvTPK1 transcript level by RT-PCR ... 82
2.6 Growth and ion analysis of transgenic barley plants ... 83
3 Results ... 84
3.1 Segregation and over-expression analyses of putative transgenic lines of barley ... 84
3.2 Growth and ion analysis of transgenic barley plants ... 84
3.3 K+ and Na+ contents of overexpressed HvTPK1 lines and wild type ... 84
4 Discussion ... 85
5 Figures ... 88
Conclusion ... 92
1 Low stomatal density and reduced transpiration facilitate strawberry adaptation to salinity .. 93
2 Response of endogenous proline, total soluble proteins, lipid peroxidation, and antioxidative enzymes in leaves of two strawberry cultivars (Elsanta and Elsinore) to long- terms of salt stress 93 3 Organoleptic attributes, taste-relative, and bioactive compounds ... 94
4 Screening nine cultivars of strawberry ... 95
vii
List of figures
Figure 2-1: Effect of saline treatments (0, 10, 20 and 40 mM NaCl) on dry weight and leaf area in two strawberry cultivars, Elsanta (closed circles) and Elsinore (open circles). At the time of measurements plants were 111 days old. Equations indicate regression lines. Mean values ± SE (n = 9). ... 20
Figure 2-2: Leaf number of two strawberry cultivars, Elsanta (closed circles) and Elsinore (open circles), after 36 and 67 days of growth at different NaCl concentrations (0, 10, 20 and 40 mM) in the nutrient solution. Mean values ± SE (n = 9). ... 21
Figure 2-3: Fruit yield of two strawberry cultivars, Elsanta (closed circles) and Elsinore (open circles), grown at different NaCl concentrations (0, 10, 20 and 40 mM) in the nutrient solution. At the time of measurements plants were 111 days old. Equations indicate regression lines. Mean values ± SE (n = 18). ... 22
Figure 2-4: Ion contents in leaves and crowns of two strawberry cultivars, Elsanta (closed squares) and Elsinore (open squares), grown at different NaCl concentrations (0, 10, 20 and 40 mM) in the nutrient solution for 36 days. At the time of measurements plants were 80 days old. Mean values ± SE. (n = 6). ... 23
Figure 2-5: Leaf gas exchanges in two strawberry cultivars, Elsanta (closed squares) and Elsinore (open squares), exposed to saline irrigation (0, 10, 20 and 40 mM NaCl). DAS = days after salt treatment initiation; gs = stomatal conductance; E
= leaf transpiration; A = net photosynthesis. Mean values ± SE (n = 6). ... 24
Figure 2-6: Daily pattern of water loss in two strawberry cultivars, Elsanta and Elsinore, irrigated with 0 (closed squares), 10 (open squares), 20 (closed circles) and 40 (open circles) mM NaCl solutions. At the time of measurements plants were 54 days old. Measures were carried out after ten days of irrigation with different NaCl solutions. Plants were grown singularly in 5 l pots, which were sealed in plastic wrap and placed on electronic balances. Water loss was determined every 60 min for 1 day. Mean values ± SE (n = 9). ... 25
Figure 2-7: Daily average whole-plant water loss in two strawberry cultivars, Elsanta (closed squares) and Elsinore (open squares), after ten days of saline irrigation (0, 10, 20 and 40 mM NaCl). At the time of measurements plants were 54 days
viii old. Plants were grown singularly in 5 l pots, which were sealed in plastic wrap and placed on electronic balances. Water loss was determined every 60 min for 1 day. Mean values over the 24-hours are shown (n = 9). ... 26
Figure 2-8: Stomatal density in two strawberry cultivars, Elsanta (closed squares) and Elsinore (open squares), exposed to saline irrigation (0, 10, 20 and 40 mM NaCl) for 15 days. At the time of measurements plants were 59 days old. Mean values ± SE (n = 9). ... 27
Figure 2-9: Water potential (Ψt), osmotic potential (Ψπ), relative water content (RWC) and
leaf osmotic adjustment (LOA) in two strawberry cultivars, Elsanta (closed symbols) and Elsinore (open symbols), grown in a growth chamber under cool-white fluorescent light and irrigated with saline water (0 and 40 mM NaCl) for 20 days. At the time of measurements plants were 60 days old. Mean values ± SE (n = 6). ... 28
Figure 3-1: A) MDA content, B) catalase enzyme activity, C) superoxide dismutase enzyme activity and D) peroxidase enzyme activity in the leaves of two strawberry cultivars, Elsanta (closed square) and Elsinore (open square). Mean values ± SD (n = 3) under salinity treatments of 0, 10, 20 and 40 mM NaCl. ... 40
Figure 3-2:A) proline content and B) total soluble proteins content in the leaves of two strawberry cultivars, Elsanta (closed square) and Elsinore (open square). Mean values ± SD (n = 3) under salinity treatments of 0, 10, 20 and 40 mM NaCl. ... 41
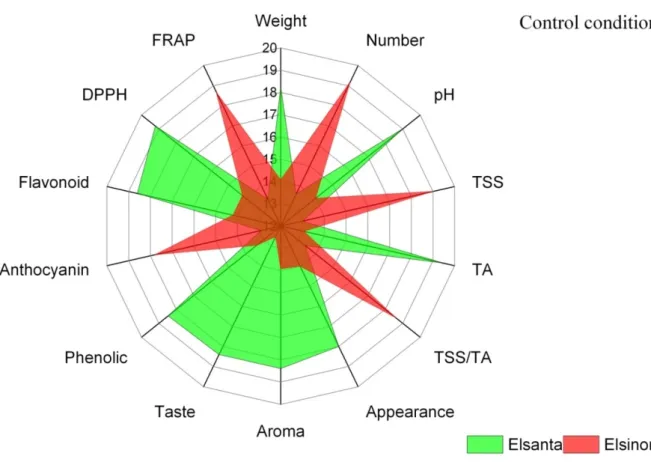
Figure 4-1: Radar chart of fruit weight, fruit number per plant, organoleptic attributes (appearance, aroma and taste), biochemical content (TA, TSS, TSS/TA and pH) and health promoting compounds (phenolics, flavonoids, anthocyanin and antioxidant activity) in two cultivars of strawberry (Elsanta and Elsinore) at control condition. ... 61
Figure 4-2: Radar chart of fruit weight, fruit number per plant, organoleptic attributes (appearance, aroma and taste), biochemical content (TA, TSS, TSS/TA and pH) and health promoting compounds (phenolics, flavonoids, anthocyanin and
ix antioxidant activity) in two cultivars of strawberry (Elsanta and Elsinore) at control and 40 mM NaCl conditions. ... 62
Figure 6- 1: Leaf antibiotic resistance assay method of HvTPK1-overexpressed barley for selection of homozygous transgenic lines. Bleached leaves were considered not resistant to hygromycin, while green leaves were considered tolerant to hygromycin (Transgenic plants). ... 88
Figure 6- 2: RT-PCR analysis of HvTPK1 over-expression in leaf tissue of transgenic lines of barley compared to wild type; on the left HvTPK1 specific gene primers, on the right Tubulin primers. ... 89
Figure 6- 3: Relative growth rate of HvTPK1-overexpressed barley (OX1, OX4, and OX6) and wild type plants (WT). Plants were grown in control, 100 mM NaCl, 150 mM NaCl, 0-K+, 100 mM KCl, and 15% PEG conditions for 11 days in hydroponic medium. Values are the mean ± SD (n=4). Different letters indicate significant difference at the 5% level by Duncan test. ... 90
Figure 6- 4: K+ content in root, shoot of HvTPK1-overexpressed barley (OX1, OX4, OX6)
and wild type plants grown in A) Control, B)100 mM NaCl, C) 150 mM NaCl, D) 0-K+, E) 100 mM KCl, and F) 15% PEG conditions for 11 days in hydroponic medium. Values are the mean ± SD (n=4). Different letters indicate significant difference of K+ content at the 5% level by Duncan test. ... 91
Figure 6-5: Na+ content in root, shoot of HvTPK1-overexpressed barley (OX1, OX4, OX6) and wild type plants grown in A) Control, B)100 mM NaCl, C) 150 mM NaCl, D) 0-K+, E) 100 mM KCl, and F) 15% PEG conditions for 11 days in hydroponic medium. Values are the mean ± SD (n=4). Different letters indicate significant difference of K+ content at the 5% level by Duncan test. ... 92
x
List of tables
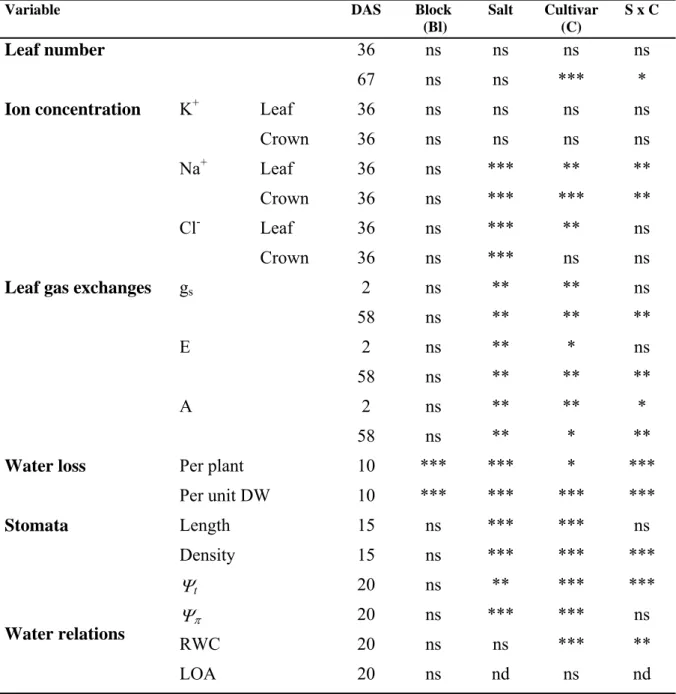
Table 2-1: Summary ANOVA table for the parameters under assessment in two strawberry cultivars, Elsanta and Elsinore, in response to four salinity treatments (0, 10, 20 and 40 mM NaCl). DAS = days after stress treatment initiation; gs = stomatal
conductance; E = leaf transpiration; A = net photosynthesis; ns = non significant differences; * = significant differences at P≤0.05; ** = significant differences at P≤0.01; *** = significant differences at P≤0.001. ... 18
Table 2-2: Effect of salt stress (0, 10, 20 and 40 mM NaCl) K+/Na+ ratio in leaf and crown of two strawberry cultivars (Elsanta and Elsinore). ... 19
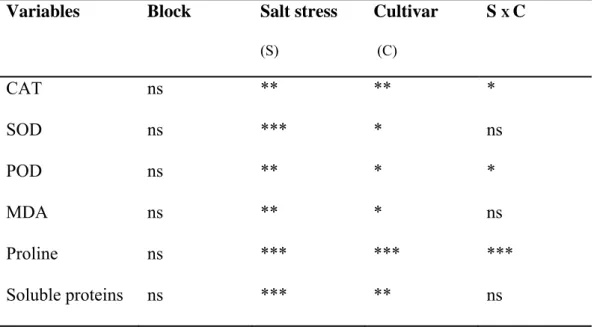
Table 3-1: Summary of two-ways ANOVA table for the enzymatic and non enzymatic antioxidant of leaves of two strawberry cultivars, Elsanta and Elsinore, in response to salinity treatments (0, 10, 20 and 40 mM NaCl). ns = non significant differences; * = significant differences at P≤0.05; ** = significant differences at P≤0.01; *** = significant differences at P≤0.001. ... 39
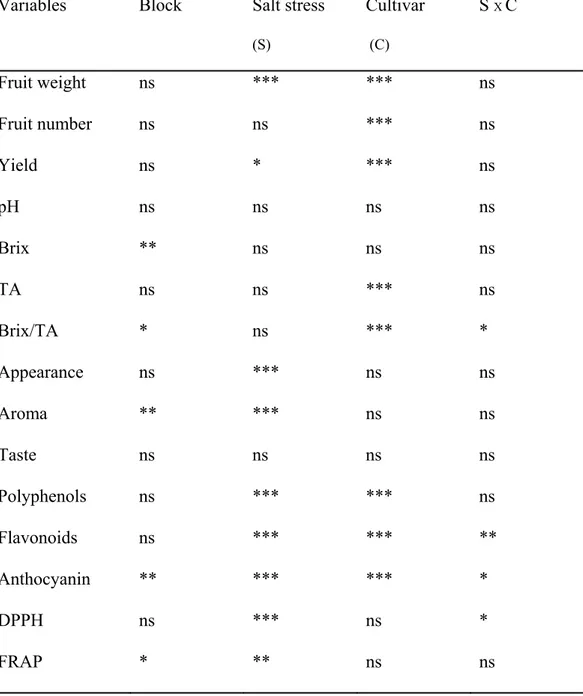
Table 4-1: Summary of two-ways ANOVA table for the morphological and chemical fruit parameters of two strawberry cultivars, Elsanta and Elsinore, in response to salinity treatments (0, 10, 20 and 40 mM NaCl). ns = non significant differences; * = significant differences at P≤0.05; ** = significant differences at P≤0.01; *** = significant differences at P≤0.001... 55
Table 4-2: Influence of salinity treatments (0, 10, 20 and 40 mM NaCl) on fruit weight, fruit number, and yield per plant... 56
Table 4-3: pH, total soluble solids (TSS), titratable acid (TA), and TSS/TA ratio fresh fruit parameters of two strawberry cultivars, Elsanta and Elsinore, grown in different NaCl concentrations (0, 10, 20 and 40 mM NaCl). Mean values ± SD (n = 6).. 57
Table 4-4: Influence of salinity treatments (0, 10, 20 and 40 mM NaCl) sensory panel test of fresh fruit of two strawberry cultivars, Elsanta and Elsinore. Mean values ± SD (n=10)... 58
xi Table 4-5: Influence of salinity treatments (0, 10, 20 and 40 mM NaCl) on fruit content of total phenoloic, total flvonoids, total anthocyanins and antioxidant capacity by using both DPPH and FRAP assays of two strawberry cultivars, Elsanta and Elsinore...59
Table 4-6: Pearson’s correlation coefficients of antioxidant parameters for two strawberry cultivars under different salt concentrations... 60
Table 5-1: Summary ANOVA table for the parameters under assessment in two strawberry cultivars, Elsanta and Elsinore, in response to four salinity treatments (0, 10, 20 and 40 mM NaCl). LA= leaf area, gs = stomatal conductance; E = leaf
transpiration; A = net photosynthesis, ψt = total water potential, ψπ = osmotic
potential, RWC= relative water content, LOA= leaf osmotic adjustment; ns = non significant differences; * = significant differences at P≤0.05; ** = significant differences at P≤0.01; *** = significant differences at P≤0.001 ... 73
Table 5-2: Effect of salt stress (0, 20, 40 and 80 mM NaCl) on leaves area, shoot, root dry weight and shoot/ root ratio of nine cultivars of strawberry. Means ± SE. nd = non determined, since plants were dead. Different letters indicate significant difference at the 5% level by Duncan test. ... 74
Table 5-3: Leaf transpiration (E), net photosynthesis (A), stomatal conductance (gs),
intercellular CO2 (Ci), and water use efficiency (WUE) in response to 2 days of
salt stress (0, 20 40 and 80 mM NaCl) application in seedlings of nine cultivars of strawberry. Means ± SE. Different letters indicate significant difference at the 5% level by Duncan test. ... 75
Table 5-4: Leaf transpiration (E), net photosynthesis (A), stomatal conductance (gs),
intercellular CO2 (Ci), and water use efficiency (WUE) in response to 7 days of
salt stress (0, 20 40 and 80 mM NaCl) application in seedlings of nine cultivars of strawberry. Means ± SE. nd = non determined, since plants were dead. Different letters indicate significant difference at the 5% level by Duncan test 76
Table 5-5: Total leaf water potential (ψt), leaf osmotic potential (ψπ ), relative water
content (RWC) and leaf osmotic adjustment (LOA) in response to 7 days salt stress (0, 20 40 and 80 mM NaCl) in seedlings of nine cultivars of strawberry.
xii Means ± SE. nd = none determined, since plants were dead. Different letters indicate significant difference at the 5% level by Duncan test... 77
Table 5-6: Pearson’s correlation coefficients between biometric measurements (LA= leaf area and DW= dry weight) and gas exchange (E, A, gs, and Ci) and water status
(ψt,ψπ and RWC) on nine cultivars of strawberry. * = significant at P < 0.05; ** =
significant at P < 0.01; *** significant at P < 0.001: ns = not significant differences ... 78
Table 6-1: Primer sequences of Hygromycine-F and Hygromycin-R gene used for PCR analysis. ... 82
Table 6-2: Primers used to detect gene expression in control and HvTPK1-overexpressed lines using RT-PCR. ... 83
xiii
Dedication
To my parents:
Thanks for your love, precious support and sacrifice in my education. I hope that you can
find here my deep gratitude and infinite reconnaissance
To my brothers and sisters:
Thanks for your encouragement, invaluable advices, financial and technical supports, and
affection. My intense respect and esteem
To my wife Suha Alhomsi who supports and stands beside me during my study, I don’t
find words to express my deep love and appreciation…
To my daughter Rahaf:
To my angel who delights my life and brings happiness to my family
xiv
Acknowledgments
In terms of this work, I would like to take this opportunity to express my respect and
acknowledgment to University of Bologna, Faculty of agriculture, Department of
Agro-Environmental science and Technologies (DiSTA) for the procure of all facilities needed
to complete this work.
I would like to express also my deep thank to Erasmus Mundus (JOSLEEM) for their
confidence and financial supporting that they gave me. It is also my pleasure to serve
their objective in order to enhance understanding and international cooperation capacity
in the field of science, education and culture between Europe and Syria.
Related to scientific matter, at the first place, my most sincere thanks and gratitude to
my supervisor prof. Giorgio Prosdocimi Gianquinto for his helpful and precious advises,
suggestions and guidance for the achievement of my work, especially for his
encouragements and confidence that he gave me during my PhD.
My special recognition and deep thanks to my tutor and partner in this achievement Dr.
Francesco Orsini for his advices, kindles, help and efforts to make hard work more easier
for me. Moreover, I would like to thank him for greatest social life during my presence in
Italy, and special thanks go to his family.
I would like to extend my utmost gratitude to prof. Giovanni Dinelli for precious
opportunity to achieve my PhD degree at Bologna University, Most importantly; none of
this would have been possible without his unlimited supporting, and guidance. I will
always appreciate his efforts in order to achieve the major and most important parts of
my thesis at his lab with complete encouragements.
Regarding my research abroad, special thanks and gratitude to Dr. Frans Maathuis and
his lab staff, for unforgettable memory during my work at his lab , for his supporting,
patience and encouragements that gave me in order to enhance my knowledge and
introduce myself to basis of molecular biology.
xv
Many friends have helped me stay sane through these difficult years. Their support and
care helped me overcome setbacks and stay focused on my study. I greatly value their
friendship and I deeply appreciate their belief in me. May be my memory will not help me
to remember all of them, but I would like to thank my brother Dr. Taha Rajab who
helped me during my staying in the UK,, Dr. Ammar Dayoub for his help and supporting
during my staying in Italy especially during the first months. Dr. Mohammad mehaoush,
Monther Alhamdoosh, Marwan Youniso, Maher Alhamdoosh, Mattia Acorsi, Valerrio
Pollini and others for every sweet moments that I have spent with them
Heartfelt appreciation for all the people, that contributes in the achievement of this
modest work.
Mohammad Alnayef
xvi
List of Abbreviations
A Net photosynthesis
At Arabidopsis thaliana
BCA Bicinchoninic acid
bp base pair
CAT Catalase
cDNA complementary DNA
CE Catechin equivalent
Ci Intercellular CO2
cv. cultivar DAS Day after salt treatments
DNA Deoxyribonucleic acid
DPPH 2,2-Diphenyl-1-picrylhydrazyl
DW Dry weight
E Transpiration EC Electrical conductivity
FRAP Ferric reducing antioxidant power FV Fast vascular channels
FW Fresh weight
GAE Galic acid equivalent
gs Stomatal conductance
Hv Hordeum vulagre
LA Leaf area
LOA Leaf osmotic adjustment
LV Lytic vacuoles
MDA Malondialdhyde MS salt Murashige-Skoog salt NTB Nitro blue tetrazol
Os Oryza sativa
xvii PAR Photosynthetically Active Radiation
PCR Polymerase-chain-reaction
PEG Polyethylene glycol
Pi Intercellular CO2 partial pressure
POD Peroxidase PSV Protein storage vacuoles
PUFAs Polyunsaturated fatty acids PVPP Polyvinylpyrrolidone RGR Relative growth rate
RH Relative Humidity
RNA Ribonucleic acid
ROS Reactive oxygen species RT-PCR Reverse Transcriptase PCR RWC Relative water content
SOD Superoxide dismutase
SV Slow vacular channels
TA Titratable acidity
TAC Total anthocyanin content TCA Trichloro actic acid
TE Trolox equivalent
TFC Total flavonoids content TPC Total phenolics contents TPK Tow-pore K+ channel TSS Total soluble solids
V/V Volume by volume
VK Vacular K+ channel
w/v Weight by volume
WUE Water use efficiency Ψp Pressure potential
Ψt Water potential
1
Introduction
Abiotic stresses, such as drought and salinity, are serious threats to agriculture and natural status of the environment. These threats are indirectly catalyzed by global warming and population growth (Koyro et al., 2010). Global temperatures have increased by about 1 ºC over the course of the last century, and will likely rise even more rapidly in the coming decades. Increased drought and salinization of arable land are expected to have devastating global effects (Wing et al., 2003). The current amount of annual loss of arable area could double by the end of the century because of global warming (Evans, 2005). At the same time, rapid population growth increasingly generates pressure on existing cultivated land and other resources (Ericson et al., 1999). Therefore, adverse environmental conditions cause severe problems of poverty, social instability, and populations health threats (Moench, 2002). Salinity can be either natural or human induced by fertilizer or irrigation water. Excessive accumulation of salts in the rhizosphere can lead to growth inhibition, leaf necrosis, accelerated senescence, wilting and ultimate plant death. Different physiological mechanisms can also be involved. An osmotic mechanism may lead to the reduction of water potential and consequently the ability of plants to take up water decreases, which can seriously affect turgor potential and cell expansion. With time, salt may exert an additional effect on growth. If excessive amounts of Na+ or Cl- enter the plant, their concentration may rise to toxic levels in the older transpiring leaves. This injury, added to an already reduced leaf area, will then further limit the flow of carbon compounds to meristems and growing zones in leaves (Munns, 2010). The toxicity has also been related to increased generation of reactive oxygen species (ROS). Dual roles have been suggested for ROS in plants, as growth regulators, and potential signaling roles, as they may cause oxidatiove damage on vital cellular components at exccessive levels. It also has been reported that salt induced antioxidant enzymes may more or less successfully mitigate the potentially adverse effect of excessive ROS accumulation.
The salinity tolerance of plants is in most cases multigenic; it includes a wide range of morphological, physiological, and biochemical mechanisms on whole plant, tissue, and
2 cellular/ molecular levels (Wang et al., 2003). Only rarely is a single parameter of major importance for the ability to survive at high salinity. A comprehensive study with the analysis of at least a combination of several parameters is an essential to get a survey about the mechanisms which in the end leads to the salinity tolerance of individual species. These mechanisms are connected to the four major constraints of plant growth on saline conditions: water scarcity, leaf gas exchange, ion toxicity, and nutrient imbalance. It is therefore important to recognize and understand the processes that allow plants to adapt to water and salinity stress and allow an increase in biomass or plant yield for food production.
Accordingly, in this work we have tried to do a comprehensive study on the effect of salinity on strawberry and barley plants in order to understand the main mechanisms which allowed plants to mitigate the adverse effect of salinity. On the other hand, we tested the hypothesis that says that moderate salinity can improve strawberry fruit quality throughout enhancement of promoting health components and some biochemical attributes. As far as the Second Chapter is concerned, the objective of the study was to characterize morphological and physiological response of two strawberry cultivars namely (Elsanta and Elsinore) to different salt conditions. This study attempted to establish a functional link between morphological / physiological traits and on the one hand and stress tolerance on the other. In the Third Chapter: the objective of the study was to investigate the enzymatic antioxidant system and osmolytes accumulation, such as proline and soluble proteins and their roles in order to mitigate the adverse effect of salinity. In the Fourth Chapter, the objectives were to test the hypothesis which says that low-to-moderate levels of salinity are often used to improve fruit quality and to investigate as well the influence of adverse effect of salinity on fruit quality of both strawberry cultivars, especially on inner quality (nutrient value, antioxidant components, and biochemical attributes) and outer quality (appearance, aroma, and fruit size). In the Fifth Chapter; based on promising and valuable results of the first experiment, the second experiment was established by using nine cultivars of strawberry namely (Elsanta, Elsinore, Naiad, Siba, Kamila, Clery, Camarosa, Marmolada, and Madeleine) and the objective was to validate some screening tools of salt tolerance in order to differentiate between the less-sensitive-cultivars and less-sensitive-cultivars of strawberry for further breeding program. In the Sixth Chapter; this chapter is related to work on barley during my abroad training. In
3 this chapter, in my attempt to understand the molecular perspective of salinity tolerance, the objectives were to study overexpression HvTPK1 in transgenic barley by leaf test, PCR, and RT-PCR and to characterize these transgenic plants with respect to growth and tolerance to a range of stresses, such as salinity stress and drought stress by measuring growth parameters and ion contents.
4
Low stomatal density and reduced transpiration facilitate
strawberry adaptation to salinity
1 Introduction
Salinization of agricultural soils and irrigation water is one of the most critical environmental constraints limiting crop productivity and quality. Approximately 20% of irrigated land is affected by salinity (Rozema and Flowers, 2008). Although arid and semiarid regions of the world are more exposed to this phenomenon (Munns, 2005), salinization is increasingly expanding in less extreme environments since it is tightly associated with the practice of irrigation itself and, therefore, cannot be avoided (Rhoades et al., 1992; Flowers, 2004). Consequently, understanding the physiological and molecular basis underlying salt stress adaptation is pivotal to identify critical functions that should be potentiated to improve stress tolerance via traditional breeding or genetic engineering (Pardo, 2010). Key physiological processes and genetic determinants in salt stress adaptation have been identified in model systems and agricultural crops and have been shown to control mechanisms involved in ion/water homeostasis (Munns and Tester, 2008; Tavakkoli et al., 2011) and activation of multiple adaptation responses (Zhu, 2009; Klingler et al., 2010). Less explored, however, has been the role of metabolic components and physiological responses to saline stress with respect to morphological traits that may also facilitate stress adaptation (Maggio et al., 2001, 2007). Constitutively reduced transpiration fluxes, for example, may contribute to delay osmotic and ionic effects on shoot growth and may allow plants to adjust more effectively to unfavourable environments (Passioura and Munns, 2000). A deeper understanding of interlinks between metabolic, physiological and morphological determinants may also have a particular relevance when species-specific salt tolerances are framed in the context of different cultural/agricultural systems (Tavakkoli et al., 2010).
Strawberry (Fragaria x ananassa Duch.) is known as one of the most salt-sensitive crops with variable degrees of tolerance with respect to different cultivars and periods of exposure to high NaCl concentrations (Maas, 1990; Martinez Barroso and Alvarez, 1997; Turhan and Eris, 2005; Yilmaz and Kina, 2008). Salt stress generally impairs the
5 vegetative growth of strawberry and causes leaf necroses and premature senescence with consequent reduction of the photosynthetic leaf area (Keutgen and Pawelzik, 2009). As a result, the level of carbohydrates production and translocation to growing fruit is reduced (Saied et al., 2005). High NaCl levels in the root zone may also unbalance nutrients uptake, enhance competitions of Na+ vs. K+, Ca2+, and Mg2+ (Khan et al., 2000) and impair assimilation of nitrogen (Alam, 1999; Mansour, 2000). Altogether these responses have a negative impact on yield and fruit quality (Awang and Atherton 1995a, 1995b).
Although evidence for a clear cause-effect relationship between physiological and/or molecular components and tolerance traits has somehow been hindered by the complex genetics of this species (Husaini and Abdin, 2008), correlative analyses have partially shed some light on critical tolerance mechanisms in strawberry (Turhan and Eris, 2005; Keutgen and Pawelzik, 2009). Ion redistribution and compartmentalization in different plant tissues and organs has been highlighted as an important mechanism to protect sensitive tissues from Na+ accumulation and toxicity (Keutgen and Pawelzik, 2009). Transgenic analysis has also revealed that high constitutive osmolytes levels and reduced growth can both facilitate plant stress adaptation (Husaini and Abdin, 2008). Moreover, the activity of antioxidant enzymes and the control of the stomatal response to salinity have been indicated as physiological traits that may differentiate salt-tolerant vs. salt sensitive cultivars (Turhan et al., 2008).
Several studies have demonstrated that the stomatal control of transpiration-mediated ion fluxes to the shoot could delay the appearance of toxicity symptoms, while allowing plants to adapt to unfavorable conditions (Moya et al., 1999; Dalton et al., 2000; Maggio et al., 2007). Nevertheless, while adaptation via stomata closure may be advantageous under transitory stress (hours, days) to cope with osmotic stress and minimize water loss, it would negatively impact yield over a growth season since a reduced stomatal conductance would also restrict CO2 uptake. That is why strategies to
improve salinity stress tolerance via manipulation of stomatal conductance have rarely been successful (Thompson et al., 2007). It has been recently shown that a reduced stomatal density may partially compensate the trade-off between plant growth and adaptation (Ouyang et al., 2010) and therefore be advantageous under saline stress.
Using two strawberry cultivars with divergent responses to salinity, in this study we attempted to establish a functional link between morphological/physiological traits and
6 stress tolerance. Here we demonstrate that constitutive low transpiration fluxes associated to a reduced stomatal density may uncouple plant adaptation and yield reduction under saline stress in a specific agricultural context.
2 Materials and methods
Two experiments were carried out to characterize the response to salinity in the strawberry cultivars Elsanta and Elsinore, which had shown a diverse degree of stress tolerance in preliminary tests. Strawberry plantlets were kindly donated by a local nursery (Salvi vivai, Ferrara, Italy). The first experiment was conducted in a greenhouse in order to identify morphological and physiological traits that could be associated to salinity tolerance in the two cultivars under assessment. Subsequently, water relation parameters in response to salinity stress were analyzed in a growth chamber experiment under fully controlled environmental conditions.
2.1 Experiment 1
2.1.1 Plant material and growth conditions
The experiment was conducted in a glasshouse at the experimental station of the University of Bologna, located in Ozzano dell’Emilia (44º26”38 N, 11º26’18’’ E, 98 m a.s.l.). Plantlets of similar height and diameter were transplanted into plastic pots of 5 l volume (1 plant/pot) filled with a mix of commercial growing media and pumice (2:1 v/v) on February 16th, 2010. Pots were placed over benches at a density of approximately 9 plants m-2. Plants were irrigated automatically three times per day to ensure adequate substrate moisture. Fertigation was carried out once a week by adding to the irrigation water plant nutrients at the following concentrations: N-NO3 = 6.0 mM; N-NH4 = 1.0 mM;
PO43- = 3.0 mM; K+ = 4.0 mM; SO42- = 7.0 mM; Ca2+ = 5.0 mM; Mg2+ = 4.0 mM;
microelements in traces, at a final EC = 1.75 dS m-1. Before salt stress, plants stolons were
removed to improve the vegetative growth and the quality of fruit. Inside the greenhouse temperatures ranged between12 and 38 °C, RH was 60-70% and Photosynthetically Active Radiation (PAR) during central hours of the day reached 700-1100 μmol m-2 s-1.
7 2.1.2 Treatments and experimental design
Eight treatments, derived by the factorial combination of 2 cultivars (Elsanta and Elsinore) and 4 NaCl concentrations in the irrigation water (0, 10, 20 and 40 mM), were compared. The experimental design was a strip plot (salt assigned to the main plots and cultivars to the sub-plots) with 3 replications. Each plot included 8 plants. The salt stress treatment was initiated on April 1st (44 days after transplanting, when the plants had 6-7 leaves), by irrigating plants with a water solution of 0 mM NaCl (control, ECw = 0.45 dS
m-1), 10 mM NaCl (EC
w = 0.97dS m-1), 20 mM NaCl (ECw = 1.95 dS m-1) and 40 mM
NaCl (ECw = 3.90 dS m-1). When the irrigation coincided with the fertigation (once a
week), the ECw were 1.75, 2.30, 4.30 and 6.50 dS m-1 for 0, 10, 20 and 40 mM NaCl
treatments, respectively. This irrigation regime was maintained until the end of the experiment.
2.1.3 Growth and yield assessment
Fruit-setting started on April 15th (14 days after stress treatment initiation, DAS). Fruit of all plants were harvested manually at full maturity on four dates: May 5th, 10th, 17th, and 27th (corresponding to 34, 39, 46 and 56 DAS, respectively). At the end of the experiment (June 7th, 67 DAS), three plants per each plot were randomly selected and harvested. Numbers of leaves, shoot fresh and dry weights were measured. The leaf area (LA) was determined by using a scanner and the image processor software Image J (Abramoff et al., 2004).
2.1.4 Stomatal size and density
Micromorphological observations were carried out at 15 DAS on three 1cm2 portions per leaf (excised from areas between the main veins) using a bright-field light microscope (Meiji Techno Co., LTD, Japan). Stomata frequencies per surface unit (n mm
8 2.1.5 Leaf gas exchanges
Leaf evaporation (E), stomatal conductance (gs) and net photosynthesis (A) were
measured at 2 and 58 DAS on the youngest fully expanded leaf of two plants per plot, using a CIRAS-2 infrared gas analyzer (PPSystem, Hitchin, UK) with a Parkinson’s Automatic Universal Leaf Cuvette equipped with 2.5-cm2 area cuvette inserts (environmental conditions inside the cuvette were set as follows: PAR=1000 μmol m-2 s-1;
leaf temperature=26 ºC, CO2 =450 ppm, equal to the environmental conditions inside the
glasshouse at the time of sampling).
2.1.6 Plant water relations
At 10 DAS, three pots per plot were sealed with a plastic film to prevent water loss from the soil surface, leaving the plant shoot protruding from the film. Before sealing the film at the crown, plants were re-watered to pot capacity with water (control), or water plus 10, 20 or 40 mM NaCl. Each plant was then placed on an electronic balance under glasshouse conditions and the weight loss was measured every hour for 24 hrs. Water loss values were normalized respect to whole plant dry weights or leaf areas taken at the end of the measurements.
2.1.7 K+, Na+ and Cl- contents
Two plants per plot were collected at the beginning of fruit harvest, on May 7th (36 DAS), for ion determinations. Three hundred mg of dried and ground plant tissues were mixed with 30 ml of deionized water, shaken for 24 hours at 25 ºC and then centrifuged at 10.000 rpm for 5 min. Subsequently, the supernatant was collected and filtered through Whatman paper no. 1 (0.45μm Ø). A capillary electrophoresis system (Beckman P/ACE 5500, Pegasus scientific, Rockville, MD, USA) was used for the quantification of Cl-, Na+ and K+ according to the method described in Dinelli et al. (1998), and Orsini et al., (2011). Ions were quantified using conventional 50cm long (from injection point to detector) untreated fused silica capillaries (75 μm internal diameter, Beckman, Rockville, MD, USA) at a constant temperature of 25 ºC. The indirect detection wavelength was 220 nm.
9 The applied voltage was -20 and 20 kV for anion and cation separation, respectively. The electrolyte buffer employed for the determination of the anions was 1.8 mM potassium dichromate, 34 mM boric acid, 14 mM sodium borate, and 1 mM diethylenetriamine. The electrolyte buffer for K+ and Na+ determination was 40 mM citric acid and 23 mM imidazole. Ion concentration was expressed as mg g-1 dry weight.
2.2 Experiment 2
2.2.1 Plant material and growth conditions
This experiment was conducted in a growth chamber with a photosynthetic photon flux of 500 μmol m-2 s-1 from cool-white fluorescent bulbs and a 16-h light/8-h dark
photoperiod. Day and night temperatures were set at 22 ºC and 19 ºC, respectively. Plantlets were transplanted on September 10th, 2010 into plastic pots of 1.5 l volume (1 plant each pot) filled with a mix of perlite and pumice (2:1 v/ v). As in the first experiment, plants stolons were removed before salt stress application. Plants were automatically irrigated three times per day by using adequate amount of fertilized water (same composition as in exp.1). Plants were harvested at 90 days after transplanting, on December 9th, 2010. Biomass and leaf area determination were performed as in experiment 1.
2.2.2 Treatments and experimental design
Four treatments were compared, obtained from the factorial combination of 2 cultivars (Elsanta and Elsinore) and 2 NaCl concentrations in the nutrient solution (0 and 40 mM). The ECw of the two nutrient solutions was 1.75 and 6.50 dS m-1, respectively.
The experimental design was a full randomization with plants being the elemental replicates (n = 24). Salt stress was applied starting 40 days after transplanting and was maintained until the end of the experiment.
10 2.2.3 Plant water relations
Total leaf water potentials (Ψt) were determined on six samples per plot at 20 DAS
with a dew-point psychrometer (WP4, Decagon Devices, Washington, WA). The osmotic potential (Ψπ) was estimated on frozen/thawed leaf samples and the pressure potential
(Ψp) as the difference between Ψt and Ψπ, assuming a matrix potential equal to 0. Leaf
osmotic adjustment (LOA) was determined as follows: LOA =Ψπ0 V0 - Ψπ V, where Ψπ0 V0
is the product of (osmotic potential) × (osmotic volume) of unstressed plants and Ψπ V is
the product of (osmotic potential) × (osmotic volume) of leaves from salinized plants. For each measurement, the osmotic volume was approximated by the corresponding relative water content (RWC) value calculated as: RWC = (leaf fresh weight – leaf dry weight) / (leaf saturated weight – leaf dry weight). Leaf saturated weight was determined after leaf immersion in distilled water for 24 hrs (Orsini et al., 2010b).
3 Statistical analysis
Data were analyzed by ANOVA. Relationships between salt concentration in the irrigation water and plant dry weight, leaf area and yield were evaluated by regression analysis.
4 Results
4.1 Plant growth in response to salinity
Both cultivars were significantly affected by salinity. The regression analysis identified highly significant differences (P≤0.001) in both intercepts and slopes of the linear functions defined by LA and DW in response to salinity, with Elsanta being relatively more tolerant than Elsinore in terms of leaf area (LA) and dry biomass (DW) (Fig. 2-1). Elsinore plants had a 55% and 46% reduction of LA and DW respectively at 20 mM NaCl (Fig. 2-1). However, these plants did not tolerate the highest NaCl concentration (40 mM) tested in this experiment and virtually died at 60 DAS. In contrast, Elsanta plants presented only limited leaf damages at 40 mM NaCl, although they had
11 68% and 52% reductions in LA and DW, respectively. For both cultivars, the leaf number was not affected after 36 days of salinization (Table 2-1), whereas a general decrease in the number of leaves was observed at the end of the experiment (Fig. 2-2, Table 2-1). Elsinore presented higher yield respect to Elsanta in absence of stress (Fig. 2-3). Nevertheless, upon salinization, the yield was reduced by 32% and 16% in Elsinore and Elsanta, respectively.
A similar response was observed in the growth-chamber experiment (data not shown): at 40 mM NaCl, Elsinore plants were irreversibly damaged, whereas Elsanta presented only moderate damages with a 21% and 50% decrease in DW and LA, respectively.
4.2 Na+, K+ and Cl- distribution
A different pattern of ion accumulation in plant organs was observed in the two cultivars. At increasing salinity, the concentration of K+ was not significantly affected respect to control plants (ranging between 30 and 40 mg g-1 DW in leaves and 10-24 mg g
-1 DW in the crown, Table 2-1), whereas Na+ and Cl- concentrations increased, reaching
the highest values in Elsinore (Table 2-1; Fig. 2-4). Comparable concentrations of Na+ and Cl- were found in leaves and crowns of Elsanta. In contrast, the concentration of Na+ in Elsinore was much higher in crowns, whereas Cl- mainly accumulated in the leaves (Fig. 2-4). The tissue accumulation of Na+ and the competition with K+ altered the K+: Na+ ratio, which was reduced much more in both leaves and crowns of Elsanta than Elsinore at the highest salinity (Table 2-2). With the exception of an high value (4.4) for Elsinore at 40 mM NaCl, which was actually not statistically different from the value at 20 mM for the same cultivar (2.1), the K+:Na+ ratio was always higher in both leaves and crowns of Elsanta. Considering that no major differences were found in terms of K+ accumulation, these results are consistent with the presence of more efficient root Na+ exclusion mechanisms in Elsanta compared to Elsinore (Table 2-2).
4.3 Water relations and leaf gas exchanges
Salinity significantly reduced stomatal conductance (gs), leaf transpiration (E) and
12 plants in Elsanta exposed to 10 and 20 mM NaCl (Fig. 2-5). For these plants, an additional 39% reduction was observed upon 40 mM NaCl stress. In contrast, gs was affected in
Elsinore only at 40 mM NaCl (46% decrease). After 58 DAS, gs was reduced of 89 and
-82% in Elsanta and Elsinore, respectively. However Elsanta plants were not further affected by salinity, whereas 49% and 88% reductions of gs were observed in Elsinore at
10 and 20 mM NaCl, respectively. Plant transpiration (E) followed a similar pattern as gs
(data not shown).
The photosynthetic activity (A) decreased of 20% in Elsanta at 10 mM NaCl (at 2 DAS), yet it remained constant upon more severe salinization. The photosynthetic activity in Elsinore was not affected in the short term. Interestingly, at 58 DAS, no differences among the cultivars were observed for A at 0 and 10 mM NaCl. The photosynthetic activity was virtually absent in Elsinore at higher salinity, while only a 56% reduction was found in Elsanta. The transpiration efficiency (A/E) at 2 DAS was similar in Elsanta and Elsinore under control conditions (6.9 vs. 5.6 mM CO2 mM H2O) and at 40 mM NaCl (8.2
vs. 8.5 mM CO2 mM H2O). In contrast, at 58 DAS, A/E was higher in Elsanta respect to
Elsinore under both control (10.5 vs. 4.4 mM CO2 mM H2O) and 40 mM NaCl (9.9 mM
CO2 mM H2O in Elsanta; non-detactable in Elsinore).
These findings were substantiated when whole-plant water loss was monitored over 24 hours in salt-acclimated plants (Fig. 2-6). Under control conditions, the average water loss in Elsinore during the central hours of the day (between 12:00 PM and 3:00 PM) was approximately 1.5 fold higher than Elsanta. Upon salinization, water loss was moderately affected in Elsanta plants, whereas a substantial decrease was observed in Elsinore at all salinity levels tested. Consistently, the daily average of whole-plant water loss was higher in Elsinore as compared to Elsanta at 0, 10 and 20 mM NaCl and it declined sharply at increasing salinity. In contrast, the daily plant water loss was rather constant in Elsanta and was greater than Elsionre at 40 mM NaCl (Fig. 2-7).
The number of stomata per leaf area unit was 1.5-fold higher in Elsinore compared to Elsanta (Fig. 2-8). In addition, stomatal density was not affected by salinity in Elsinore, whereas in Elsanta the number of stomata per unit leaf area decreased by 25% and 21% at 10 and 20 mM NaCl, respectively.
Similar Ψt were found in the two cultivars under control conditions, while a greater
13 These results were in line with the greater water loss experienced by these plants upon salinization. In absence of stress, a moderately lowerΨπ was observed in Elsinore
compared to Elsanta, which could have actually facilitated adaptation to the oncoming stress in the former. However, the similar Ψπ decay rate in response to salinity reflected
the inability of Elsinore to effectively adjust to the hyperosmotic environment, as confirmed by the lower Ψt, and RWC values in Elsinore and the similar LOA between the
two cultivars (Fig. 2-9).
5 Discussion
5.1 A functional leaf area is associated with yield improvement in salt stressed strawberry plants
A diverse degree of salt tolerance among strawberry cultivars has been documented (Yilmaz and Kina, 2008; Turhan et al., 2008; Keutgen and Pawelzik, 2009). However, the functional basis of such diversity has rarely been linked to physiological and genetic determinants (Turhan and Eris, 2005). Upon salt stress, yield was significantly reduced in the cultivar Elsinore, whose leaf area was much more affected than Elsanta at increasing salinity (Fig. 2-1). Specifically, salinity reduced the leaf number rather than the mean leaf area in a time-dependent manner. At 36 DAS the number of leaves was similar for the two cultivars and only later, at 67 DAS, a rapid decay of the number of leaves in Elsinore was observed (Fig. 2-2). Leaf area reduction is a common response in salt stressed plants, including strawberry (Saied et al., 2005; Yilmaz and Kina, 2008). On a plant basis, smaller leaf areas could be a consequence of stress induced inhibition of cell division (Verslues and Zhu, 2007) and photosynthetic activity (Yilmaz and Kina, 2008), both of which would affect the overall plant development (Keutgen and Pawelzik, 2009). However, leaf area reductions in salinized plants could also be determined by an anticipated leaf abscission as a consequence of hormone-mediated senescence and/or ion toxicity (Munns and Tester, 2008; Turhan and Eris, 2005). The patterns of Na+ and Cl -accumulation suggests that the observed leaf abscission was likely due to a faster and/or greater leaf ion accumulation in Elsinore which in turn manifested anticipated toxicity symptoms, including tissue necrosis and premature senescence (Fig. 2-4). Maintenance of a large leaf area upon saline stress may be critical to guarantee production, availability and
14 translocation of photosynthates to the fruit (Keutgen and Pawelzik, 2009) and it has been shown to benefit the final yield in strawberry. Saied et al. (2005) have demonstrated that upon exposure to 60 mM NaCl (ECw=5.1 dS m-1) the leaf area of the cv. Korona was
reduced by 13% respect to the non-salinized control vs. 34% reduction of Elsanta, with the former being more tolerant, on a relative basis, in terms of fruit fresh weight per plant. Similarly, despite the lower yield of Elsanta compared to Elsinore in absence of stress (165 vs. 220 g plant-1) the former was much less affected by salinity, as indicated by the slopes of the regression lines for yield vs. NaCl concentration (Fig. 2-3). Due to the constitutive (genetically determined) higher yield of Elsinore compared to Elsanta, the two cultivars had still comparable yield at high salinity tested; therefore these results must be interpreted in relative terms. Indeed, after a moderate yield reduction (-14%) at 10 mM NaCl, the fruit yield of Elsanta remained virtually unaffected up to 40 mM NaCl whereas it declined significantly in Elsinore. These results suggest that the maintenance of a functional leaf area under saline stress may beneficial for cultivars perscribed to be used exclusively in marginal environments in terms of salinity and/or drought. However, since a reduced stomatal density may partially compensate the trade-off between plant growth and adaptation (Husaini and Abdin, 2008; Ouyang et al., 2010), this could be an important stress tolerance trait that may have been lost in the selection of elite cultivars.
5.2 Control of ion Na+ and Cl- fluxes and organ distribution
Strawberry can be considered a Na+ excluder since it maintains low tissue Na+ contents at increasing salinity, as demonstrated in several cultivars including Elsanta
(Saied et al., 2005). The mechanism(s) through which Na+ exclusion is achieved may
include ion selectivity at root level and translocation/compartmentalization in non-photosynthesizing tissues (Tester and Davenport, 2003). Consistent with the existence of exclusion mechanisms, the leaf Na+ concentration did not increase at advanced salinization in both cultivars (Fig. 2-4). In addition, the increased Na+ concentration in the crown indicated that the protection of photosynthesizing tissues from Na+ accumulation occurred via re-translocation and/or compartmentalization in this anatomical region (Munns and
Tester, 2008). The mechanism of Na+ exclusion from the shoot was more efficient in
15 crown respect to Elsinore at increasing salinity (Fig. 2-4). This difference was consistent with a significantly higher K+/Na+ ratio observed in Elsanta (Table 2-2), which could be explained by exclusion/selective mechanisms at root level that may have restricted more efficiently Na+ flux to the shoot in Elsanta (Hasegawa et al., 2000; Tester and Davenport, 2003). Moreover, the lower leaf andcrown Na+ levels of Elsanta could be the result of a reduced ion uptake by the roots and/or reduced transpiration and consequent restricted ion fluxes to the shoots in the former (Turhan and Eris, 2005). This hypothesis is substantiated by the pattern of Cl- accumulation in the two cultivars (Fig. 2-4). In contrast to Na+, which can be partially controlled at root level, leaf Cl− concentrations increase progressively
(Prior at el., 2007), most likely because Cl- typically follows the transpiration flux (Lohaus et al., 2000; Maggio et al., 2007). Cl- accumulation rates in Elsanta and Elsinore were consistent with their transpiration rates, which were lower in the former either in control or salinized plants (Figs. 2-5, 2-6 and 2-7). The relationship between plant growth and transpiration-driven ion flux to the shoot has been formally addressed by Dalton et al. (2000) who also proposed that a reduced transpiration rate would restrict the accumulation of Cl- to the shoot and consequently delay the onset of a critical toxicity threshold (Moya et al., 1999; Dalton et al., 2000, 2001; Maggio et al 2002a). Although we cannot rule out the existence of different mechanisms for Na+ and Cl- detoxification at cellular and organ levels in both Elsanta and Elsinore, it is worth emphasizing that the transpiration-mediated restriction of Cl- flux to the shoot (Gilliham and Tester, 2005) turned out to be an effective escaping strategy that delayed the shoot damages respect to the reproductive stage and allowed plants to maintain high photosynshtetic rates (Tavakkoli et al., 2011).
5.3 Low stomatal density and reduced transpiration facilitate strawberry adaptation to salinity
Most work on breeding and genetic engineering for salt tolerance has given minor attention to the functional link between transpirational flux and shoot ions accumulation as potential target to improve tolerance. This is because the beneficial effects due to a reduced transpiration under stress (e.g. re-establishment of tissue turgor; delayed ion accumulation) would also limit photosynthesis and consequently and consequently yield (Condon et al., 2002). Nevertheless, field and/or soilless salinization is a dynamic process
16 that evolves over a growth season, since it is mostly associated to irrigation (De Pascale et al., 2005) and as such it must be considered respect to the species-specific developmental pattern. In this respect, our data indicate that reduced gas exchanges early in the season may partially impair the photosynthetic activity (Fig. 2-5) but may also protect plants from a rapid dehydration (Fig. 2-9), which moreover would also activate a series of stress signals that would further affect plant growth (Maggio et al., 2002; Ruggiero et al., 2004). Over the entire crop cycle, a constitutive plant stress pre-adaptation status, associated with reduced levels of leaf gas exchanges, may have an important role in extending the functionality of the photosynthetic leaf surface in coincidence with fruit-set and fruit growth. Elsanta plants had a constitutive reduced daily transpiration compared to Elsinore (Fig. 2-7). This may have contributed to pre-adapt plants in the long run (growth season), as indicated by the reversed response of Elsanta and Elsinore in terms of daily water loss (Fig. 2-7) and photosynthesis (Fig. 2-5) at advanced salinization. The instantaneous measurements of stomatal conductance and leaf transpiration were consistent with a better hydration state of Elsanta compared to Elsinore and in general reflected the gravimetric measurements performed on a whole plant basis (Fig. 2-7) (i.e. the opposite response of Elsanta and Elsinore at 0 and 40 mM NaCl was confirmed). However, the apparent inconsistency between different water loss on a whole plant basis and similar gs between
the two cultivar in absence of salt (control), revealed some limitations of instantaneous gas exchange measurements that could be affected by many variables, including heterogeneity of stomatal opening (patchiness) and light conditions (Eisinger et al., 2000) and time of measurement. This is an important aspect to be considered either when gas exchange measurements are used for rapid screening of germplasm collections (Ashraf, 2004) or when these values are integrated into more complex models for predicting plant water use.
The control of transpiration water fluxes under drought or salinity stress has recently gained a renovated interest due to identification of genetic determinants regulating stomatal patterning, leaf gas exchanges and water use efficiency in stressed plants (Chartzoulakis and Klapaki, 2000; Sade et al., 2010). Low transpiration rates have been correlated to increased salt tolerance (Maggio et al., 2006) and water deficit tolerance as a result of 25% reduction of abaxial stomatal density (Yoo et al., 2010). In line with these findings, the reduced water loss of Elsanta was also correlated with a 27% reduction
17 of stomatal density (Fig. 2-8). It is worth emphasizing that the constitutive pre-adaptation state, determined by a reduced stomatal density, seemed to benefit plant growth and yield under saline stress more effectively than a rapid salt-induced stomatal closure. Turhan et al. (2008) have demonstrated that exposure to NaCl caused a prompt gs reduction in the
more sensitive cultivar Camarosa, whereas salinity up to 34.0 mM NaCl did not have any influence on gs of the more tolerant Tioga and Chandler, further indicating that stomatal
closure may act as signal to activate multiple stress responses, including plant growth inhibition, which may be deleterious in terms of yield (Awang and Atherton, 1995a; Maggio et al., 2002b; Ruggiero et al., 2004).
6
Conclusion
The results of this study indicated that low stomatal density, and the consequent constitutively reduced transpirational flux, is a critical stress tolerance determinant that may allow plants to adapt more effectively to salinity. The reduced transpiration rate of the cultivar Elsanta was functional to delay the accumulation of Cl- ions to the shoot (and their effects on leaf senescence) and to ameliorate plant water status under stress. At low/moderate salinity, Na+ exclusion systems may have also contributed to sustain salt stress adaptation in Elsanta.
Acknowledgements
We wish to thank Salvi vivai for providing the plant material. We acknowledge the support of Prof. Giovanni Dinelli and Dr. Mattia Accorsi for the ion analyses.
18
7 Tables
Table 2-1: Summary ANOVA table for the parameters under assessment in two strawberry cultivars, Elsanta and Elsinore, in response to four salinity treatments (0, 10, 20 and 40 mM NaCl). DAS = days after stress treatment initiation; gs = stomatal conductance; E =
leaf transpiration; A = net photosynthesis; ns = non significant differences; * = significant differences at P≤0.05; ** = significant differences at P≤0.01; *** = significant differences at P≤0.001.
Variable DAS Block
(Bl) Salt Cultivar (C) S x C Leaf number 36 ns ns ns ns 67 ns ns *** *
Ion concentration K+ Leaf 36 ns ns ns ns
Crown 36 ns ns ns ns
Na+ Leaf 36 ns *** ** **
Crown 36 ns *** *** **
Cl- Leaf 36 ns *** ** ns
Crown 36 ns *** ns ns
Leaf gas exchanges gs 2 ns ** ** ns
58 ns ** ** **
E 2 ns ** * ns
58 ns ** ** **
A 2 ns ** ** *
58 ns ** * **
Water loss Per plant 10 *** *** * ***
Per unit DW 10 *** *** *** *** Stomata Length 15 ns *** *** ns Density 15 ns *** *** *** Water relations Ψt 20 ns ** *** *** Ψπ 20 ns *** *** ns RWC 20 ns ns *** ** LOA 20 ns nd ns nd
19 Table 2-2: Effect of salt stress (0, 10, 20 and 40 mM NaCl) K+/Na+ ratio in leaf and crown of two strawberry cultivars (Elsanta and Elsinore).
NaCl (mM) Elsanta Elsinore
Leaf Crown Leaf Crown
0 14.6 12.9 8.8 6.8
10 3.7 3.0 2.4 0.9
20 5.5 2.4 2.1 0.8
20
8 Figures
Figure 2-1: Effect of saline treatments (0, 10, 20 and 40 mM NaCl) on dry weight and leaf area in two strawberry cultivars, Elsanta (closed circles) and Elsinore (open circles). At the
time of measurements plants were 111 days old. Equations indicate regression lines. Mean values ± SE (n = 9).
21 Figure 2-2: Leaf number of two strawberry cultivars, Elsanta (closed circles) and Elsinore (open circles), after 36 and 67 days of growth at different NaCl concentrations (0, 10, 20 and 40 mM) in the nutrient solution. Mean values ± SE (n = 9).
22 Figure 2-3: Fruit yield of two strawberry cultivars, Elsanta (closed circles) and Elsinore (open circles), grown at different NaCl concentrations (0, 10, 20 and 40 mM) in the nutrient solution. At the time of measurements plants were 111 days old. Equations indicate regression lines. Mean values ± SE (n = 18).
23 Figure 2-4: Ion contents in leaves and crowns of two strawberry cultivars, Elsanta (closed squares) and Elsinore (open squares), grown at different NaCl concentrations (0, 10, 20 and 40 mM) in the nutrient solution for 36 days. At the time of measurements plants were 80 days old. Mean values ± SE. (n = 6).
24 Figure 2-5: Leaf gas exchanges in two strawberry cultivars, Elsanta (closed squares) and Elsinore (open squares), exposed to saline irrigation (0, 10, 20 and 40 mM NaCl). DAS = days after salt treatment initiation; gs = stomatal conductance; E = leaf transpiration; A =
25 Figure 2-6: Daily pattern of water loss in two strawberry cultivars, Elsanta and Elsinore, irrigated with 0 (closed squares), 10 (open squares), 20 (closed circles) and 40 (open circles) mM NaCl solutions. At the time of measurements plants were 54 days old. Measures were carried out after ten days of irrigation with different NaCl solutions. Plants were grown singularly in 5 l pots, which were sealed in plastic wrap and placed on electronic balances. Water loss was determined every 60 min for 1 day. Mean values ± SE (n = 9).
26 Figure 2-7: Daily average whole-plant water loss in two strawberry cultivars, Elsanta (closed squares) and Elsinore (open squares), after ten days of saline irrigation (0, 10, 20 and 40 mM NaCl). At the time of measurements plants were 54 days old. Plants were grown singularly in 5 l pots, which were sealed in plastic wrap and placed on electronic balances. Water loss was determined every 60 min for 1 day. Mean values over the 24-hours are shown (n = 9).
27 Figure 2-8: Stomatal density in two strawberry cultivars, Elsanta (closed squares) and Elsinore (open squares), exposed to saline irrigation (0, 10, 20 and 40 mM NaCl) for 15 days. At the time of measurements plants were 59 days old. Mean values ± SE (n = 9).
28 Figure 2-9: Water potential (Ψt), osmotic potential (Ψπ), relative water content (RWC) and
leaf osmotic adjustment (LOA) in two strawberry cultivars, Elsanta (closed symbols) and Elsinore (open symbols), grown in a growth chamber under cool-white fluorescent light and irrigated with saline water (0 and 40 mM NaCl) for 20 days. At the time of measurements plants were 60 days old. Mean values ± SE (n = 6).
29
Response of endogenous proline, total soluble proteins, lipid
peroxidation, and antioxidative enzymes in leaves of two strawberry
cultivars (Elsanta and Elsinore) to long- terms of salt stress
1 Introduction
In plants, salt stress leads to an enhanced generation of reactive oxygen species (ROS), such as superoxide anion (O2-•), hydroxyl radical (•OH) and hydrogen peroxide
(H2O2). Double functions for ROS in plants have been proposed, as they serve as key
regulators of growth, development, and defense pathways, as well as at excessive levels they cause oxidative damage to fundamental cellular components, such as membranes, proteins and nucleic acids (Miller et al., 2010; Mittler et al., 2004). The detoxification of excess ROS is achieved by an efficient antioxidative system comprising of the non enzymatic system, such as ascorbate, phenolics, proline and soluble proteins and the enzymatic system, such as superoxide dismutase (SOD), Catalase (CAT) and peroxidase (POD) (Gill and Tuteja., 2010). Change in the activities of antioxidant enzymes and the levels of some nonenzymatic antioxidants were assessed for their use as markers of salt tolerance in different plant species (Sharma et al., 2011). The maintenance of a high antioxidant capacity to scavenge the toxic reactive oxygen species (ROS) has been linked to plants tolerance increase of abiotic stress (Agarwal and Shaheen., 2007; Zaefyzadehet et al., 2009).
In strawberry, moderate salinity induced an increase of antioxidant activity in cv. Korona and cv. Elsanta (Keutgen and Pawelzik., 2007). The effect of salinity on enzymatic antioxidant systems has been studied on different strawberry organs. On fruit, on the one hand, an increment of superoxide dismutase (SOD) activity in the fruit of cv. Korona under salt condition was observed(Keutgen and Pawelzik., 2007).On leaf, on the other hand, SOD activity did not change in cv. Selva while POD activity was enhanced under salt condition (Tanou et al., 2009). CAT activity decreased in response to salt condition in cv. Tioga, while in cv. Camarosa and cv. Chandler no modifications were observed (Turhan and Eris., 2008). The level of lipid peroxidation has been widely used as an indicator of free radical mediated damage to cell membranes under stressful conditions