Corso di Laurea Magistrale in Informatica
SocialCircles! An application for the
analysis of user’s behaviour in Online
Social Networks
Candidato:
Marco Dondio
Relatori:
Prof.ssa Laura Ricci
Dott.ssa Barbara Guidi
1 Introduction 1
2 State Of The Art 6
2.1 Complex Networks and OSN . . . 6
2.2 Complex Networks Properties . . . 6
2.2.1 Small World . . . 7
2.2.2 Clustering . . . 7
2.2.3 Degree distribution, scale-free network model and network resilience . . . 9
2.2.4 Centrality . . . 10
2.3 Ego Networks . . . 11
2.3.1 The Dunbar circles . . . 12
2.3.2 Ego Betweenness Centrality . . . 13
2.4 Clustering Algorithms . . . 15
2.4.1 K-means . . . 15
2.4.2 Communities detection algorithms . . . 16
2.5 DOSN . . . 23
2.5.1 DOSN issues . . . 24
2.6 Data persistence . . . 26
2.6.1 Data replication . . . 27
2.6.2 Social storage . . . 27
3 Collecting social data: motivations 30 3.1 Social data and open issues . . . 30
3.1.1 User Trustness . . . 31
3.1.2 Temporal availability of users . . . 31
3.1.3 Data persistency: the social approach . . . 32
3.2 The lack of real data . . . 33
3.3 Our target . . . 36
3.3.1 The choice of the OSN . . . 36
3.3.3 The analysis of data . . . 38
4 SocialCircles! 39 4.1 Introduction . . . 39
4.2 The HTTP Crawler . . . 40
4.3 What data can we obtain? . . . 41
4.4 The SocialCircles! functionalities . . . 41
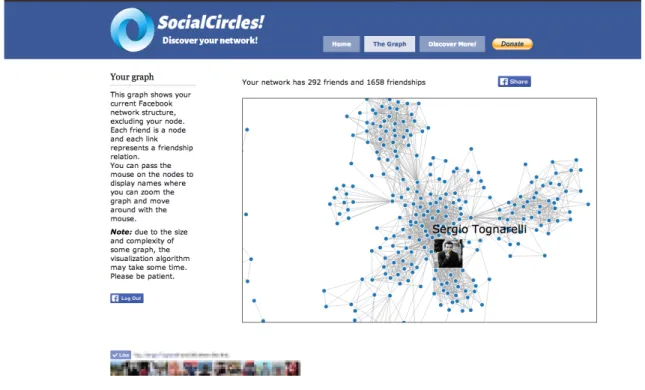
4.4.1 The Graph page . . . 42
4.4.2 The Statistics page . . . 43
4.4.3 The Interactions page . . . 44
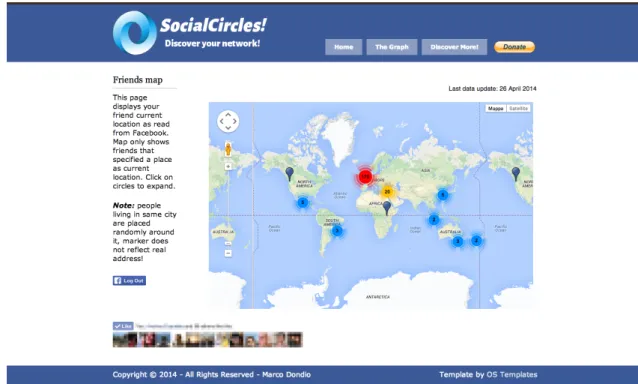
4.4.4 Friends Map page . . . 46
4.4.5 About and Privacy statements . . . 47
4.5 The application structure . . . 47
4.6 The development technologies and tools . . . 48
4.6.1 Front-End technologies . . . 48
4.6.2 Server technologies . . . 49
4.6.3 Database technologies . . . 50
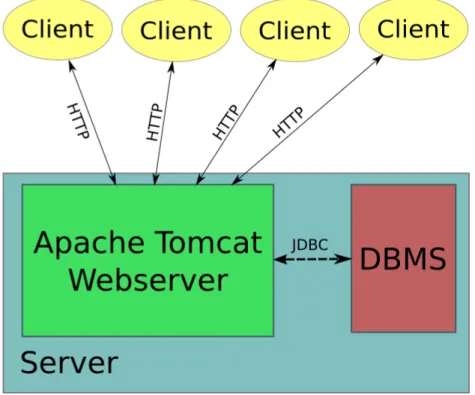
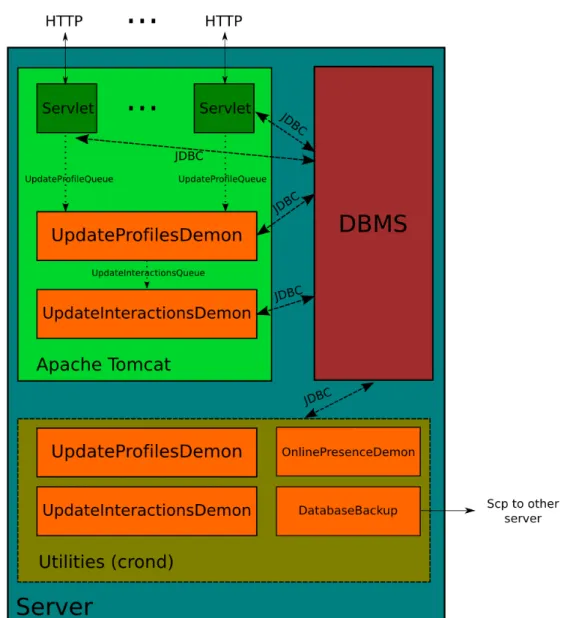
4.7 The server side . . . 51
4.7.1 The filter level . . . 51
4.7.2 The servlet level . . . 53
4.7.3 The background demons level . . . 55
4.7.4 Other demons and maintenance script . . . 56
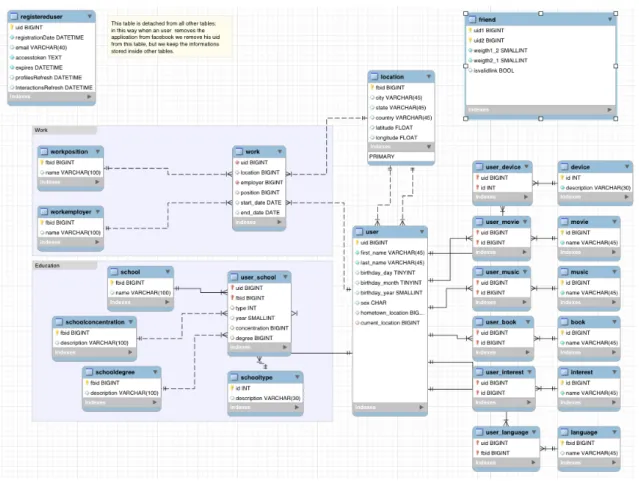
4.8 The database . . . 58
4.8.1 Service tables . . . 58
4.8.2 Topology and profiles tables . . . 59
4.8.3 Interaction Information tables . . . 61
4.8.4 Online status table . . . 64
4.9 The hosting and the deployment . . . 64
4.10 The application publishing . . . 65
4.11 Future work and problems . . . 65
5 The Dataset Analysis 67 5.1 Introduction . . . 67
5.2 Methodology and technologies used . . . 68
5.3 Statistic Measures . . . 69
5.4 Topology . . . 71
5.4.1 Node and edges distribution . . . 71
5.4.2 Clustering coefficient distribution . . . 73
5.4.3 Local degrees nodes distribution . . . 74
5.4.4 Ego betwenness centrality . . . 75
5.4.6 Clique analysis . . . 78
5.5 Profile Information . . . 84
5.6 Interactions and tie strength . . . 85
5.6.1 Ego active network . . . 86
5.6.2 Interactions direction . . . 88
5.6.3 Interactions composition . . . 88
5.6.4 The tie strenght distribution . . . 90
5.6.5 The Dunbar circles . . . 91
5.7 Online status . . . 94
5.7.1 Users availability . . . 95
5.7.2 User sessions . . . 96
5.7.3 Active Friends Sessions . . . 99
6 Conclusion and Future works 101 6.1 Future directions: some proposals . . . 102
Innanzitutto desidero ringraziare la Professoressa Laura Ricci e il fondamentale supporto del suo gruppo di ricerca, in particolare la dottoressa Barbara Guidi ed il dottor Andrea De Salve, tutte persone fantastiche, estremamente preparate e disponibili con le quali ho avuto la fortuna e il piacere di collaborare in lunghe e pazienti sessioni di discussione e confronto. Vi sono debitore, anche per avermi insegnato a scrivere correttamente il verbo to assess... ;).
Ringrazio inoltre il professor Maurizio A. Bonuccelli per la disponibilit`a del ruolo di controrelatore di questa tesi.
Ringrazio in maniera speciale la mia fantastica famiglia ed in particolare i miei genitori che mi hanno sempre supportato e sostenuto in questo talvolta non facile percorso, consentendomi anche l’opportunit`a di e↵ettuare un indimenticabile periodo di studio Erasmus in Svezia di 6 mesi. Grazie nuovamente. Grazie anche a mio fratello (che rimarr`a probabilmente l’unico PhD della famiglia), mia sorella e rispettive famiglie, in particulare ai miei nipoti qui presenti, perch`e alla vostra tener`a et`a della mia presentazione potevate farne francamente anche a meno.
Un ringraziamento particolare alla mia preziosa Hala: even if you are not here today i feel your costant support and priceless love in every moment. Thanks for the patience during these long periods! See you presto tefleh, enti habibti wa 5o5ti, ba7ebbek kteeeeer :p enti fi albi dayman.
Ringrazio in particolare Marco “Eks” Riccio per la sua saggezza e i consigli non solo informatici di tutti questi anni, se sono arrivato a questo traguardo lo devo anche e soprattutto a te per avermi incoraggiato e aiutato all’inizio del mio percorso quando non ero sicuro di esserne all’altezza. Ringrazio i miei inquilini e amici di Via Filzi (anche conosciuti come I Sagnelloni ) Sergio e Leandro, per aver sopportato pazientemente questi lunghi mesi di problemi, test e sicuramente interessantissime spiegazioni dettagliate del mio lavoro. A questo punto probabilmente conoscerete meglio di me questa tesi e vi invito a migliorarla nel tempo libero tra un tiro di Fresbee e l’altro (ma Sergio `e meglio se si limita al backhand ).
Ringrazio i miei amici di vecchia data, i BS86 (Daniele e Paolo) che mi hanno
accompagnato per molti anni di scuola e di vita. Nonostante la lontananza
particolare ringrazio mister Paolo per la trasferta da Londra, ricordandogli che comunque una vacanza in estate in Italia non gli far`a certo male :p
Ringrazio il mio compagno di avventura svedese, Andrea, per gli avvenimenti epici dei quali `e stato testimone e protagonista in quel di Uppsala e che forse `e meglio raccontare in altra sede. Ti devo ringraziare anche per avermi spinto a fare quel viaggio che tu sai in un momento importante. Chiss`a che forse in futuro non
ci si ritrovi in Sverige! Hej d˚a!
Ringrazio il mio grande amico Magnus Larsson, oggi qui presente e arrivato direttamente dalla Svezia: need to thank you my friend for the time spent working together (long nights at Polacksbacken/Ekonomikum/l¨agenhet missing northern lights because of coding...) and the uncountable funny moments and adventures we passed. I will remind him not to listen to me and take pictures while we are on holiday, i think he will agree. About this, we still need to call our Jordan friend for a hanging out, don’t forget. I hope next time you come Italy the first thing you will say is jag ¨ar en jordgubbe, or if you prefer, sono una fragola.
In questi anni pisani ho incontrato anche per caso molte persone preziose che hanno reso questi anni particolarmente speciali per me: senza di voi questo percorso non sarebbe stato lo stesso. Ringrazio tutto il numeroso gruppo di amici che ho conosciuto in questi anni per i bei momenti: Agnese, Alessandra, Alberto, Beatrice, Bruna, Chiara C., Cp, Chiara R., Davide, Il Bello, Il Doppio, Laura, Ludo, Maria, Prico, la Robb`e. Ringrazio anche i miei ex fantastici inquilini di Casa Conforti, Chiara, Micol e Valerio, ricordando loro che anche se ci sentiamo poco ho sempre un grande ricordo di loro. Ringrazio inoltre i miei amici della laurea triennale, in particolare Marco, Giovanni, Simone e Daniele per il loro grande supporto. In bocca al lupo per il vostro futuro!
Come ultimi ringraziamenti ci tengo a citare quel benefattore di Mark Zuckenberg per aver regalato al mondo Facebook, strumento senza il quale questa tesi avrebbe avuto certamente un altro sviluppo. Mentre scrivo Sergio mi ricorda di ringraziare anche Luan Santana per la musica sertaneja che ci ha accompagnato
in queste ultime rilassanti settimane, con l’augurio che A B´ussola non smetta mai
di girare. Infine ringrazio la nazionale italiana di calcio, che uscendo anzitempo da questo mondiale 2014 mi ha permesso di concentrarmi sul lavoro a pieno ritmo. Grazie Balo.
Non ho pi`u niente da dire (ed era ora direte voi). Per cui, come direbbero quei
Introduction
In recent years Internet faced an interesting and significative evolution of its nature. From a technical perspective, the di↵usion of broadband connections and the development of many technologies made the web shift from a collection of static and mostly textual pages to a much more rich, interactive and multimedia oriented environment. From a social point of view, Internet evolved from a platform where people could find and consume information to a system where users can actively generate and share content: sites such as YouTube, WordPress and BlogSpot are
currently among the most popular in the world1. However, the most significative
phenomena in the last ten years of the web is without doubt the di↵usion of the Social Networks.
An Online Social Network (OSN) is a platform specifically designed for users to users, where people are encouraged to consume, generate, share content and interact with their friends by establishing connections. Nowadays dozens of OSNs exists and although being di↵erent they all focus on making users cooperate and interact.
A major di↵erence between these platforms lies in the target they aim. Many OSNs are specific for some function, i.e. LinkedIn or Glassdoor focus on the job world, TripAdvisor is specific for touristic recommendation and Foursquare let users share the location they visited, whereas other OSNs can be classified as being general purpose: in this category we find the most known and used OSN, such as Facebook, Google+, Myspace and Twitter. In particular Facebook is the world biggest OSN, claiming that as of 31 March 2014 there are 1.28 billion of
registered users2.
1http://www.alexa.com/topsites
Because of their huge impact on people’s lives, OSNs became a quite interesting research field and resource for many scientists: sociologists are investigating the dynamics occurring inside OSNs and trying to compare them with real life behaviours, computer scientists and engineers are focusing on the technical side by studying their properties, improving these architectures and optimizing their usage, data scientists have access to Big Data in an unprecedented way.
From a computer science perspective, the study of OSNs can target many objectives. Traditionally it can be exploited to discover topological properties and their evolution (for example their size, the number of interconnections, number of communities, the diameter... etc.) or to study how the information spreads in the network and identify key nodes (central nodes). Other works aim at having a better understanding of the interactions occurring in social networks between users, comparing them to past analysis conducted in o✏ine social networks. Finally, since few years, scientists started to investigate the temporal behaviour of users: the study of online sessions will help in characterizing the typical OSN usage and understanding how users interact with these platforms.
However, one of the main issue addressing these studies is the availability of up to date and real datasets: almost all the existing data, if not too old, only contains part of the desired information. We would like to have topological, interactions and temporal information all at once targeting a real OSN. The importance of having solid social data however, is motivated also to support studies towards a recent trend in the OSN evolution: the development of Distributed Online Social Networks (DOSNs) [1].
DOSNs are platforms which aim to o↵er OSN services, overcoming their major drawbacks: currently most famous OSNs are built on centralized architecture, with the presence of a single provider o↵ering the service and managing all involved information. Due to their key role, users are forced to share information which are targeted to their friends also with these infrastructures. In recent years people became more aware of the data and traces they everyday leave in these systems, and many privacy concerns arised. Recent events (such as the NSA scandal) emphasized furthermore the importance of the data integrity and contributed to damage even more the image of current OSNs providers, depicting them as unreliable entities.
This issue is one of the main concerns that has driven both scientists and the open source community towards the development of alternative solutions and paradigms to o↵er OSN services: this lead to the concept of Distributed Online Social Network, an infrastructure which aims to o↵er OSN services but without the presence of a centralized entity or provider: by taking advantage of distributed resources, which in some solutions are identified with the users themselves (in the case of P2P architechtures), the system should be able to assess e↵ectively the
privacy problem.
The design of a DOSN is a very complex task with respect to the design of a classical OSN: many more technical issues arise and solutions need to be proposed. With particular respect to P2P DOSN implementations, we cite briefly a few existing challenges:
• Dynamism and churn of nodes: topological and social dynamism • Scalability of system
• Search and addressing of nodes • Data security and protection • Information propagation • Data persistence
• Data availability
Recent approaches put much e↵ort on studying efficient solutions for data persistence and availability: these issues are among the most interesting but also the most complex to assess e↵ectively. Interesting works in this direction are [2] and [3], where authors propose to exploit existing social connections among users to define storage policies and select trusted points of memorization for users profiles and information.
The authors study the social graph giving particular importance on a single user perspective: the Ego Network [4] model is well suited for this purpose, representing a local view of the social graph relative to a user (the ego), where we consider only his friends and their interconnections. The nature of this model is investigated furthermore, taking advantage of the important sociological concept of Dunbar Circles [5]: the idea is that friends in an ego network can be described by di↵erent levels of intimacy and closeness to the ego. To reflect di↵erent levels of importance of these relationships, friendships are associated to a tie strenght, a numerical value describing their force. The knowledge of tie strength can be exploited to define the trustness of nodes. Moreover, temporal availability of nodes is another important aspect we should consider when electing proper points of storage for an ego.
Our thesis is therefore part of the wide research work involved in the study of data persistency and availability problem in DOSNs: we didn’t aim to create and study a new DOSN, instead we tried to understand which data are needed to design e↵ective and robust systems, we have been inspired in our work by the [6] study. We believe that rich updated datasets are needed, while unfortunately the current available data are not useful nor descriptive enough. The study of data
persistency using social overlays requires a rich set of information: in addition to topological information and node features (to define the social graph), we need also information regarding interactions occurring among users in time (to identify the most important friends), and finally information regarding the online status habits of users (to understand how nodes behave in the systems and how stable are their connections).
At current period of writing, as of our knowledge no existing dataset is able to provide all these features at once for a real OSN. Moreover, existing datasets (such as [7] [8] [9]) o↵er just partial information, and even more, were obtained from OSN systems few years ago, not reflecting the current real structure and scenario. So far, all the works had to create ad hoc aggregated or artificial datasets, expecially regarding the online status traces: direct measurements were rarely available.
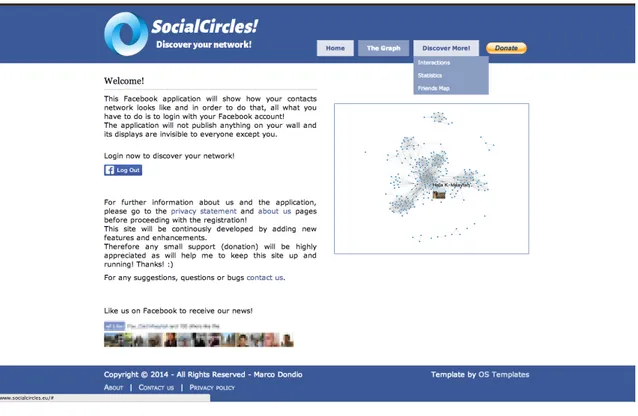
Our thesis has therefore a dual objective: first, we want to build an e↵ective and practical tool for the retrieval of data from a real OSN, building a complete dataset. By complete dataset we mean a dataset exposing the above mentioned characteristics: topology (with node profiles), interactions among users and online traces behaviour. We created for this purpose a dedicated Facebook application
called SocialCircles!3 which, based on Facebook applications API, was able to
fetch a large amount of data. We stored and organized the retrieved data in a relational database of 42 tables, constructing a solid dataset relative to 337 ego networks for a total of 144.481 OSN users.
The second objective of this thesis was a deep analysis of these social data: by using social graph analysis, data mining tool and ad-hoc programs, we were able to characterize the set of our networks, assessing di↵erent aspects and discovering useful traits. We first performed a detailed topologic analysis, with particular focus on the presence of cliques and communities of nodes and their importance. We then analysed the nature of interactions occurring in each of the ego network, trying to understand how users communicate and what is the most common activity they perform. We gave particular attention to the study of di↵erent kind of relationships between users, with particular respect to the sociological model of Dunbar circles. We show that this model seem also to hold for OSN environments. Next, we performed an analysis of the temporal data we could obtain: this study showed us some general patterns in users connections, influenced by the day/night cycle and by the presence of the weekend. Finally, we studied more in detail the typical user online session properties, such as their duration and frequency: we discovered, for example, that users typically connect many times per day, and each session is usually short (typically around 20 minutes).
We are convinced that the obtained social data could be used to address e↵ectively also other problems not related to DOSNs: with our dataset analysis regarding information di↵usion in OSN, design of recommendation system and more in general the study of the structure of complex social networks are possible.
Our work is structured as follows: in chapter 2 we will give a wide
panoramic on OSNs, modelling them as complex networks and discussing classical analysis performed. We will introduce important analytical concepts and metrics, and describe some important algorithms for the identification of clusters or communities. Next, we will shift our attention towards DOSNs, exploring in detail the related issues. In chapter 3 we will discuss in detail the problem of persistence and availability, we will show a possible approach based on exploiting the existing social overlay, emphasizing the importance of a valid dataset. Finally, we will describe in detail the desired properties we want to achieve in a fresh new set of social data. Chapter 4 will show SocialCircles! the application we developed. We will focus on its architechture, design, technologies used, remarking both application features and problems we had to solve. Finally we will discuss possible future evolutions and improvements. Next, chapter 5 gives a deep analysis and understanding of the acquired data, trying to emphasize some properties and discussing some evidences found. We often will compare with existing related works. Finally, chapter 6 will summarize our results and discuss about future working directions, introducing some of our ideas.
State Of The Art
2.1
Complex Networks and OSN
The study of networks, such as the OSN, is a research area which heavily relies on the Graph theory: a network can be modeled by a graph G = (V, E), where V is the set of vertices (nodes) and E the set of edges (arcs). According to the type of network modeled, vertices and edges may assume di↵erent meaning: for example in the case of OSN the vertex can represents people, whereas edges friendships among people. For these reasons, when talking about OSN we will always refer to nodes, vertices or users interchangeably.
Historically the study of network was aimed at discovering single nodes and edges properties in small networks, often by a visual inspection. In recent years the situation changed dramatically: networks complexity increased up to millions of nodes and edges, making visual inspection practically useless and making negligible the information regarding a single node or arc. Scientists completely changed the approach in network analysis, developing and formalizing new metrics and analytical measures which could describe a network from a global perspective and even its temporal evolution. When studying these networks, we refer to them as complex networks.
2.2
Complex Networks Properties
OSNs are a typical example of a complex network: millions of nodes are present, with billions of interconnections running among them. We will introduce in this section some of the principal concepts involved in complex networks analysis.
2.2.1
Small World
A very famous experiment performed in the 1960 by the american sociologist Stanley Milgram [10] aimed at investigating social networks properties. In this experiment around 200 people were randomly selected in the Nebraska and Kansas country and asked to deliver a letter to a stock market broker living in Boston, knowing only its name. People could forward the letter only to one of their direct known contacts with higher probability of knowing the recipient of the letter.
This experiment is also known as “six degrees separation” because the result showed that at most 6 hops (letter passing) where needed to reach the destinatary. The small world property represents the fact that even a big network exposes typically a very low network diameter, where the diameter is defined as the maximum distance between two nodes in the network. As a consequence, the average shortest path between two random vertices is very small, hence the name of small world e↵ect. Formally, if we consider an undirected graph (meaning that edges don’t have associated a direction), the average shortest path can be defined by the following formula:
` = 1 1
2n(n 1)
X
i>j
dij (2.1)
Where n is the number of nodes and dij is the minimum length between vertices
i and j. A network presents the small world e↵ect if ` grows logarithmically (or sub-logarithmically) by the network size.
The study of this property is of particular interest, because can be strictly related to the information di↵usion or searching speed in a network. It is known that social networks present small world properties [11]. As a particular example we cite a study that demonstrates how the Facebook diameter keeps shrinking: in 2008 Facebook exposed an average node separation of 5.28 hops, value which became 4.74 in 2011 [12].
2.2.2
Clustering
The clustering coefficient is used to estimate how a node v neighbours are
connected each other [13]. It’s very common trait of networks to expose
groups of nodes forming communities (clusters), meaning that these nodes are highly connected intra-community and weakly connected inter-community. The clustering coefficient assessses the quality of the communities partitioning.
Although many di↵erent definitions of clustering coefficient exists, we refer to the one by Watts and Strogatz in [14]. If we refer the clustering coefficient from a single vertex perspective, the clustering coefficient gives a local aggregation evaluation: it measures how many edges exists between v neighbours with respect
to the maximum theorical number of existant edges between them. Formally, if we
define N (v) as the set of v neighbours, nv =|N(v)| as its cardinality, the maximum
number of edges between v neighbours is given by: ✓ nv 2 ◆ = 1 2nv(nv 1) (2.2)
Given an undirected graph G = (V, E), v2 V and mv =|E(G(N(v)))| (number
of edges in subgraph constructed with the set of nodes N (v)), we can define the local clustering coefficient cc(v) of node v as:
cc(v) = ( mv (nv 2) = 2mv nv(nv 1) if (v) > 1
undef ined else (2.3)
where (v) is the degree (number of edges incident) to node v. Similarly, given a directed graph, the local clustering coefficient of node v is
cc(v) =
( mv
(2·(nv2))
= mv
nv(nv 1) if (v) > 1
undef ined else (2.4)
where (v) = in(v) + out(v). The global clustering coefficient of a network
CC(G) can be defined in term of the average of all local clustering coefficient, considering only nodes where the cc(v) is defined. Formally:
CC(G) = 1
|V⇤|
X
v2V⇤
cc(v) (2.5)
where V⇤ = {v 2 V | (v) > 1}. An alternative definition of the global
clustering coefficient is given by [13] and called network transitivity:
⌧ (G) = n (G)
n⇤(G)
(2.6) Which is the ratio between total distinct triangles of the graph n (G) and the
total number of triples n⇤(G). In the case of OSN, the global clustering coefficient
is also defined as network density:
⇢(G) = |E|n
2
(2.7) The global clustering coefficient is a value in the range [0, 1]: closer to 0 this value describes a low clusterized network, with many edges connecting far nodes, whereas a value close to 1 denotes a network with many edges between close nodes.
2.2.3
Degree distribution, scale-free network model and
network resilience
A very interesting measure is the vertex degree, the number of incident edges for a node. This information makes us understand the structure of the network: it can be composed by nodes of similar degree, creating a regular structure, or some nodes with higher degree than the average value may be present. In the latter case, these nodes are called hubs since they are key nodes in the network, being connection towards many others and thus being of strategic importance. The removal of the hub nodes from the network may severely ”damage” the structure, splitting the original graph in di↵erent separate components.
Many studies on nodes degree distribution of real networks have been performed. Remarkable the work of Barab´asi et. Albert [15] which showed that in many cases the distribution is a power-law distribution, meaning that there are few high degree nodes and many low degree nodes. This fact shows that links in a network are not distributed uniformly, making the classical random graph model proposed by Erd˝os et. R´enyi [16] not suitable to model social networks.
Network which present a power-law distribution of the degree of the nodes are known also scale-free networks: the distribution of nodes degree is independent from the network size. A confirmation of the social networks presenting the power-law distribution is found in [17] and [11].
Furthermore, it can be interesting to know how nodes connect each other: the phenomena is known as assortative mixing [13], and two important alternatives have been observed [18]:
• Nodes with high degree are connected to high degree nodes • Nodes with high degree are connected to low degree nodes
To measure this, the Pearson’s correlation index is often being used. This index aims to measure the linear correlation (dependence) between two variables x and y. With respect to a sample of size n, the Pearson’s correlation index r is defined as: r = Pn i=1(xi x)(y¯ i y)¯ pPn i=1(xi x)¯ 2 pPn i=1(yi y)¯ 2 (2.8)
where ¯x and ¯y represents the mean values of variables xi and yi. The r index
ranges from -1 to 1: a positive value (r > 0) means that to an increment of x variable an increment of y variable is observed. Conversely, for r < 0 an increment of x values correspond to a decrement of y variable. A value r close to 0 means that no significant linear dependences between x and y is observed. Adapted in
the context of network analysis, the Pearson’s index becomes a measure of degree correlation [19].
In particular, the degree correlation shows important properties [20]: an high positive correlation value represents network where high degree nodes are connected each other, making the structure robust and fault tolerant. By contrast, a negative correlation indicates network which are sensitive to structural faults and attacks, where high degree nodes are connected to low degree nodes.
This property therefore is used to measure the network resilience of a network: the resilience is the ability of a network to maintain a good service even after some nodes failure or removal [13]. To assess this property, some experiments have been performed, by choosing di↵erent removal policies:
• Random vertex removal • High degree vertex removal • Removal of a class of vertices
Some studies (see [21] [22]) demonstrated a strong resilience in the case of random vertex removal, resilience which became lower by choosing particular nodes.
2.2.4
Centrality
Centrality indexes represents another very important metric to describe a network. These measures aim to study the importance of a node in a network. Several indexes have been proposed, we now show the most common.
The Degree Centrality measures the connectivity of a node to the network in term of incident edges. It is defined as:
DC(v) = (v)
|V | 1 (2.9)
The Closeness Centrality [23] [24] measures the average distance of a node to each others: it’s a measure of the information propagation speed in the network from a node towards all other vertices. It’s defined by equation 2.10, where d(v, t) is the minimum path distance from node v to node t.
CC(v) = P
t2V d(v, t)
|V | 1 (2.10)
A third centrality measure is the Betweenness Centrality [25] [26]: it models the importance of a node in term of the information flow in a network. The BC
of node v measures the fraction of the shortest paths st(v) from node s to node
t that pass through v with respect to all the shortest path st between s and t.
Formally: BC(v) = X v6=s,t st(v) st (2.11) This measure is a global property of a node, and an high value suggests that lot of information between other vertices transit through this node.
Despite its importance, calculating this parameter can be computationally very expensive due to its nature of finding all the shortest path between each pair of nodes: the complexity is O(nm), where n is the number of nodes and m the number of edges of the graph.
However, a centrality measure called Ego Betweenness Centrality has recently been suggested, where empirical results showed a strong correlation with the Betweenness Centrality metric. The high advantage of computing this measure, is that only ego network information are needed. We present this measure later in detail in section 2.3.
2.3
Ego Networks
An interesting concept with respect of the OSN recently introduced is the so called Ego Networks (EN ) model [4], which represents a graph constituited by a user (the ego), his direct friends (the alters) and the social ties occurring between them. An example of a Ego Network for the red node is shown in figure 2.1.
Figure 2.1: Ego network of the red node.
where V is the set of vertices (nodes) and E the set of edges (ties), an Ego Network EN of a user u is defined as:
EN (u) = (Vu, Eu) (2.12a)
Vu ={u} [ {v 2 V | (u, v) 2 E} (2.12b)
Eu ={(a, b) 2 E | {a, b} ✓ Vu} (2.12c)
Intuitively, an Ego Network can be seen as a local view of the graph relative to the user (ego).
2.3.1
The Dunbar circles
Although the EN size can be large, many sociological and antropological studies showed that mantaining social relationships is costly in term of cognitive capabilities [27], more in particular it has been showed that an upper limit of relationships an ego can mantain is about 150, the so called Dunbar number [5] [28] [29].
Some studies aimed at analyzing o✏ine social network depicted these network as being composed by several concentric circles around ego [5]: these circles reflect di↵erent social ties strenght, and the strenght fades as the distance from the ego increase.
The tie strenght is the main feature of each relationship, it is defined as a numeric value quantifying the force of a social tie between two users: the original definition is by Granovetter in [30] where this value is a (linear) combination of the amount of time, the emotional intensity, the intimacy (mutual confiding), and the reciprocal services that characterize the tie. Figure 2.2 shows the Dunbar’s circles.
Figure 2.2: Dunbar’s circles.
A possible way to define these circles is obtained by considering the di↵erent frequency of contacts [5] between ego and alters. The closest circle is called support
clique (average size of ˜5 members), being the group of individuals whom ego will
ask help for financial disaster or emotive distress: the typical frequency of contact is estimated to be at least once weekly. The second circle is the sympathy group
(˜15 members), being the set of individuals contacted at least monthly. The next
outer circle is the less clearly defined affinity group (˜50 members), and finally
the outermost circle is the active network (˜150 members). Any other contact is
considered to be a simple acquaintance.
2.3.2
Ego Betweenness Centrality
Due to the nature of Ego Networks, calculating classic centrality measures such as the Betweenness Centrality or the Closeness Centrality has no meaning. The ego networks contains topological information regarding ego and its alters, and no information about whole network structure and connections.
For this reason a centrality measure called Ego Betweenness Centrality has been suggested by Everett and Borgatti in 2005 [4], where empirical results showed it’s correlation with the Betweenness Centrality metric. The strong advantage of computing this measure, is that only ego network information are needed, without a global view of the network. We present this measure as defined in [31]:
EBC(n) = X An(i,j)=0,j>i 1 A2 n(i, j) (2.13)
where n is the ego node, An its adjacency matrix. The EBC(n) is therefore
the sum of the reciprocal values A2
n(i, j) such that An(i, j) = 0. This is because we
do not consider geodesics (shortest paths) of length 1 among alters, we are only interested in paths of length 2 that pass through ego. The j > i condition in the sum is justified by the fact that in an undirected graph the adjacency matrix is
symmetric. The matrix A2 contains in position A2
i,j the number of walks of length
2 connecting i and j. In conclusion, ego centrality measure indicates how many shortest path pass through ego, out of all possibile shortest paths between alters. As an example to better illustrate this important concept, we present the ego network of node E in figure 2.3a.
In this network, alter B can communicate directly with rest of alters{A, C, D}
without going through ego E, same applies to node D. Conversely, if we consider nodes A and C, a direct path doesn’t exist among them: all routes in between are of length 2. These paths are highlighted as solid lines in figure 2.3b: one of the three possible path transit through ego node (A-E-C), whereas other two ways are possible (A-B-C, A-D-C).
The adjacency matrix contains the representation of this network, and is defined as:
(a) Ego network of node E
(b) Links considered in EBC computation Figure 2.3: EBC example.
AE = 0 B B B B @ E A B C D E 0 1 1 1 1 A 1 0 1 0 1 B 1 1 0 1 1 C 1 0 1 0 1 D 1 1 1 1 0 1 C C C C A (2.14)
and its square as:
A2E = 0 B B B B @ E A B C D E 4 2 3 2 3 A 2 3 2 3 2 B 3 2 4 2 3 C 2 3 2 3 2 D 3 2 3 2 4 1 C C C C A (2.15)
We can notice the symmetricity of the matrix, as a consequence of the graph
being undirected. As we can see, the value AE(A, C) = 0 indicates the missing
link between nodes A and C. The matrix A2
E contains in position A2E(A, C) = 3
the number of walks of length 2 connecting A and C. Since in the calculus we only
consider the pairs above diagonal which are zero in AE (meaning we only consider
path of length 2 between alters), the EBC for node E results EBC(E) = 13,
indicating that one (path A-E-C) out of three possible shortest paths pass through the ego.
2.4
Clustering Algorithms
The study of clustering is a very general analysis that can be applied to di↵erent research area: originally used for signal processing, they are nowadays very commonly used in the datamining field to divide instances of data into di↵erent groups according to some properties, giving particular focus to the quality of the obtained groups.
Clustering techniques can be divided in several categories: exclusive clustering algorithms are solutions where instances are assigned to one group only. Other approach are more flexible, allowing nodes to belong to multiple (eventually
overlapping or hierarchical ) partitions. We will describe later (section 2.4.1)
the most famous and general purpose clustering technique used: the K-Means algorithm.
With particular focus to the network analysis, more specific algorithms have been designed: by taking advantage of network topology, the idea is to investigate the presence of particular structurization of the graph, highlighting the presence of di↵erent communities of nodes. Other approaches try to exploit the di↵erent features of nodes to define semantic partitions, and recently more sophisticated solutions are trying to combine both approaches in concert to build better groups (often referred as circles in the social network perspective). We will analyze these algorithms in section 2.4.2.
2.4.1
K-means
The K-means algorithm is a very e↵ective yet simple solution widely used in many research areas. Originally intended for signal processing as a method of vector quantization, it’s today used as one of standard analysis in datamining field.
The K-means is an exclusive clustering technique: the idea is to assign the n instances to k groups. Each group is characterized by a representative prototype
(called centroid ), which is the mean of nodes currently assigned to it. The
algorithm assigns nodes to a partitions by choosing the group whose centroid is closest (most similar ) to the instance being classified. As a result, the whole data space is divided into Voronoi Cells.
The problem is known to be computationally difficult (NP-hard), but many efficient heuristics have been developed. The most famous is the Lloyd’s algorithm [32], an iterative procedure refining partitions at each step which is able to converge quickly to a solution (polynomial complexity).
The LLoyd algorithm works as follows: after an initialization procedure typically performed by randomly choosing k instances among the data space as centroids, there are two alternated phases, called assignment step and update step. In the assignment step instances are assigned to cluster whose centroid yields
the least within-cluster sum of squares (WCSS) (intuitively: the closest centroid, using a notion of euclidean distance). In the update step the new centroids are recalculated by considering all members of partitions. The algorithm converges to a (local) optimum when assignments no longer change.
The critical factor in the K-means algorithm is the correct choice of the parameter k which represents the number of groups. The main idea is to evaluate the quality of the partitioning by analizing the error obtained: a good cluster is a cluster where each instance is close to its centroid. To assess the partitions quality, two functions are commonly defined: the Sum of Squares Errors (SSE) and the
explained variance (V ARexp):
The SSE is defined as the within-cluster sum of squares error for k clusters, considering the square error of each cluster:
SSE(k) = k X j=1 SSj (2.16a) SSj = X i (xi µj)2 (2.16b)
where xi is an element of the partition j and µj is the centroid of jthcluster.
The V ARexp is defined by:
V ARexp(k) =
SSE(1) SSE(k)
SSE(1) (2.17)
where SSE(1) is sometimes indicated as SStot and is the SSE calculated when
all elements belong to one cluster only. The variance function ranges from 0 to 1, being equal to 0 when k = 1 and being 1 when SSE(k) = 0, a case that happens if each element of the space is assigned to its own cluster.
A common heuristic adopted to avoid too complex partitioning (overfitting problem) and find the optimal k value is the “elbow” procedure [33]: a new cluster
is added iteratively untill the V ARexp increment is below the 0.1 threshold. Once
stopped, the k found is the optimal value k-opt.
2.4.2
Communities detection algorithms
A particular tendency of social networks is the presence of di↵erent communities. These communities may reflect the di↵erent environment in which people met or the di↵erent features that aggregated them. A interesting research area specific to OSN is the development of social community detection algorithms, whos aim is to find efficient clustering strategies in networks.
To achieve this, di↵erent solutions have been adopted: the most common one is based on the topology of the graph (connections among people), other approach focus more on nodes attributes similarity rather their interconnection, whereas more recent ideas try to combine both.
The pure topological approach is the classical method which has been widely exploited for the community identification, therefore many di↵erent solutions exist. One classical approach aims at maximizing the so called modularity function by building exclusive clusters. This solution will be described later in this section.
In [34] authors propose the Clique Percolation Method (CPM), which is able to identify overlapped communities by following an approach based on cliques: we describe this approach later in this section.
Another very interesting and original work has been proposed recently in [35]: the authors focused on the creation of an efficient distributed algorithm. The main idea is that each node extracts its ego network and then removes itself from it: this resulting “EgoMinusEgo” network is then processed by the application of the Label Propagation algorithm (LP) [36], which makes communities emerge. The obtained communities are overlapping, a desiderable property which models the real world assumption that a person may belong to more than one community at same time. As a last step, a distributed democratic voting system is responsible of merging the di↵erent discovered communities by each node. This algorithm is able to identify with good results communities in quasi-linear time, allowing the analysis of giant networks of million of nodes and, according to author, perhaps billion.
Many other algorithms exists: for a very complete survey of the current state of the art, we cite [37] and [38] which present an exhaustive comparison and analysis of di↵erent solutions.
By changing approach, a class of algorithms is based on node similarity. In this group of algorithm the main idea is that similar nodes should belong to same communities. This kind of algorithms are referred as relational data clustering, where the concept of distance/similarity between two nodes is mainly based on attribute (e.g. the euclidean distance between two attribute vectors) [39].
Finally, more recent studies enrich the classical topological approach with the nodes attributes information. Work in this direction is defined in [40]. A very interesting and just proposed solution is suggested by Stanford researchers McAuley et. Leskovec [41]: we describe their solution at the end of this section. Modularity
The modularity function has been used to evaluate the quality of partitions obtained by di↵erent topological clustering methods. The modularity function Q is defined as:
Q = 1 2m X i,j Aij kikj 2m (ci, cj) (2.18)
where A is the weighted adjacency matrix of the graph, ki is the out degree
of node i, ci is the community to which vertex i is assigned, m = |E| and finally
the delta function (ci, cj) function is equal to 1 if node i and j belong to same
community, 0 otherwise.
The idea behind modularity function is simple: a set of nodes form a community if the fraction of links intra-community is higher than expected in a network
considered as “reference”. The term 2m1 Pi,j⇥Aij
⇤
(ci, cj) is the fraction of links
connecting nodes which are in the same community, while 2m1 Pi,j
kikj
2m (ci, cj)
is the expected fraction of links connecting nodes in the same community in a random graph having the same degree distribution of original graph.
The modularity value is always less than 1, and is equal to 0 only if all nodes belong to same community. High values of modularity indicate that the network presents a strong community structure. Finally, is important to emphasize that this definition allows a node to be part of just one community at a time.
Figure 2.4: Louvain Method for modularity optimization.
Modularity function can also be used as an objective function to maximize: the exact optimization is a complex problem known to be computationally hard, however some heuristics have been defined. A community discovery algorithm which is formulated as an optimization problem is defined in [42]. This work introduces a solution called Louvain Method which is able to find in short time a
partitioning of the network characterized by high modularity value. The algorithm is divided in two phases (shown in figure 2.4).
In the first stage each node of the network is assigned one community. Next, for each node i every neighbour j is considered and the gain of modularity, obtained by removing i from its community and placing it in j community is computed. Node i is put in the j community such that the increase in modularity is maximized. If no gain is possible, vertex i is left in its actual community. This first phase of algorithm is repeated untill modularity can be increased furthermore. In the second phase a new network is built by collapsing all nodes belonging to one community in a single node, and links between these new nodes are assigned a weight which is the sum of weights of the links between nodes in corresponding communities. This algorithm is iterated until a maximum of modularity is attained.
Clique Percolation Method (CPM)
The algorithm proposed by Palla et. al. in [34] is a non exclusive clustering method to identify overlapped communities of nodes in a graph. The authors community definition is based on the observation that a typical member in a community is linked to many other members, but not necessarily to all other nodes in the community. Authors intuition is to identify k-cliques in the graph and analyze their interconnections and whether they share nodes, in order to build communities.
The idea is first to identify all the k-cliques in the graph: a clique of order k is a complete (fully interconnected) subgraph of the original network composed by k vertices. Next, the authors define a notion of clique adjacency: two k-cliques are considered adjacent if they share k - 1 nodes, or in other words, if they di↵er only in a single node. With this notion of adjacency, authors declare a k-clique community as the union of k-cliques that can be reached from one to the other through a sequence of adjacent k-cliques.
Since the direct finding of all k-clique in a graph would be computationally too slow, authors implements the algorithm by using a di↵erent strategy: first they locate the large complete subgraph (of size s) in the network and then look
for the k-clique connected subsets of given k (the k-clique-communities, k s)
by studying the overlap between them. More in detail, the algorithm works as follows: after identifying the cliques (which are the maximal complete subgraphs), the clique-clique overlap matrix is prepared. In this symmetric matrix each row (and column) represents a clique and the matrix elements are equal to the number of common nodes between the corresponding two cliques, and the diagonal entries are equal to the size of the clique. (Note that the intersection of two cliques is always a complete subgraph.) The k-clique-communities for a given value of k are equivalent to such connected clique components in which the neighbouring cliques
Figure 2.5: Clique Percolation Method example. Given the graph in top left picture, with the di↵erent cliques marked by di↵erent colours, we aim to extract the k-clique communities for k = 4. Top right corner shows the built clique-clique overlap matrix. To obtain the k-clique communities for k = 4, o↵ diagonal elements smaller than 3 and diagonal elements smaller than 4 are removed. Not removed elements are substituted with 1 values. Finally, by processing this matrix, algorithm will find the k-clique communities depicted in the bottom right.
are linked to each other by at least k - 1 common nodes. These components can be found by erasing every o↵-diagonal entry smaller than k - 1 and every diagonal element smaller than k in the matrix, replacing the remaining elements by one, and then carrying out a component analysis of this matrix. The resulting separate components are equivalent to the di↵erent k-clique-communities. The great advantage of this strategy is that the clique-clique overlap matrix contains all information necessary to detect the communities for any value of k, allowing once computed, to find k-clique communities quickly. Figure 2.5 shows an example. An important issue is how to select k. The choice of k value is an important parameter: low value of k leads to big community containing the majority of nodes merging many small cliques, whereas high values builds very cohesive groups at the price of shrinking communities by excluding many nodes. Authors suggest to adjust parameter k in order to maximize the number of obtained communities, i.e find a community partitioning as highly structured as possible.
McAuley et. Leskovec Algorithm
The approach proposed in [41] aims to exploit both topological properties and node features in conjunction, modelling the circle prediction task as a “multi
membership node clustering problem” on a user’s ego-network. The idea is that community may arise by densely connected sets of alters, but also around some common properties or traits of users. A very interesting property of the Leskovec work is that di↵erent dimensions of user profile contribute to create di↵erent circles: as a consequence, in addition to assigning circle affiliations, the algorithm is also able to explain how circles formed and describe their features.
The algorithm proposed tries to maximize the log likelihood (the probability) of obtaining a given ego network graph by varying the circles which nodes belongs and treating them as latent variables. The intuition behind this algorithm is that edges of the graph are likely to form within circles and not outside circles.
More in detail, given a (directed, such as Twitter, or undirected, such as
Facebook) ego-network graph G = (V, E), and for each user v 2 V his profile
information, the mission is to predict a set of circles C = {C1...Ck}, Ci ✓ V and
associated parameter vectors ✓kthat encode how each circle has been created. The
ego node u is not contained inside G, remarking the fact that circles are built only around alters.
The information about users profiles are encoded in the pairwise feature vector (x, y), which highlights what features the nodes x and y have in common. The
parameter ✓k is a vector of weights: it tells us how each dimension of the feature
vector is meaningful for the corresponding Ck circle membership (see figure 2.6 for
an example).
Given an arbitrary (x, y) function, the general model for circle creation is the following. We treat circle memberships as latent variable.
The probability to have an edge e between a pair of nodes (x, y) 2 V ⇥ V is
defined as: p((x, y)2 E) / exp ( X Ck◆{x,y} h (x, y), ✓k)i | {z }
circles containing both nodes
X
Ck6◆{x,y}
↵kh (x, y), ✓k)i
| {z }
all other circles
)
(2.19)
The main idea is that the inner producth (x, y), ✓k)i is high if both x, y are member
of Ck, low otherwise. These values act both as rewards (for edges within circles)
and penalizations (for other circles): the summation will create the probability. ↵k
is a parameter which is a trade-o↵ for the influence of edges within Ck compared
to edges outside or crossing Ck. This probability formula captures the idea that
edges will probably form within circles and not outside circles. For each circle k,
✓k is the parameter that the model will learn.
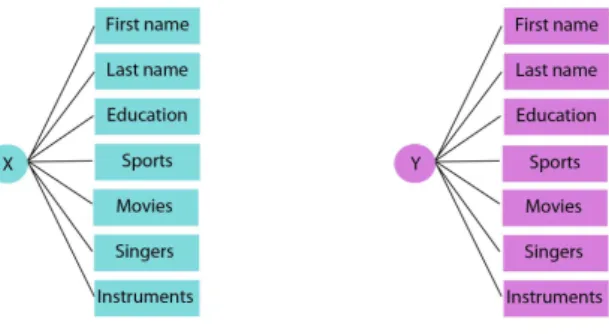
Figure 2.6: The figure shows two node profiles structure. Imagine that corresponding to circle Ckwe have the ✓k= [0 0 0 0 0 0.8 0.2]. This means that Ckweight is for 80% favourite singers, 20% for played instruments. The pairwise feature function is a vector which encodes what users x and y have in common: imagine we have
(x, y) = [0 0 0.1 0.25 0.7 0.4 0.3]. This means users x and y share the 40% of favourite singers and have 30% of played instruments in common.
The circle Ckcould be intuitively thought as music taste buddies.
of generating the whole graph G is therefore:
P⇥(G;C) = Y e2E p(e2 E) ⇥Y e62E p(e62 E) (2.20)
where ⇥ ={(✓k, ↵k)}k=1...K is the set of model parameters.
We introduce the shorthand notation
dk(e) = (e2 Ck) ↵k (e62 Ck)
(e) = X
Ck2C
k(e)h (e), ✓ki
And we can express the (2.19) as p((x, y)2 E) / exp { (e)}.
This probability expression we obtained needs to be normalized. We apply a logistic function obtaining the two expressions:
p(e2 E) = e
(e)
1 + e (e)
p(e62 E) = 1 p(e2 E) = 1
Finally, we can express the log-likelihood of G: l⇥(G;C) = X e2E (e) X e2V ⇥V log 1 + e (e) (2.21)
This function gives us the probability of obtaining G and C given the set
⇥ = {(✓k, ↵k)}k=1...K of parameters. The learning of these is an optimization
problem:
ˆ
⇥, ˆC = argmax
⇥,C l⇥(G;C) ⌦(✓) (2.22)
where ⌦(✓) is a regularization function used to lead to more interpretable results. To solve this problem authors suggest an approach called coordinate ascent on ⇥
andC. In this way they iterate alternatively the calculus of the circle membership,
with the calculus of the model parameters. They stop when reaching convergence:
two successive iteration of the setC of circle memberships are equals. To solve this
optimization problem two algorithms are used (QPBO and L-BFGS). The optimal choice of K is driven by the minimization of an approximation to the Bayesian Information Criterion (BIC).
2.5
DOSN
In parallel with the OSN di↵usion, many concerns regarding the privacy arised: everyday million of users are feeding these OSN with many personal information, many of them without caring a lot about this issue. These data are used massively to build targeted marketing campaigns, advertisements and personalization of user browsing experience: the data collected are a priceless treasure for many companies.
Moreover, not just private companies take advantage of this: the power of Big Data is currently exploited also by repressive governments, by controlling, monitoring and limiting people freedom. Recent events (such as the NSA scandal) confirmed the importance of the analysis of these data by governments: in the name of country security and protection, people privacy is being often violated.
Furthermore, the management of an OSN architechture is a complex task requiring lot of resources, needed to deal with the fast growing number of users (scalability) and the presence of a single point of failure.
For these reasons in the last years, scientists are studying new infrastructures to o↵er OSN services by exploiting the distributed (or even P2P) pattern: instead of a centralized entity which hosts the OSN and holds all the information on their servers and databases, the key idea is being able to develop these services by storing the data on distributed and distinct providers, sometimes the users themselves. We define these systems as Distributed OSNs, also referred as DOSN. In this perspective, we will refer nodes, vertices, users or peers interchangeably.
Current implementations take advantage of di↵erent paradigms, suggested by both academic world and the Open Source community. In particular, three approaches have historically been used to design DOSN:
• Decentralized servers (e.g: Diaspora [43])
• P2P architechture (e.g: PeerSoN [44], LifeSocial.KOM [45], Safebook [46], SuperNova [47])
• Hybrid solutions combining both (e.g: Confidant [48])
2.5.1
DOSN issues
The development of a DOSN has to face a large number of issues. In this section we will particularly focus on a particular class of DOSN, the P2P DOSN, which due to their nature result particularly suitable for our aims.
A P2P based DOSN is a system where there is no single provider, but a set of peers that cooperate each other to provide the service. This system has the main advantage of being theoretically much more robust and fault tolerant: no central entity is involved, distributing the load on all the participants.
To o↵er the service, these infrastructures have to deal with many problems. We illustrate a few of them briefly, focusing in detail on more recent studied problem, expecially the challenge of data availability and persistence in section 2.6.
Dynamism
Due to its nature, a P2P system presents a very dynamic structure, users can join and leave at any time, creating a topology which can change very quickly. A P2P DOSN must provide robustness against this infrastructural dynamism, known as churn.
Furthermore, another kind of dynamism we should take in consideration in DOSN, is the social dynamism: social relationships between users may vary at anytime. This phenomena is also present in OSN, but in DOSN may a↵ect the structure of the underlying overlay.
Scalability
Like any P2P system, the DOSN should be able to handle efficiently a large number of users, number which can grow in a short time. In particular it has been shown that in time the average node degree grows polynomially in the number of nodes: this implies a growth of the social graph size and a shrinking diameter [49].
Mapping a social graph onto a distributed network can be expensive due to complexity of the graph, which includes the presence of many inactive social links (users rarely interacting each other).
Propagation of updates
A desiderable property of the DOSN is that changes made by users to their profile should be propagated quickly in the system to o↵er a consistant view to the entire network, avoiding where possible out of date profile replications.
In OSN user can generate lot of information in short time, it is important that status update and newsfeed reach the alters of the ego as soon as possible. To achieve this, two main techniques are adopted.
The first one is the adoption of multicast messages: this method grants a fast information di↵usion (high recall), at a price of many communications involved, possible network congestion and spam to not interested contact (poor precision).
A more recent alternative is based on the gossip algorithms, which propagate updates at a bit slower pace but with much less traffic generated. Another feature of the gossip algorithms is the personalization of the audience interested in the updates.
An interesting work [50] proposes the utilization of two gossip algorithms in concert. The first one is a dissemination protocol (also called rumor mongering), which periodically does push operations to propagate the updates, the second one is an anti entropy with a push-pull strategy to ensure the information di↵usion towards nodes which are online for enough time.
Finally, a di↵erent approach is based on the use of social storages techniques: a node elects some of its contact as social caches. These nodes receive the updates from the producer node, and are responsible of delivering this content to consumer nodes even in case the producer node goes o✏ine. This approach reduces even more the traffic of messages in the network, although it opens new issues regarding the selection of these social caches.
Data persistence and availability
When decentralizing OSN, users data and profiles must be stored at some place to be always available. Several issues arise, such as where to store data (friends, random nodes, particular node which provide social cache mechanism). The level
of redundancy required when storing data is correlated to the distribution of online peers and their online session duration.
In particular, availability of user data should be guaranteed to other peers even when that user goes o✏ine. Many aspects should be taken in account when selecting nodes to store another user data: structural, social and temporal features of peers should all be taken in account. We will address this issue in detail in 2.6. Furthermore, an e↵ective P2P DOSN must be able to distribute the data among participant in a fair way.
Topology
The DOSN structure should expose an overlay which reflects social
interconnections among users: this could facilitate operations like data storage or information propagation. As a drawback, users with only a small set of friends may have problems in their data availability.
Other interesting aspects when building an overlay may include the location of users, taking advantage of geographical proximity, and the correlation between users interests.
Searching and addressing
User should be easily and quickly reachable and found by other users in any moment, and the search may be driven by common interests and groups.
Furthermore the system should handle peers changing dynamically their physical address, o↵ering properly identification and authentication mechanisms. Privacy and security
When storing personal information on the participating peers, system should provide efficient way to protect the privacy of data and handle the user privileges.
2.6
Data persistence
The most interesting challeng to face when developing DOSN is the availability of user data even when he goes o✏ine. The main techniques used to deal with that are the dynamic data replication [51] and distributed caching [52].
We will mostly focus on the second one. We will define the term Social
Update to refer to any social content generated by users, such as profile changing information, postings, photographs, status updates, commenting, etc.
2.6.1
Data replication
A classical approach is to memorize the data in the network using the distributed hash tables (DHT): this solution however showed its limitation for a few reasons. First, due to the high dynamicity of network topology (churn), the DHT storage may require many data replications on di↵erent nodes to provide availability.
Second, di↵erent user profiles may be requested with di↵erent frequency: this means DHT should be responsible in creating good load balancing.
Finally, the most serious issue lies in the nature of the data itself: in an OSN the content generated by the users are typically organized in logically connected structures or streams (for example a post message and its comments). The DHT is a structure which o↵ers high performance when retrieving information based on a key, but is not able to deal efficiently with relational data: a complete information retrieval would need therefore many accesses, taking up to hundreds of second [53]. For these reasons, many DOSNs which relied completely on DHT have been redesigned to use hybrid solutions. We have already presented two examples of DOSN based on DHT, PeerSon [44] and LifeSocial.KOM [45].
Other interesting work is [54], where authors build an external storage system by creating a distributed file system among a set of untrusted computers: they provide encryption and randomized replication storage, ensuring good scalability, performance and availability of information.
2.6.2
Social storage
More recent strategies aim to provide data persistency by exploiting the existing social connections, remarkable works in this direction are [9] [55] [56]: in these proposals authors suggest to store data on storage support o↵ered by friends.
In a typical OSN users can be both producers or consumers of social content. Status updates, photographs, post, comments, can reach nodes which are at most at 2 hop distance: this means that these information can hit friends or friends
of friends. The idea of the social caching is to choose some peers as social
storages [57]: a social storage is a peer designated to store and propagate another user information and to act as a bridge between users. A good advantage of social caching is the ability to reduce the overall number of messages traffic in the system. The nodes which are not elected as social storages behave as producers or consumers. They are assigned to one or more social storages (forming social clusters), pushing their updates to the social storages (producers) or requesting information about social storages friends (consumers). Since social storages are are designed to serve only nodes whom with they share friendship (for security reasons), all communication provided by them are 1-hop distance only.
For this reason, the selection of the social storage nodes in a network is a task which requires proper strategy.
Social storage selection
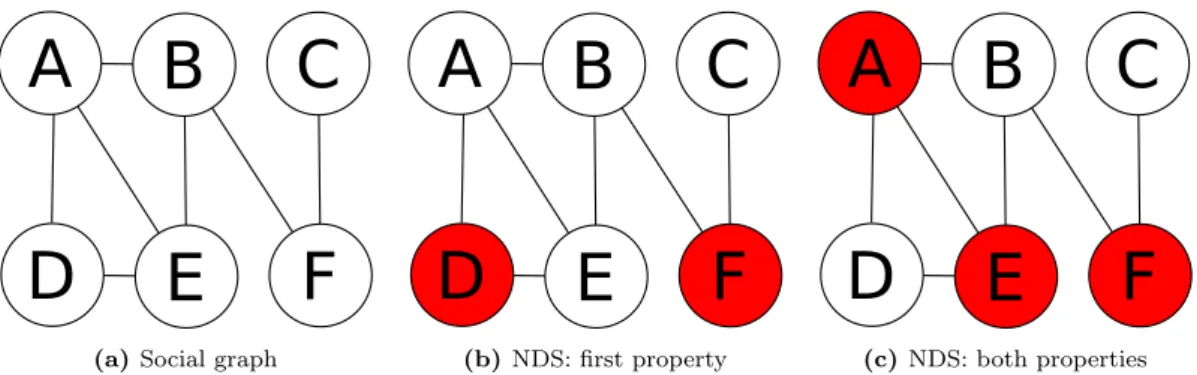
Social storage serve 1-hop distance nodes only: therefore the selection of designated social storages nodes is driven by the formation of a Neighbor-Dominating Set (NDS), such that two properties holds (figure 2.7):
1. Every node of the network is either a social storage or it is directly connected to one or more social storages.
2. Each pair of friend nodes share a social storage if none of them if a social storage itself.
(a) Social graph
(b) NDS: first property
(c) NDS: both properties Figure 2.7: NDS example: given the network in figure 2.7a, figure 2.7b shows a possible selection of social storages (red nodes) which respects the first property. However, the pair (A, B) (or (E, B)) doesn’t have a common social storage to publish or retrieve their social updates: the only solution is to elect one of them (or both as in this example) as social storages. Figure 2.7c shows a possible NDS covering the entire social graph.The respect of these hypothesis guarantees that the entire social network is covered by the social storages mechanism. To solve this problem di↵erent algorithms have been suggested.
In [57] authors present two solutions: the first one is an approximate NDS algorithm to calculate the set cover problem, where the selection of social storages is made with a greedy strategy.
The second approach is more sophisticated and more specifical to OSNs: it takes in account several structural and social properties of the node to calculate the Social Score index, which describes the importance of a node to become a social cache. This algorithm assigns this score according to the following measures: the local clustering coefficient (as defined in section 2.2.2), the vertex degree (section 2.2.4) and the ego betweenness centrality (section 2.3.2).
Although being very interesting, both solutions have the strong limitation of being centralized and require to know the full social graph structure.
More algorithms which overcome this limitation are defined in [58]: authors propose four distributed solutions for cache elections. The first is the randomized approach, used as a baseline to compare other strategies, where a node choose himself as a social cache with a certain probability. This algorithm is iterated untill NDS properties are satisfied.
The second and third approach are two-phase algorithm called Triad elimination and Span elimination: first, each node calculates the number of transitivity triads the node is part of or the set of edges that it covers, electing a social cache in its local neighborhood. Next, an elimination phase is performed to minimize the total number of caches and reach the optimal solution.
Finally, a distributed version of the above mentioned Social Score algorithm is defined: the implementation is in two stages, in the first each node calculates its score and becomes a social cache according to a threshold value. Next, each node which didn’t became a social cache itself calculates the set of covered edges and becomes a social caches if needed with a certain probability.
Collecting social data:
motivations
In this chapter we will describe in detail a set of issues related to the analysis of social networks which are still under investigation by the scientific community. With particular focus on the DOSN, we will see that to develop efficient solutions to assess these problems, rich datasets up to date are needed, while unfortunately the current available dataset are not useful nor rich enough.
We will discuss on the open challenges that need to be solved, depicting how the lack of data is a critical limit for these studies. Then, we present our idea and show the desired features which would characterize our fresh dataset with respect to current existant data.
3.1
Social data and open issues
The availability of data regarding OSN networks is of great support in the study of several problems. First, the study of real social graphs will help to better understand topologic properties of current large OSN and their evolution: we have seen in previous chapter that the structure of OSN is dynamic and keeps changing. Furthermore, datasets can be exploited to study in detail the dynamics occurring inside ego networks: in particular it is interesting to study how information spreads in these networks and the nature of the ties.
However, our objective is to investigate social data giving particular focus to the issues regarding DOSNs: as we have seen, creating a DOSN is a complex task which has to face many problems. We will assess the data persistency and availability problems, two of the most serious challenges which needs to be considered. More in detail we will focus on two aspects: