1
A data driven model for spatio-temporal estimation of
shallow water table depth in soils
Fabrizio Ungaro, Costanza Calzolari
CNR IRPI Firenze, Via Madonna del Piano 10, 50019 Sesto F.no (FI), [email protected]
Abstract:
Data from a monitoring network were used to develop a data driven model for predicting water table depth in space and time. Records of 160 piezometer sites available from 1997 to 2010 were analyzed to detect the overall temporal trend in water table depth in a relevant agricultural area in Northern Italy. Evolutionary Polynomial Regressions (EPR) were used to calibrate a predictive tool based on climatic data and the records from 47 selected sites between 2004 and 2009 (N = 5611). The model was validated against the WT depths observed in 15 independent sites between 2005 and 2010 (N= 2052). Validation resulted in a mean absolute error of 30.0 cm (R2 = 0.65). The general model was extended to the whole area, using the geostatistical estimates of the average water table depth as input, providing spatio-temporal maps of the water table depth at any give date.
Keywords: Soil water table; Evolutionary Polynomial Regressions; Spatio-temporal
maps
1. Introduction
In alluvial plain areas of Northern Italy, the presence of seasonally saturated horizons due to the presence of a shallow (0.5- 3 m) groundwater within the rooting depth of crops, during the growing period, allows optimizing the irrigation water supply, thus saving the resource, concentrating the irrigations only where and when really needed. To this aim, operational tools are needed to estimate the depth of the shallow water table with a good reliability in space and time. Predictions about shallow water table dynamics can be made adopting different approaches (Morgan and Stolt, 2004). These can be either based on i) climatic records, ii) on field evidences from soil morphology and properties, iii) on the outputs of physically based water balance models or iv) on combinations of the different approaches. Water balance models require a high load of input data, which are not always available, and, especially in the case of spatially distributed models, the reliability for applicative goals is not always assured, being this often related to site specific soil conditions (Salazar et al, 2008). Empirical modelling can represent a suitable alternative, providing good results when locally calibrated. The choice among the available approaches is often determined by the density and frequency of observations over the space and time domains. Aim of this work is to obtain reliable estimates of water table (WT) depth both in space and time to be used for crop irrigation water requirement assessment, using a limited amount of climatic and hydrological information. An empirical time series model is presented, based on
2
meteorological data and water table depth records irregularly spaced in time and space. The model, calibrated in alluvial plains of Emilia Romagna (Italy), is based on a limited number of piezometer wells and climatic data and is supported by existing soil maps and geostatistics.
2. Materials and Methods
The study area is located in Northern Italy, in the alluvial plains of Emilia Romagna (lat. 43°50’N-45°00’N; long. 9°20’E -12°40’E Greenwich approx). The area is about 12,000 km2, with elevations between -3 and 150 m a.m.s.l. Climate is temperate-sub oceanic, with a mean air temperature of 12.4°C (max. and min. 19.3 and 8.2 °C respectively), and a mean annual precipitation ranging from 520 to 820 mm. Rainfall and potential evapotranspiration data, for the period 2004-2010, come form a network of about 300 pluviometric stations. The spatialisation of these data is obtained by ordinary kriging with a grid of 5x5 km. In the study area a net of 160 piezometer wells is present. Though the sites are monitored since 1997, the network has been set up in different monitoring projects carried on at provincial level. The temporal series are therefore highly heterogeneous, in terms of temporal continuity, frequency of observations, and spatial distribution. On average 1.7 readings per month are available at the sites. The predictive model was developed using Evolutionary Polynomial Regression (EPR, Giustolisi and Savic, 2006). EPR are regression-based algorithms, which use a hybrid between polynomial structures and evolutionary computing to model environmental processes and/or systems. The analysis was carried out using the EPR-Toolbox v.2.1.SA (Laucelli et al, 2010), using the normal SSE function as objective function. In order to calibrate the model, 47 sites were selected for a total of 5611 water table readings between 2004 and 2009. At each site, in correspondence with the readings, cumulate rainfall and potential evapotranspiration have been calculated at 30, 60, 180 and 365 days preceding the reading. From these values, evapotranspiration deficit has been calculated for the same time intervals. Furthermore, the average water table depth between 2004 and 2009 was calculated at each site (N = 118) and added to the list of predictive variables to be selected by the EPR model. The predictive model has been validated on a subset of independent data (N = 2052 ) from 15 sites not used for model calibration, with readings between 2005 and 2010.
3. Results
The descriptive statistics of the calibration data set (N = 5611) are reported in Table 1. The optimal expression provided by EPR to estimate the water table depth at any given day i has the following form:
WTdepth_i = -0.0016163* D180 *WTavg+0.00000064746*Pcum30*Pcum600.5*WTavg+
-0.000074113*ETP3650.5*Pcum300.5*Pcum60*WTavg0.5+0.00099791* ETP365* WTavg+
+0.0000000045408* ETP365* WTavg2*D180 -19.564
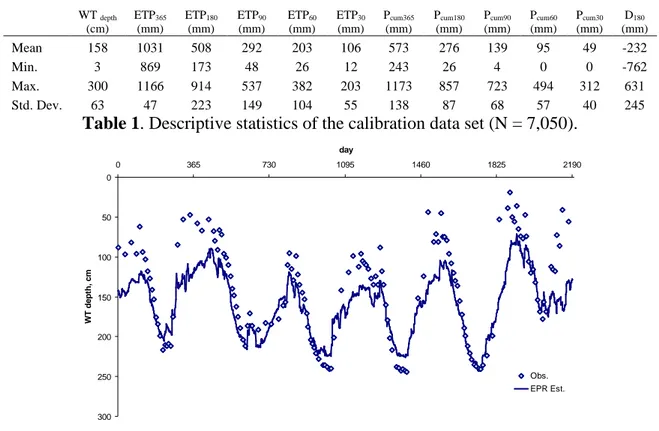
The EPR model was tested on an independent data set (N = 2052); calibration and validation results are shown in Table 2. Figure 1 shows the time series of observed vs. predicted values for one of the validation site.
3 WT depth (cm) ETP365 (mm) ETP180 (mm) ETP90 (mm) ETP60 (mm) ETP30 (mm) Pcum365 (mm) Pcum180 (mm) Pcum90 (mm) Pcum60 (mm) Pcum30 (mm) D180 (mm) Mean 158 1031 508 292 203 106 573 276 139 95 49 -232 Min. 3 869 173 48 26 12 243 26 4 0 0 -762 Max. 300 1166 914 537 382 203 1173 857 723 494 312 631 Std. Dev. 63 47 223 149 104 55 138 87 68 57 40 245
Table 1. Descriptive statistics of the calibration data set (N = 7,050).
0 50 100 150 200 250 300 0 365 730 1095 1460 1825 2190 day W T d e p th , c m Obs. EPR Est.
Figure 1: Estimated vs. observed water table depth at a validation site.
Calibration data set (N= 5,611) Validation data set (N=2,050)
R2 0.71 0.65
RMSE, cm 34.14 37.68
MAE, cm 26.27 30.04
E', - 0.51 0.43
AIoA/d', - 0.73 0.69
Table 2. Model performance. MAE, mean absolute error; RMSE, root mean squared
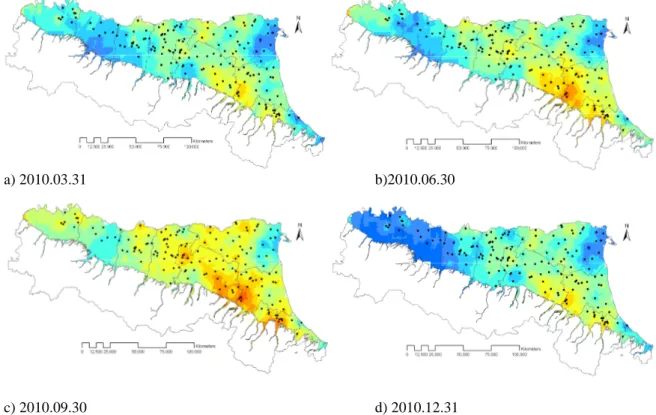
error; E’, modified coefficient of model efficiency; IoA’, modified index of agreement. In terms of input data requirements, the EPR model relies on climatic data at any given site in the study area and on the long term average of WT depth. . In order to provide spatio-temporal map of soil water table depth at any given day i, the average WT depth has been estimated for the whole area via ordinary kriging over a 1x1 km grid using the available sites between 2004 and 2009 (N=118). The parameter of the model fitted to the experimental omnidirectional variogram are shown in table 3. Concerning the capability of the model in extrapolating in the spatial and temporal domains, Figure 2 shows the water table depths at four different dates in 2010, whose data were not used for model calibration. Water table levels show distinct geographic patterns across the plain, which are more evident in the dryer periods. For example, the recently reclaimed lowlands in the north-eastern part of the plain, where the water table level is hydraulically controlled, are characterized by shallower WT (110-150 cm) while the opposite is observed in the south-eastern portion of the study area, which is characterized by a deeper water table (>175 cm). Results are coherent with rainfall spatial distribution, whose relevance in affecting WT depth is variable in time and space.
4
c0 c1 c2 a1 (m) a2 (m) IGF
0.38 0.35 0.31 14,400 44,000 1.68e-03
Table 3. Variogram model parameters: c0, nugget variance; c1, c2, sill components, and
a1 and a2 the correspondent ranges. IGF: Indicative Goodness of Fit (Pannatier, 1996).
a) 2010.03.31 b)2010.06.30
c) 2010.09.30 d) 2010.12.31
Figure 2: Estimated WT depth at four dates in 2010.
4. Concluding remarks
The seasonal occurrence of shallow groundwater as water source for agricultural crops is crucial for a sustainable use of water resources. The empirical regionalised model presented in this paper, based on daily climatic records and on spatial estimates of average water table depth provides a tool to predict and map water table depth. The model allows for projecting ahead WT depth for the whole area regardless the availability of new WT readings, using daily climatic records and taking explicitly into account the spatial variability of WT and the spatial and seasonal variability of rainfall.
References
Giustolisi O. & Savic D.A. (2006) A Symbolic Data-Driven Technique Based on Evolutionary Polynomial Regression, J. of Hydroinformatics, 8(3), 227-222 .
Laucelli, D., Berardi, L., Doglioni, A. 2010. EPR- Toolbox v. 2.1.SA. Technical University of Bari, Dpt. Of Civil and Environmental Engineering
Morgan, C.P., Stolt, M.H., 2004. A comparison of several approaches to monitor water-table fluctuation. Soil Sci. Soc. Am. J., 68, 562 – 566.
Pannatier, Y., 1996. Variowin: Software for Spatial Analysis in 2D, Springer, New York 91 pp.