UNIVERSITÀ DEGLI STUDI DI ROMA
"TOR VERGATA"
FACOLTA' DI SCIENZE MATEMATICHE FISICHE NATURALI
DOTTORATO DI RICERCA IN
SCIENZE CHIMICHE
XIX
CICLO DEL CORSO DI DOTTORATO
Titolo della tesi
ASSESSMENT OF TRACE METAL BIOAVAILABILITY IN
SOILS AND RIVER WATERS USING DIFFERENT
ANALYTICAL TECHNIQUES TO PREDICT METALS UPTAKE
BY BIOTA
Dottoranda: Dott.ssa Chiara Galas
Supervisore
interno:
Prof. Giuseppe Palleschi
Supervisore
esterno:
Dott.ssa Maria Belli - Agenzia per la Protezione
dell'Ambiente e per i Servizi Tecnici (APAT)
Index
PREFACE 1
INTRODUCTION 2
SUMMARY 6
PART 1. METAL BIOAVAILABILITY IN SOILS
SECTION 1. Samples matrices under study 8
SECTION 2. The role of different soil sample digestion methods on trace metal analysis: a comparison of ICP-MS and INAA results
11
Abstract 11 Introduction 11
Material and methods 14
Results and discussion 20
Conclusion 28
SECTION 3. Total trace metal concentrations 30
Appendix 1 31
SECTION 4. Single extraction procedures 32
Introduction 32
Material and methods 32
Results and discussion 34
SECTION 5. Leaching tests
37Introduction 37 1. pH-dependence leaching test 39
Material and methods 39
Results and discussion 40
Conclusive remarks 42
Material and methods 43
Results and discussion 43
Appendix 2 46
Appendix 3 55
SECTION 6. Diffusive Gradients in Thin Films Technique – DGT 58 1. DGT application in waters 58 2. DGT application in soils 66
Experimental section 70
2.1. DGT measurement of metals resupply from soils 70 Material and methods 70 Results and discussion 73 Conclusive remarks 75 2.2. DGT as a predictor of metals plant uptake 77 Material and methods 77 Results and discussion 82
Conclusion 94 Appendix 4 95 Appendix 5 96 Appendix 6 98 Appendix 7 99 Appendix 8 100 Appendix 9 101
PART 2. METAL BIOAVAILABILITY IN RIVER WATERS
SECTION 7. Metals Bioavalibility in river waters and metals bioaccumulation in fish
102
1. DGT labile metals and 0.45 - 0.2 m filterable fraction of metals: a comparison in a river compartment
Material and methods 104
Results and discussion 106
Conclusions 119
2. Metals bioaccumulation in fish 120
Material and methods 120
Results and discussion 121
Conclusions 123
SECTION 8. Method validation for metals determination in fish and uncertainty budget
124 Summary 124
Material and Methods 124
ICP-MS Validation studies 127
ICP-MS Uncertainty budget 131
Determination of the magnitude of uncertainty components 134 CONCLUSIONS
146
REFERENCES
148
PREFACE
The experimental activity described in the present work has been conducted at the laboratories of the Italian Environmental Protection Agency (APAT). Some experiments relevant to soils and plants were performed in collaboration with CNR (Pisa) and were carried out at the CNR department of Soil Chemistry by CNR and APAT personnel.
Leaching tests were conducted in parallel at APAT and at the expert laboratory of the Energy research Centre of the Netherlands (ECN). Instrumental Neutron Activation Analyses on soils were performed at the Jožef Stefan Institute, Ljubljana, Slovenia.
In situ water sampling was performed in the Sitzerri river in Sardinia in cooperation
with the Regional Environmental Protection Agency (ARPA). Some experiments concerning metals bioaccumulation in fish were performed at the laboratory of ARPA.
Introduction
The bioavailability and mobility of potentially toxic trace metals largely determine the environmental impact of metal-contaminated soils and aquatic systems [1]. Increasingly, it is being realized that the total metals content in soils and waters is a poor predictor of availability of metals to biological living organisms [2]. At present, although existing legislation or guidelines on heavy metals are primarily based on total concentrations, the scientific community well recognised that the total metal content in soils and waters embraces large fractions which are unavailable to plants, (micro)organisms, soil fauna and aquatic biota [3]. Metals speciation influences the fraction of metal that is really available for biota uptake and hence its toxicity in the environment. Many factors determine the chemical forms, or species, in which metals may be present is soils and waters. These include soil/water pH, the redox potential, organic matter, the temperature as well as the concentration of the metals and of potentially interacting agents such as organic chelators and inorganic anions [4].
The aim of the present work is the assessment of metal bioavailability in both soils and river waters through the comparison of the most widespread techniques used to predict metal biota uptake.
Firstly, the present study focused on the assessment of metal bioavailability in soils (some applications were performed also on a compost sample). The first objective was to attain an harmonized approach for the assessment of metal speciation and bioavailability in soils using traditional procedures as leaching and extraction tests and a recently developed technique known as Diffusive Gradients in Thin films (DGT), capable of in situ measurement of labile metal species in natural waters, sediments and in soils [5].
The leaching or extraction procedures enable to measure the environmentally-relevant sub-fractions of contaminants [6]. This approach differs from the purest form of metal speciation which consists on the isolation and measurement of specific metal compounds. The complexity of soil matrix currently precludes routine isolation of many of the forms of metals associated with the soil. The leaching and extraction
procedures focus on the mobile metals fractions, allowing for an interpretation of data in the light of key environmental parameters controlling metal mobility.
Leaching is the process by which contaminants are released from the solid phase into the waterphase under the influence of mineral dissolution, desorption, complexation processes as affected by pH, (micro)biological activity and organic matter [6]. Leaching can occur in the field by exposure of material to natural infiltration or precipitation (for example a natural soil exposed to rainwater infiltration). Leaching tests have been developed to mime these natural processes and to assess the fraction of contaminants potentially mobile and available for biota uptake.
The development and use of extraction schemes started at the end of 1970s [7] and aimed to evaluate the metal fractions available to plants and the environmentally accessible trace metals, e.g. the mobility of metals from a soil. These measurements, if supported by geochemical modelling with the measured parameters as input, allow to estimate metals speciation in soils and for a proper and long-term risk-assessment of the contaminated environments.
In the past 15 years, many scientific researches demonstrated that DGT represents a promising tool for inferring metals availability to biota. DGT has been developed by Davison and Zhang in 1994 and it is based on Fick’s first law of diffusion [5, 8, 9]. DGT plastic sampler could be applied directly in situ. It uses a chelating resin separated from natural water (or soil surface) by an ion-permeable hydrogel membrane. Metals are concentrated onto the resin after diffusing through the gel layer, so that metal uptake by DGT is controlled by diffusion. The pore size of the diffusive gel of DGT permits free metal ions and inorganic and small organic metal complexes to diffuse through to the resin, which acts as a sink. The gel excludes particles and large colloids which will not be measured. DGT distinguishes between species not only by size (whether they can pass through the diffusive gel layer) but also kinetically (according to their lability). Therefore, only labile complexes that can dissociate on time scale less than minutes are measured. The ability of DGT to infer metals bioavailability depends on the evidence that the most bioavailable metal fraction is represented by labile metal species.
In 1994 DGT was firstly developed to be used in natural waters and then its use was extended to soils and sediments [10, 11]. When applied on soils, DGT is capable to evaluate the flux of available species from solid phase to solution [12]. This aspect is very interesting since mimics processes that truly occur in nature for biota metals uptake. Actually, if metals is removed from solution by biological uptake it may be rapidly resupplied from the solid phase. Thus, the assessment of the availability of metals in soils need also to consider the kinetics of exchange between solution and solid phase [13]. Traditionally, the assessment of the potential supply from the solid phase has been made by extraction techniques that attempt to quantify the size of available solid-phase pool. DGT provides a different cheering approach to quantify metal resupply from the solid phase.
As a consequence of the above considerations, selected leaching and extraction tests and DGT were applied to a range of metal contaminated Italian soils and their limits and field applicability were discussed. Leaching and extraction tests were conducted in collaboration with the Energy Research Centre of the Netherlands (ECN).
As a further step of this study, DGT capabilities of measuring flux of available metals from solid phase to solution has been investigated through a direct comparison with the uptake of different plant species.
DGT gave several encouraging results in the prediction of metal availability to plants in soils [3]. DGT measured concentration was described as the best indicator of metal phytoavailability by authors considering large ranges of soil contamination and different soil types [1, 13, 14, 15].
It is recognized that the supply of metals to plants is through the soil solution [13, 16, 17, 18]. When metal is supplied from the solid phase, it must be transferred to solution before it can be taken up by plant roots. It is well recognized that depletion of metal concentration in solution in the immediate vicinity of the roots of plants can allow a transfer from solid phase to solution. Like plants, DGT locally lowers metal concentrations in the soil solution through the metal accumulation in the resin. It also responds to metal resupplied from labile species in solution and the labile metal pool in the solid phase. DGT then measures the metals available from the complete soil system. The measured supply to DGT is controlled by a combination of the
concentration in soil solution, the size of the available labile pool in the solid phase and the kinetics of exchange between the two [13, 19].
Extraction of soil solution from soil isolates the aqueous phase to which plant roots and microorganisms are exposed but the measurements of metals in soil solution fail to account for the ability of the soil to sustain the solution concentration following a depletion by uptake [14].
Considering these encouraging presupposes, APAT and CNR (Pisa) activated a collaborative study to assess DGT, metal chemical extractions and soil solution capabilities in predicting metal uptake by plants.
In particular, trace metal concentrations measured in soils, soil solutions, and by chemical extraction and DGT were compared to the metals taken up by plants of lupine and wheat.
The second part of the present study focused on metal bioavailability in river waters. A collaboration with the Regional Environmental Protection Agency (ARPA) of Sardinia was instituted to study DGT applicability in a contaminated river in Sardinia. The main aim was to compare the bioavailable fraction of metal measured by DGT and by on site filtration [20, 21, 22]. In this way it was possible to investigate metal complexation and speciation focusing on the fraction of metal potentially available to aquatic organisms.
Metals bioaccumulation in fish was recognized to be an interesting topic of investigation in correlation with metals bioavailability in waters. A specific experiment was designed to study metals bioaccumulation in Cyprinus Carpio fish and a method to accurately determine metals accumulated in fish tissues was standardized.
Summary
PART 1: Metal Bioavailability in soils SECTION 1
This section briefly describes the soils matrices (and a compost) under study in the present work. This section also reports some information concerning the sampling activity and samples pre-treatment.
SECTION 2
This section reports a comparison of different techniques for the determination of the total metal content in soil samples. Although the total metal content of soil is a poor predictor of metals bioavailability, the determination of the total metal concentrations still remains the first step in evaluating soils potential health or ecologicalhazard. In this section, the results for total trace metals content determined by Inductively Coupled Plasma Mass Spectrometry (ICP-MS) after acid digestion and those obtained by the non destructive Instrumental Neutron Activation Analysis (INAA) are discussed. The outcomes of this study were published in the Accreditation and Quality Assurance Journal and provided useful information to select the most appropriate digestion method to dissolve the samples under investigation (section 1) prior to ICP-MS analysis.
SECTION 3
This section reports the results obtained for the total metals content in the soils under study. The samples were digested and analysed using the information outcome from section 2.
SECTION 4-5
These sections describe the extraction and leaching procedures selected among the different leaching/extraction tests used across Europe for regulatory and research purpose, to be applied on the samples under investigation (section 1).
SECTION 6
This section describes the DGT theory of application and its application to evaluate metals resupply from the soils under study. Furthermore, the DGT capability in
predicting metal uptake by plants is compared with those of metal chemical extractions and soil solution.
PART 2: Metal Bioavailability in river waters SECTION 7
The DGT results obtained in a contaminated river in Sardinia are reported and discussed in comparison to on site filtration. Metals uptake by Cyprinus Carpio in river waters is discussed.
SECTION 8
The validation of a method to accurately determine metals accumulated in fish tissues is also reported.
SECTION 1. Samples matrices under study
Metal speciation and bioavailability were investigated in 6 soils samples and in one compost sample.
Two agricultural soils were collected near the area of ACNA (Azienda Coloranti Nazionali e Affini), a chemical plant belonging to ENICHEM (Figure 1) located in the Cengio area, in the valley of the Bormida River (Savona, Italy). Since 1882, this plant discharged in the adjacent river its yellow, acid and smelly mud, providing the pollution and poisoning of the neighbouring waters and countries. In 1987, the Bormida valley was defined as an “highly risky area of environmental concern” and in 1999 the ACNA plant was finally closed. Afterwards, a land reclamation campaign was started on behalf of the Regional Environmental Protection Agency of Piemonte (ARPA- Piemonte). In the present study, one soil sample was collected in the agricultural area of Saliceto, in the Cuneo province, nearby to the ACNA discharge, and the second one was collected in the Millesimo area, in the same province but at higher distance from the ACNA plant. In the following sections, the samples codes of these soils will be Saliceto and Millesimo.
Figure 1. ACNA plant (Cengio).
One soil sample was collected in an agricultural area belonging to ERSA (Ente Regionale di Sviluppo Agricolo) in the centre of Italy (Abruzzo). In the following sections, the sample code of this soil will be ERSA.
The other two soil samples were collected from a contaminated area near Nuova Solmine S.p.A, a plant for arsenopyrite crushing and processing, located in
the zone of Scarlino, in the Grosseto province (centre of Italy). These soils originated from the residual mud of arsenopyrite manufacturing and from added soils carried from bordering zones (Figure 2). In the following sections, the sample codes for these two soils will be Scarlino 1 and Scarlino 2.
One soil samples was collected by CNR (Pisa) in Bovisa (Lombardia) and was used, together with Saliceto soil, to perform experiments using plants (SECTION 6). Sample code: Bovisa.
The compost sample (Figure 3) was collected in a plant for waste selection and composting of the centre of Italy. It derived from horticultural wastes collected from gardens and parks (bushes, leaves of trees, wood chippings, grass). It is a stabilized compost of high quality (sample code: Compost).
Figure 2. Pyrite fine ash (Scarlino).
Compost has traditionally been produced from plant materials and is not considered as waste but as an organic soil improver. Usually composts are used on agricultural land and it is important to evaluate the quality of the final product to protect the quality of the crops and of the environment.
Today, composts are also produced from other organic sources, including wastes from the food and agricultural industry, sewage sludge or household refuse [23]. Considerable remediation of contaminated soils can be accomplished by composting them with non-contaminated organic matter [23]. Trace metals are not degraded during composting but may be converted into organic species having less bioavailability than minerals combination of the metals. This substantial potentiality
for remediation of polluted soils makes compost as a matrix of great environmental concern [23].
Figure 3. Compost.
Sampling and samples pre-treatment
Soils samples were sampled by shovel after eradicating any surface vegetation. The soils were taken up to 20 cm depth. After sampling, the soils were weighed and stored in carton-board boxes and then dried into an oven fan at 36-40 °C until a constant weight was reached. Then they were dis-aggregated by using wood pestle and sieved at 2 mm. Compost was delivered in big tanks from the plant for waste selection and composting of the centre of Italy. It was also dried at 36-40 °C, until a constant weight was reached but sieved at 1 mm. Actually, the compost sample is a very complex matrix due to the presence of a lot of small wood residues. For this reason it was sieved at 1 mm, trying to remove the large part of them.
SECTION 2. The role of different soil sample digestion methods on
trace metal analysis: a comparison of ICP-MS and INAA results
Abstract
The determination of trace elements in soil, sediment and waste, is generally a combination of a digestion procedure for dissolution of elements and a subsequent determination of the dissolved elements. “Partial” and “total” digestion methods can be used in environmental monitoring activities. To compare data coming from different methods, it is crucial to determine and to maintain under control the bias of the methods.
In this paper ICP-MS results obtained after matrix microwave digestion with modified aqua regia (HCl + HNO3 + H2O2) method and two “total” digestion
methods (aqua regia + HF and HNO3 + HF) are compared with those obtained by
Instrumental Neutron Activation Analysis, a non-destructive analytical method for the determination of the total content of inorganic components in environmental matrices.
The comparison was carried out on eight agricultural soil samples collected in one test area and analysed by INAA and ICP-MS to determine As, Co, Cr, Sb and Zn contents. The laboratory bias for As, Cd, Co, Cr, Cu, Ni, Pb, Sb and Zn of the three digestion methods were assessed using selected reference materials. This paper highlights that the digestion procedure is an integral part of the measurement and can affect the measurement results in environmental analysis.
Introduction
Determination of trace element contentsin soilsis the first step in evaluating their potential health or ecological hazard. Sample digestion is often a necessary step before determining “total” metal mass fractions in soils.
A standard, relatively safe, dissolution method that provides an analytical recovery of at least approximately 90% of soil bound metals is required in most laboratories working with trace metal in soil.
Various digestion methods are used to determine the content of trace elements in solid matrices, including different combinations of concentrated acids [24, 25, 26]. Open beakers heated on hot plates, digestion tubes in a block digester and digestion bombs placed in microwave ovens are the most commonly used equipments to digest solid sample matrices.
In particular, since the 1980s, the microwave-assisted sample digestion technique has become popular and at present it is widely used due to its safe, rapid and efficient performance [27, 28, 29].
Since different acid digestion methods applied to soil samples can release different amount of metals from this matrix, it is critical to compare different digestion methods used to determine elemental mass fractions in soils.
As reported by Chen and Lena [27], the amount of trace metals extracted by the commonly used digestion methods might depend on the element, their origin (anthropogenic or natural), soil properties and element mass fractions.
Aqua regia digestion method (USEPA 3050 [30] or ISO standard 11466 [31]) is considered effective for determining “total” trace elements in soils and is usually used to give an estimate of the maximum element availability to plants [27, 32]. This method consists of treating a soil sample with a 3:1 mixture of hydrochloric (HCl) and nitric (HNO3) acids. The nitric acid destroys organic matter and oxidizes the
sulphide material. In addition, it reacts with concentrated hydrochloric acid to generate aqua regia: 3HCl + HNO3→ 2 H2O + NOCl + Cl2. Aqua regia is considered
adequate for dissolving most base metal sulphates, sulphides, oxides and carbonates but only provides a “partial” extraction for most rock forming elements and elements of a refractory nature. For example, aqua regia extraction might give complete recovery for metals such as Cd, Cu, Pb and Zn while it is known to provide partial recovery for metals like Cr, Ni and Ba. The latter elements can only be efficiently recovered by using hydrofluoric acid (HF). However, aqua regia digestion method is internationally accepted to determine the metal content in soil, considering as not available for biological uptake the fraction of elements not extracted by this method. The ISO standard on aqua regia digestion of soil includes only digestion by the use of hot plate heating, while the modified aqua regia digestion method, suggested by the Italian legislation, includes both hot-plate heating and microwave-oven heating
[33]. The aqua regia modified method adds, in the first step, hydrogen peroxide (H2O2)in order to enhance the destruction of the organic matter in the soil.
More vigorous HNO3 + HCl + HF digestion methods (like EN 13656 applied to
wastes [34]) provide satisfactory dissolution of silica matrices [35, 36, 37, 38]. These methods use microwave-assisted acid digestion for “total” sample decomposition and are applicable to up to 30 elements.
HNO3 + HCl + HF and HNO3 + HF mixtures dissolve silica matrices due to the
presence of HF, via the following reaction: HF + SiO2 → H2SiF6 + H2O.
In the present study, the three digestion methods reported above were compared for the analysis of eight agricultural soil samples collected at an Italian reference site, previously characterized within the framework of an APAT project focused on soil sampling uncertainty estimation [39, 40]. The target elements (As, Cd, Co, Cr, Cu, Ni, Pb, Sb and Zn) were determined in the solutions of digested samples using inductively coupled plasma mass spectrometer (ICP-MS). Furthermore, five elements (As, Co, Cr, Sb, Zn) were determined by the k0-standardization method of
Instrumental Neutron Activation Analysis (k0-INAA). INAA is a non-destructive
analytical method for the determination of the total content of inorganic components in solid matrices, because this method does not require any sample dissolution. INAA is a valuable technique particularly for elements that form or are in refractory phases that may be difficult to dissolve [41]. In this way, the effect of the dissolution step on the final analytical results for As, Co, Cr, Sb and Zn was investigated.
The difference between the reference values and the ICP-MS results on the solutions obtained in the laboratory with the three different digestion procedures was estimated by the laboratory bias. The modified microwave aqua regia method was applied to two different certified reference materials (LGC-6187 and BCR-141R) characterized for hot aqua regia total-recoverable trace metals. The microwave aqua regia + HF and HNO3 + HF methods were applied to digest two IAEA reference materials (SL-1
and Soil-7) characterized for total metal content. IAEA Soil-7 was as well used as quality control material for INAA determinations.
Material and methods Sample collection
Eight soil samples were collected at an agricultural site, located in the North East of Italy (Pozzuolo del Friuli, Udine), within the framework of an APAT project [39]. Sampling was performed in June 2001, using strictly controlled protocols. The details of sampling are fully described in Barbizzi et al. [40]. The agricultural area sampled reveals a quite balanced soil grain size distribution with a slight dominance of the silt fraction (47 %) and a low percentage of clay (below 16 %). In average, the fraction above 2 mm represents only the 13 % of the sampled soil. Relatively high pH values (about 7,7) and a low percentage of organic carbon content are observed. The Cation Exchange Capacity (CEC), along the area, reveals low values (in average below 16 cmol(+) kg-1). These are compatible both with the slight contribution
derived by low clay content and the poor level of organic carbon.
Sample preparation
Soil samples were weighed and stored in cardboard boxes and then dried in a oven fan at 36-40 °C until constant weight was reached. Then they were disaggregated using a wood pestle, sieved at 2 mm, the volume was reduced by quartering and riffling and at the end the laboratory samples were milled to 90 m to obtain the test samples [42]. Barbizzi et al. [40] report in more detail the sample preparation steps. From each of the eight test samples, 9 test portions [42] were taken for trace metals analysis by ICP-MS and 1 test portion was taken for INAA analysis. The homogeneity of the test samples has been tested by INAA, analysing 10 test portions from three different test samples.
Digestion methods
Microwave digestions were performed in a CEM Mars 5 microwave oven (Matthews, NC).
For the three digestion methods, a test portion of about 0.1 g was weighed into a 120 mL Teflon-PFA microwave digestion vessel after manually shaking the bottles for at least 1 minute.
The HNO3 + HF digestion (Method A) was performed by adding to the soil a mixture
The aqua regia + HF digestion (Method B) used in the present work followed the EN 13656 method [34] developed for elemental determination in wastes. A freshly prepared mixture of 2 mL HNO3 + 6 mL HCl + 2 mL HF was added to the sample.
The modified aqua regia digestion followed the method suggested by the Italian legislation (Method C) [33]. 1.5 mL H2O2, 4.5 mL HCl and 1.5 mL HNO3 were
added to the soil. Hydrogen peroxide was used to enhance the destruction of organic matter.
All the samples were microwave digested following the digestion cycles reported in Table 1. The time integrated energy was 5265 kJ and 3192 kJ respectively for method A and B. Every digestion cycle was performed using the maximum number of vessels available (12 vessels).
METHOD A HNO3 + HF METHOD B HCl + HNO3 + HF METHOD C HCl + HNO3 + H2O2
Time (min) Power (W) Time (min) Power (W) Time (min) Power (W) 10 250 2 500 10 250 10 400 2 0 10 450 10 650 5 500 10 600 5 400 5 800 5 250 10 250 5 1000
Table 1. Microwave oven digestion cycles (method A-B-C).
The three digestion procedures were performed in triplicate for each test sample (CRMs, RMs and agricultural soil samples).
After digestion, each aliquot was quantitatively transferred to a volumetric flask (Brand) and diluted with MilliQ water to 100 mL. Before diluting, rhodium at a concentration of 10 g/L was added as internal standard to minimize the instrumental signal fluctuation and matrix effects. The solutions were allowed to stand for 24h without removing the undissolved residue and then analysed by ICP-MS.
Nitric acid, hydrofluoric acid and hydrochloric acid of ultrapure grade were purchased from Merck.
ICP-MS determinations
Trace metal contents were determined on an Agilent technologies 7500c ICP-MS equipped with a collision cell to minimize polyatomic interferences and matrix effects. Babington nebulizer, standard spray chamber, Cetac ASX 500 auto sampler was used. The collision cell was pressurized with He gas (flow of 2.9 ml min-1) to reduce interferences by dissociating interfering polyatomic species by collision and by charge transfer. The ICP-MS is optimized daily with a tuning solution at 10 g L
-1 of Li, Ce, Y, Tl. Optimization is performed using normal mode and collision cell
mode. A typical analytical run after optimization of the ICP-MS consists of calibration standard solutions, procedure blanks, samples and CRM. Calibration standard solutions are daily prepared from a working standard solution containing 5 μg mL-1 of Cr and Zn, 0.5 μg mL-1 of Co, 1.5 μg mL-1 of Ni and Cu, 0.1 μg mL-1 of
Cd and Sb and 2.5 μg mL-1 of Pb. The working standard solution has been prepared
from 1000 µg mL-1 stock solutions of all elements by dilution with ultrapure water in a 100 mL volumetric flask. Calibration curve has been determined on five points for each element, in a range from 0 to 300 ng mL-1 for Cr and Zn, 0 to 30 ng mL-1 for Co, 0 to 90 ng mL-1 for Ni and Cu, 0 to 6 ng mL-1 for Cd and Sb and 0 to 150 ng mL
-1 for Pb. The calibration solutions are traceable to standards issued by NIST.
75As, 59Co, 52Cr, 60Ni, 63Cu, 66Zn, 111Cd, 121Sb and 208Pb isotopes were chosen for the
analysis.
In the present work, He was demonstrated to effectively minimize the interferences of 40Ar35Cl on the isotope 75As, 40Ar12C on 52Cr, 40Ar18O on the isotope 59Co and
44Ca16O, 23Na37Cl on the isotope 60Ni. For the agricultural soils the collision cell was
used only for 59Co and 75As. Two procedure blanks and two RMs were analysed every eight samples.
k0- INAA determinations
Determinations of As, Co, Cr, Sb and Zn by k0-INAA were carried out at the Jožef
Stefan Institute, Ljubljana, Slovenia. For details about k0-INAA and the relevant
nuclear data see Jaćimović et al. [41].
Test portions of about 0.2 g (one for each test sample) were sealed into suprapure plastic containers and irradiated for about 20 hours in the carousel facility of the TRIGA Mark II reactor, Ljubljana (thermal neutron flux 1.0*1012 n cm-2 s-1). A 1.0 mm Al-0.1% Au alloy wire pressed into a disk (diameter of 6 mm, thickness 0.2 mm) was co-irradiated with the sample as a comparator. The irradiated samples were subsequently transferred to clean polyethylene vials and counted on calibrated coaxial HPGe detectors connected to a multichannel analyser (MCA). Each irradiated sample was measured three times: after 2-3, 8 and 30 days cooling time. k0-INAA quality control was performed by using the reference material IAEA Soil-7.
Results of quality control are reported in Table 2.
IAEA Soil-7 Recommended Value (95% Confidence interval) INAA (n=14) mg kg-1 mg kg-1 Cr 60 (49 - 74) 69.5 ± 5.2 Co 8.9 (8.4 - 10.1) 8.8 ± 0.6 Zn 104 (101 - 113) 103.1 ± 6.2 As 13.4 (12.5 - 14.2) 14.5 ± 0.6 Sb 1.7 (1.4 - 1.8) 1.8 ± 0.09
Table 2. Element contents determined by INAA in the RM IAEA Soil-7. Results are reported with their standard deviations at an approximate level of 95%. The table also reports the recommended values and the 95% confidence intervals for IAEA Soil-7 (n= number of independent replicates).
Laboratory bias determination
Reference materials (RMs) such as IAEA SL-1 (lake sediment) and IAEA Soil-7 from the International Atomic Energy Agency (IAEA), Austria, and certified reference materials (CRMs) BCR-141R (calcareous loam soil) from the Commission
of the European Communities, Belgium and LGC-6187 (river sediment) from the Laboratory of the Government Chemist (LGC), UK, were digested in triplicate following the procedures reported above. As previously stated, IAEA SL-1 and IAEA Soil-7 are characterized for total metals content and were processed by microwave digestion using aqua regia + HF and HNO3 + HF. The certified reference
materials BCR-141R and LGC-6187 are supplied with certified values for extractable metals using methods based on DIN 38414-S7 and ISO11466, respectively, and were digested in this study by using the modified aqua regia procedure. The BCR-141R is certificate for total mass fraction as well. Bias was judged by comparing the measured mass fraction with the certified/recommended values for the RMs [37].
Result presentation
In this paper the statistical terms (repeatability coefficient of variation, standard deviation, etc.) refer to ISO 3534-1 [43]. Repeatability coefficient of variation was defined as the ratio of the standard deviation to the average, obtained under repeatability condition expressed as CV%.
Standard deviations associated with the results of the measurements are multiplied by 2 at an approximate level of confidence 95%.
Analytical recovery is defined as the value observed divided by the value expected and multiplied by 100.
On the basis of the assumption that measurement results obtained on homogeneous material are distributed normally, the comparison between methods (A+B+C vs. INAA and A+B vs. C) was carried out using the grand mean, requiring data normally distributed. The assumption of normal distribution of the results is derived from inter-laboratory comparisons carried out by APAT, in which the normality of the distribution of the metal contents in sediment/compost RMs was verified on data from about 70 laboratories [44, 45].
Measured mass fractions Method A
HNO3 + HF
Method B HCl + HNO3 + HF
IAEA Soil-7 IAEA SL-1 IAEA Soil-7 IAEA SL-1 IAEA Soil-7 IAEA SL-1 Recommended value (95% Confidence interval) Recommended value (95% Confidence interval) (n=3) (n=3) (n=3) (n=3) mg kg-1 mg kg-1 mg kg-1 mg kg-1 mg kg-1 mg kg-1 Cr 60 (49 - 74) 104* (95 – 113) 49 ± 10 109 ± 19 54 ± 16 106 ± 17 Co 8.9 (8.4 - 10.1) 19.8 (18.3 - 21.3) 9 ± 1 18 ± 3 9 ± 2 18 ± 4 Ni 26* (21 - 37) 44.9* (36.9 - 53.9) 26 ± 3 47 ± 4 25 ± 9 46 ± 7 Cu 11 (9 - 13) 30* (24 - 36) 9.5 ± 2 30 ± 4 10 ± 3 30 ± 6 Zn 104 (101 - 113) 223 (213 - 233) 94 ± 13 189 ± 15 90 ± 22 193 ± 50 As 13.4 (12.5 - 14.2) 27.6 (24.7 - 30.5) 13.4 ± 1.4 28.2 ± 1.5 13 ± 3 28 ± 5 Sb 1.7 (1.4 - 1.8) 1.31* (1.19 - 1.43) 1.7 ± 0.2 1.29 ± 0.09 1.6 ± 0.4 1.2 ± 0.2 Cd 1.3* (1.1 - 2.7) 0.26* (0.21 - 0.31) 1.20 ± 0.15 0.26 ± 0.03 1.2 ± 0.3 0.21 ± 0.09 Pb 60 (55 - 71) 37.7* (30.3 - 45.1) 49 ± 7 32 ± 9 60 ± 14 37 ± 8 * = information value.
Table 3. Element contents for digestion methods A-B applied to IAEA Soil-7 and SL-1 RMs. Results are reported with their standard deviations at an approximate level of 95%. The table also reports the certified values and the 95% confidence intervals for IAEA Soil-7 and SL-1 (n= number of independent replicates).
LGC6187 BCR 141R Measured mass fractions Method C HCl + HNO3 + H2O2 Certificate Aqua regia soluble mass fraction Certificate Aqua regia soluble mass fraction Certificate Total mass fraction LGC6187 (n=10) BCR 141R (n=4) mg kg-1 mg kg-1 mg kg-1 mg kg-1 CV% mg kg-1 CV% Cr 84 ± 9.4 138 ± 5 195 ± 7 101 ±14 6.8 155 ±7 2.4 Co 9.2 ± 0.5 10.5 ±0.4 10.1 ±0.1 0.5 Ni 34.7 ± 1.7 94 ± 5 103 ±3 41 ±8 9.3 93 ±8 4.3 Cu 83.6 ± 4.1 46.9 ± 1.8 46.4 ± 8 94 ±13 6.8 46.4 ±0.2 0.2 Zn 439 ± 26 270 ± 8 283 ±5 455 ±19 2.1 261±6 1.1 As 24 ± 3.2 29±2 3.1 Cd 2.7±0.3 14 ± 0.4 14.6±0.5 2.9±0.4 6.1 13.6±0.2 0.6 Pb 77.2±4.5 51.3±2 57.2±1.2 82±4 2.2 50.7±0.6 0.6
Table 4. Element contents for digestion method C applied to LGC-6187 and BCR 141R CRMs. Results are reported with their standard deviations at an approximate level of 95%. The table also reports the certified values for extractable metals, total mass fraction and their uncertainties. The uncertainty represents the half-width of the 95% confidence interval (n= number of independent replicates).
RESULTS AND DISCUSSION
Laboratory bias and repeatability standard deviations in RMs and CRMs
In general, recoveries (% R) within 81% to 122% were obtained for all elements for the three digestion methods.
Table 3 reports the results and the associated standard deviations obtained with methods A and B compared with the certified values of the two RMs (IAEA Soil-7 and IAEA SL-1). Co, Ni, Cu, As, Sb and Cd contents are unbiased for both methods in the two RMs.
Low recoveries for Cr even using HF (method A and B) are described in the literature [46, 47] and are associated with the presence of insoluble refractory Cr minerals such as chromospinels and chromites (FeCr2O7). These minerals, frequently
occurring in geological materials, are very difficult to dissolve; this behaviour can result in low recovery. In this investigation, all values of “total” Cr mass fraction determinations fall within the confidence intervals reported in the certificate of RMs. The lower efficiency of digestion methods in extracting Cr from soils can be detected aggregating the analytical data of the laboratories participating in the certification of IAEA Soil-7 and IAEA SL-1 [48, 49]. The mean values obtained for IAEA Soil-7 are 67 ± 6 mg kg-1, in the case of determinations by direct INAA method, and 50 ±
11 mg kg-1, in the case of digestion method associated with atomic absorption spectrometry. These values are respectively higher and lower than the recommended value. The same behaviour is shown for IAEA SL-1 where the aggregated values lead to 112 ± 19 mg kg-1, for INAA, and 89 ± 29 mg kg-1, for methods associated to
atomic absorption spectrometry.
The Zn content determined with method A in IAEA SL-1 is significantly lower than the reference value. In the other cases, Zn mass fraction values overlap with the 95% confidence interval of the RMs, but all values are lower than the reference values. Zn is generally totally brought into solution, thus the ICP-MS procedure used in this study needs further investigation.
Pb content determined with method A in IAEA Soil-7 is significantly negatively biased. Low recoveries for Pb (81% and 85 %) using method A may be related to the internal standard used. Rh is not suitable to minimize the instrumental signal fluctuation and matrix effects. The comparison between the results obtained with methods A and B shows that there is no significant difference between the methods, with the exception of Pb in IAEA Soil-7. The results reported in Table 3 show that the standard deviations are generally lower for method A than for method B. This could be explained by the difference in total energy input used in the digestion steps. Method A uses a higher total energy input (5265 kJ) than method B (3192 kJ).
Table 4 reports the results obtained with method C in LGC-6187, certified for aqua regia method, and in BCR-141R certified for aqua regia extractable elements and for the total element contents. The uncertainties reported for the CRMs represent the
95% confidence limit. The standard deviations associated with the measured values are reported with an approximate level of confidence of 95%. Generally, the repeatability coefficient of variation for method C are lower for BCR-141R than for LGC-6187. This could be due to a higher homogeneity of BCR-141R in comparison with that of LGC-6187 certified reference material. The element mass fractions obtained on LGC-6187 were significantly positively biased for As, Cr and Ni, while on BCR-141R only Cr and Co are positively biased in comparison with element mass fractions certified using aqua regia. For Zn, Cu, Cd, and Pb the results with their standard deviations do not clearly overlap the 95% confidence interval of the recommended values. To check if the mass fraction values of these elements in LGC-6187 are biased, the criterion reported in ISO Guide 33 [50] has been used. On the basis of this criterion, that compare the bias with the uncertainty of the certified value combined with the standard deviation of the measurement process, Zn, Cu, Cd and Pb mass fractions are unbiased. The same ISO criterion was applied on the results obtained in BCR-141R. Zn content is negatively biased in comparison with the certified value for aqua regia soluble mass fraction.
The comparison between the certified total elements contents in BCR-141R and the values obtained with method C show that Cr and Co are negatively biased. The application of ISO criterion show that Zn content value is negatively biased.
The results above reported could be explained by the different procedures used in this study in comparison with those used for CRM certification. The degree of dissolution of solid sample with aqua regia depends on the input of energy. Method C uses different power inputs and different reaction times during the digestion step than those used in the certification of LGC-6187 (conventional heating under open reflux condition) and BCR-141R. H2O2 used in method C enhances the dissolution of
the organic mass fraction. To investigate the effects induced by the procedure used in this work, LGC-6187 was digested using aqua regia microwave assisted, without the addition of H2O2 (Table 5). In this case the contents of Cr, Ni, Cu and As are
unbiased, while the content of Zn is significantly negatively biased. This confirms the need of further investigations on Zn determination by ICP-MS.
Method aqua regia (ISO11466*) LGC6187 (n=3) mg kg-1 Recovery % Cr 92+3 110 Ni 36+2 104 Cu 86+2 103 Zn 390+56 89 As 25.1+0.5 105
* = microwave assisted digestion method
Table 5. Element concentrations using aqua regia digestion method applied to LGC-6187 CRM. Results are reported with their standard deviations at an approximate level of 95%. (n= number of independent replicates).
Comparison of the three digestion methods in determining elements in agricultural soil samples
The homogeneity of the soil test samples was verified measuring by INAA 10 test portions from 3 different test samples. The coefficient of variation for all elements (As, Co, Cr, Sb and Zn) was less than 4%. These results indicate that the differences among methods can be detected when their differences are higher than the residual heterogeneity in the test samples.
In the soil samples the higher precision of method A compared with method B is not confirmed. As an example, CVs for As range from 1 to 14% (method A) and from 1 to 6% (method B), while for Cr CVs range from 1 to 13% (method A) and from 2 to 16% (method B). This different behaviour between the agricultural soils and the RMs (IAEA Soil 7 and IAEA SL1) could be due to the different matrices and to the levels of homogeneity in RMs and in the test samples used.
The results for As, Cd, Co, Cr, Cu, Ni, Pb, Sb and Zn with methods A and B on the eight agricultural soils are pooled on the basis of studies on RMs. The results obtained with method A and B are compared with those measured after sample
extraction with method C (Table 6). All the results are reported with their standard deviations with an approximate level of confidence of 95%.
Analysis of variance using the ANOVA test at a confidence level of α = 0.05 [51] was performed to assess the significance of differences among the three methods. ANOVA shows no significant differences for As, Cd, Co, Cu, Ni, Pb and Zn. These results suggest that for the soil analysed the partial digestion method aqua regia leads to results equivalent to those of the total digestion methods.
For Cr, the ANOVA test shows a statistically significant difference among the methods A-B-C, attributable to method C. As can be easily recognized from Figure 4 and Table 6, Cr mass fractions determined with method C are lower by a factor of two than methods A and B. This could be due to the presence of insoluble refractory Cr minerals which cannot be dissolved without using HF. Similar low recoveries (23%-74%) for Cr using the aqua regia digestion procedure are described in the literature for river sediments and soils [52, 53].
The ICP-MS results on sample digested with method C for Sb (Figure 5 and Table 6) show mass fraction values about 50% lower than method A and B. These results could be due to a not efficient extraction of Sb normally bound to silicates.
A t-test at a confidence level of α = 0.05 between methods A and B, showed no significant difference for Cr and Sb.
Soil sample Cr Co Ni Cu Zn As Cd Sb Pb A + B* (n = 6) mg kg-1 C** (n = 3) mg kg -1 A + B ( n= 6) mg kg -1 C (n = 3) mg kg-1 A + B (n = 6) mg kg -1 C** (n = 3) mg kg-1 A + B (n = 6) mg kg -1 C (n = 3) mg kg-1 A + B (n = 6) mg kg -1 C (n = 3) mg kg -1 A + B (n = 6) mg kg-1 C (n = 3) mg kg-1 A + B (n = 6) mg kg-1 C (n = 3) mg kg-1 A + B (n = 6) mg kg-1 C (n = 3) mg kg-1 A + B (n = 6) mg kg -1 C (n = 3) mg kg-1 1 119 ± 9 60 ± 2 13 ± 1 13.3 ± 0.2 47 ± 4 50 ± 6 42 ± 5 43 ± 1 95 ± 6 95 ± 5 10.8 ± 0.7 12.0 ± 0.1 0.66 ± 0.05 0.66 ± 0.03 1.26 ± 0.13 0.660 ± 0.003 36 ± 3 38 ± 2 31.4 ± 0.7 2 122 ± 27 57 ± 2 13 ± 2 12.3 ± 0.5 49 ± 4 46 ± 3 35 ± 4 34 ± 1 94 ± 11 85 ± 3 11 ± 2 11.2 ± 0.3 0.68 ± 0.12 0.66 ± 0.01 1.36 ± 0.24 0.7 ± 0.1 38 ± 7 3 123 ± 24 59 ± 1 13 ± 1 12.9 ± 0.2 48 ± 7 47 ± 2 46 ± 5 47.2 ± 0.5 91 ± 10 88 ± 2 11.1 ± 0.9 11.9 ± 0.3 0.62 ± 0.08 0.64 ± 0.01 1.24 ± 0.10 0.66 ± 0.05 34 ± 2 31 ± 1 29.7 ± 0.6 4 116 ± 21 62 ± 7 12 ± 1 12.3 ± 0.3 45 ± 4 48 ± 3 44 ± 4 46 ± 1 87 ± 12 88 ± 4 11.2 ± 1.5 12.1 ± 0.2 0.60 ± 0.15 0.6 ± 0.1 1.27 ± 0.23 0.67 ± 0.02 32 ± 3 5 114 ± 22 62 ± 4 13 ± 1 12.9 ± 0.2 49 ± 9 48 ± 2 38 ± 4 39.2 ± 0.9 88 ± 10 90 ± 6 10.6 ± 1.2 11.3 ± 0.4 0.58 ± 0.12 0.58 ± 0.03 1.23 ± 0.23 0.61 ± 0.03 30 ± 3 29 ± 1 6 109 ± 39 50 ± 3 11 ± 1 10.6 ± 0.6 42 ± 6 39 ± 2 31 ± 4 31 ± 1 79 ± 9 81 ± 10 9.6 ± 0.3 9.9 ± 0.6 0.57 ± 0.08 0.55 ± 0.02 1.13 ± 0.13 0.57 ± 0.04 28 ± 1 24 ± 1 7 104 ± 20 49 ± 4 11 ± 1 10.5 ± 0.7 42 ± 12 39 ± 2 37 ± 8 36 ± 2 78 ± 11 77 ± 2 9.5 ± 0.4 9.9 ± 0.5 0.54 ± 0.06 0.55 ± 0.02 1.17 ± 0.11 0.55 ± 0.05 29 ± 2 27 ± 1 8 84 ± 15 42 ± 3 9 ± 1 9.0 ± 0.5 35 ± 12 31.0 ± 0.2 29 ± 6 28.8 ± 0.2 69 ± 6 67 ± 3 8.3 ± 0.9 8.7 ± 0.6 0.54 ± 0.10 0.51 ± 0.02 0.99 ± 0.09 0.49 ± 0.05 26 ± 1 23 ± 1 * A + B = results from method A (HNO3 + HF) pooled with results from method B (HCl + HNO3 + HF)
** C = results from method C (HCl + HNO3 + H2O2 )
Table 6. ICP-MS results for 8 Italian agricultural soils. Results obtained after digestion with method A and B are pooled and reported as
A+B. Column C reports results obtained after digestion with method C. Results are reported with their standard deviations at an approximate level of 95%. (n= number of independent replicates).
Figure 4. Cr results for eight agricultural soils determined by ICP-MS after acid digestion by methods A, B and C (grey = method A; squared = method B; striped = method C). The error bars represent the standard deviation of three replicates.
Figure 5. Sb results for eight agricultural soils determined by ICP-MS after acid digestion by methods A, B and C (grey = method A; squared = method B; striped = method C). The error bars represent the standard deviation of three replicates.
Comparison of ICP-MS measurements with INAA in determining elements in agricultural soils
ICP-MS, after the soil digestion with methods A, B and C, and the INAA analytical results for the eight agricultural soils investigated. INAA data are reported with the standard deviation from counting statistics in gamma spectrometry. The comparison of k0-INAA results with those
obtained by ICP-MS measurements are in good agreement for all elements except for Zn that is slightly underestimated. This result confirms the needs of future studies on Zn determination by ICP-MS. Looking at the results obtained after the digestion with method A, Cr mass fractions in soil are lower than k0-INAA values (Table 8). These results are attributable to an incomplete
digestion of Cr, bound to residual fraction as refractory mineral, even using HF. Yang et al. [47] reported low recoveries for Cr in a certified reference material, HISS (sediment), using ICP-MS and closed vessel digestion with HF and HNO3. The authors obtained mass fraction values which
were almost three times lower than the value found by INAA. Sb mass fraction values in ICP-MS determinations are slightly higher than INAA determinations. The presence of HF in the digestion mixture, in this case, is sufficient for the complete digestion of silicate bound Sb.
As (mg kg-1) Zn (mg kg-1) Co (mg kg-1) Soil Sample ICP-MS Grand Mean methods A, B, C* (n=3) INAA (n=1) ICP-MS Grand Mean methods A, B, C (n=3) INAA (n=1) ICP-MS Grand Mean methods A, B, C (n=3) INAA (n=1) 1 11 ±1 11 ±1 95 ±4 101 ±8 13 0 ±0 9 13 ±1 2 11 ±1 11 ±1 91 ±12 97 ±8 12 5 ±0 4 13 ±1 3 11 4 ±1 1 11±1 90 ±5 99 ±8 12 9 ±0 2 13 ±1 4 11 5 ±1 4 12 ±1 88 ±3 90 ±7 12 1 ±0 3 12 ±1 5 10 8 ±0 9 10 7 ±0 8 89 ±3 89 ±7 12 7±0 5 12 ±1 6 9 7 ±0 5 9 0 ± 0 7 80±5 83 ±7 10 9 ±0 5 11 ±1 7 9 6±0 5 9 5 ± 0 8 77 ±9 85 ±+ 7 10 7 ±0 5 11 ±1 8 8 4 ±0 5 8 7 ± 0 7 68 ±2 73 ±6 9 1 ±0 4 9 5 ± 0 8
*methods A, B, C= grand mean of the ICP-MS results after digestion with method A (HNO3 + HF), B (HCl + HNO3 + HF) and C (HCl + HNO3 + H2O2)
Table7. ICP-MS and INAA results on Italian agricultural soil. Grand means of data obtained after digestion with method A, B and C. Results are reported with their standard deviations at an approximate level of 95%. (n= number of independent replicates).
Cr (mg kg-1) Sb (mg kg-1) Soil Sample ICP-MS Method A* (n=3) INAA (n=1) ICP-MS Method A (n=3) INAA (n=1) 1 121±10 223 ± 19 1 3 ± 0 1 1 2 ± 0 1 2 132 ± 27 260 ± 21 1 4 ± 0 3 1 2 ± 0 1 3 125 ± 18 215 ± 19 1 28 ± 0 09 1 3 ± 0 1 4 136 ± 31 215 ± 19 1 3 ± 0 3 1 3 ± 0 1 5 123 ± 10 219 ± 19 1 3 ± 0 3 1 2 ± 0 1 6 125 ± 24 234 ± 21 1 2±0 1 1 1 ± 0 1 7 111±21 250 ± 21 1 23 ± 0 02 1 1 ± 0 1 8 90 ± 2 224 ± 19 1 01±0 08 1 0 ± 0 1 *method A= HNO3 + HF
Table 8. Cr and Sb contents in Italian agricultural soil. Comparison between the results obtained with method A and ICP-MS with INAA results. Results are reported with their standard deviations at an approximate level of 95%. (n= number of independent replicates).
CONCLUSIONS
For methods A and B, Co, Ni, Cu, As, Sb and Cd are unbiased, while for method C, Cu, Cd and Pb are unbiased in comparison with the certified values of the selected RMs.
Both methods A and B generally showed a good repeatability standard deviation. The higher precision of method A is found only in the case of the RMs and not for the real soil samples analysed. Concerning method C, the results on LGC-6187 show higher repeatability than those on BCR141R.
Modified digestion conditions, occurring in method C, in terms of energy input of microwave, determined positively biased values for Cr element for both CRMs certified for aqua regia soluble mass fraction (LGC-6187 and BCR141R). Cd, Pb and Cu mass fraction values are in agreement with the certified values in both CRMs. Zn is generally negatively biased for all methods. Zn is generally totally brought into solution, thus the ICP-MS procedure used in this study needs further investigation.
ANOVA was performed among the ICP-MS results obtained after the application of the three digestion methods on eight agricultural soil samples, collected in one test area. The only significant differences are related to Cr and Sb results obtained after extraction with method C (modified aqua regia). This could be due to the presence in the soil of insoluble Cr minerals and Sb bound to silicates.
k0-INAA analytical results of the soil samples were compared with ICP-MS measurements on the
same test samples. The results of As and Co are in good agreement regardless which of the three digestion methods is used. In this case, the procedures used do not affect the final analytical results.
Cr results, even if obtained with “total” digestion method with the best recovery (method A), are lower by a factor of 2 than the INAA results. Sb after digestion with HNO3 + HF is in good
agreement with INAA results.
In conclusion, the results reported in this paper highlight that the digestion procedure is an essential part of the definition of the measurement procedure in environmental analysis.
SECTION 3. Total trace metal concentrations
The acid digestion of solid matrices is a necessary step prior to the determination of total trace metal content by Inductively Coupled Plasma mass Spectrometry (ICP-MS).
The five soil samples (Saliceto, Millesimo, ERSA, Scarlino 1-2) and compost were digested and analysed using the information outcome from section 2. This section reports the results obtained using three different microwave acid digestion procedures (HF + HNO3,aqua regia +
HF and modified aqua regia) for the dissolution of eight agricultural soil samples and on four certified reference materials.
The target elements were determined in the digested solutions using an inductively coupled plasma mass spectrometer (ICP-MS).
As expected, the digestion method efficiency appears to be strongly dependent on element and soil matrices. As reported in more details in section 2, the three digestion procedures can be considered equivalent for the determination of almost all elements under study.
In addition, the digestion method using HF + HNO3 (method A) provided more precise results
for RMs with respect to aqua regia + HF procedure (method B). In addition, the use of HF for methods AandB provides higher recovery for Cr and Sb with respect to the aqua regia procedure (method C).
In this context, for the digestion of the 5 soils and compost, it was selected the digestion method A, following the procedure reported in details in section 2. For the compost sample, the procedure was slightly modified, using 0.5 ml of H2O2 instead of 0.5 ml of MilliQ water, in order
to enhance the disruption of organic fractions, highly present in compost. The results are reported in Appendix 1, Table 9.
Appendix 1 Sample Cr RSD Mn RSD Fe RSD Co RSD Ni RSD Cu RSD Zn RSD As RSD Cd RSD Pb RSD mg/kg % mg/kg % mg/kg % mg/kg % mg/kg % mg/kg % mg/kg % mg/kg % mg/kg % mg/kg % ERSA 93.32 0.7 1188.91 0.9 26983 1.1 11.47 1.0 46.42 1.1 39.07 1.1 92.11 0.8 11.02 1.4 0.42 5.8 33.20 0.7 Compost 19.18 0.5 323.08 0.6 15984 1.3 3.42 1.0 8.58 1.0 63.37 1.0 152.96 0.9 4.58 4.0 0.50 3.4 98.50 1.0 Scarlino 1 10.87 2.8 784.91 1.6 358460 1.1 257.19 0.5 11.10 1.6 272.96 0.6 1058.23 0.9 397.26 0.7 3.28 3.5 910.29 1.2 Scarlino 2 11.24 1.5 263.74 0.7 278599 1.2 191.82 0.6 6.93 1.6 208.42 0.6 403.96 0.7 385.27 0.6 0.96 5.5 1781.45 0.7 Millesimo 61.36 0.6 419.36 0.5 27772 1.2 7.79 0.6 30.20 0.7 14.01 0.9 107.78 1.0 25.80 0.8 0.42 2.7 31.61 0.3 Saliceto 145.96 0.3 1054.24 0.2 31962 0.7 23.21 0.6 101.08 0.6 24.08 0.7 99.11 0.9 32.37 1.3 0.48 4.8 49.35 0.7
SECTION 4. Single extraction procedures
Introduction
The development and use of extraction schemes started at the end of 1970s and aimed to evaluate the metal fractions available to plants and the environmentally accessible trace metals, e.g. the mobility of metals from a soil. These methods are still widely used for soils and sediments as reflected by the number of recently published papers on their applications to environmental studies.
Complexing agents solubilize not only the exchangeable element fraction but also the element fraction forming organic matter complexes and the element fraction fixed on the soil hydroxides.
Once the metal is adsorbed onto these fractions it is taken out of the environmental processes. To be de-sorbed and return into the soil solution, a large amount of energy is required. In order to quantify the concentration of heavy metals in the soils in the adsorbed and/or complexed forms it is necessary to use an extractant able to form particularly stable complexes with these elements. These procedures represent a useful approach for environmental studies for soils and sediments, providing practical information on the fractionation of metals. However, it has to be renowned that extraction procedures provide a simple classification of soil metal fractions, but these are based on arbitrary responses to chemical reagents rather than on a true reflection of metal lability. In other words, the extracted “forms” should be only related to the extractant used, for example EDTA-extractable element and not as “bioavailable” or “mobile” forms which are interpretations of data rather than results of actual measurements.
Material and Methods
The methods used in the present work use as extractant a solution of diethylen triamino pentaacetic acid (DTPA) in the presence of calcium chloride and triethanol amine buffered at pH 7.3 [54]. This method is generally recommended for alkaline soils. The soil-extractant ratio is 1:2.
DTPA is widely used in USA and is rather applied to predict plant uptake. The procedure reported in the ISO 14870 [55] was followed. The results are reported in table 10. Although this procedure is suggested for alkaline soils, it has been applied on all soils and compost under study in the present work (except for Bovisa soil). The repeatability of the procedure is studied by replicating the extraction on three independent sub-sample of both Saliceto and Millesimo soils (table 11).
For acidic soils, the extraction with a solution of etilen diamino tetracetic acid (EDTA) at pH of 4.75 is widely used [7]. The soil-extractant ratio is in this case 1:5. The lower solid-liquid ratio renders this procedure easier to apply with respect to DTPA test for which the high mass/volume ratio limits the volume collected after the extraction step. The procedure reported in the Italian Ministerial decree (DM 13/9/99) was followed. The results are reported in table 12. Although this procedure is suggested for acidic soils, it has been applied on all soils under study in the present work and described in section 1 (except for Bovisa soil). The repeatability of the procedure was studied by replicating the extraction on three independent sub-sample of both Saliceto and Scarlino 1 soils (table 13).
It is assumed that EDTA extraction enables a complete extraction and mimics the mobility of trace metals from soils. The choice of extractant must be determined by the objectives of the study.
Determination of elements content
The EDTA and DTPA extracted solutions were analysed for metals content on an Agilent technologies 7500c ICP-MS equipped with a collision cell to minimize the polyatomic interferences and matrix effects. In particular, Cr, Mn, Co, Ni, Cu, Zn, As, Cd and Pb were determined in both EDTA and DTPA extracted solutions. In addition, Fe was determined in the DTPA extracts, since this complexant is recommended for this metal. Rhodium at a concentration of 10 g/L was added as internal standard to the extracted solutions to minimize the instrumental signal fluctuation and matrix effects.
From Tables 11 and 13 appears that EDTA extraction procedure is more repeatable than DTPA. In fact, high relative standard deviations (RSD%) of three independent extraction replicates were found for this latter method. This is particularly marked in case of Ni in the Millesimo sample (22.6%) and for Zn in the Saliceto one (20.6%). This feature is probably due to the substantial instability of the DTPA-extracts, well documented especially in case of Zn [2]. The EDTA procedure achieved precise results for all elements under investigation, attaining RSD% below or equal to 9.4%. Table 10 shows that DTPA extraction procedure is not recommended for the determination of Cr. Actually, almost all the Cr concentrations are below the detection limit of ICP-MS.
It is easily recognizable from the results in Table 10 and 12 that DTPA procedure generally extract less than EDTA. This feature is well reported in literature [2].
However, it is interesting to note that for the soils characterized by low pH (Scarlino n°1-2) the DTPA and EDTA extraction procedure achieved very similar results, particularly in case of Mn, Co, Cd, Ni (Scarlino 2), and to a less extent for Zn. These results could be explained considering the typical increased solubility of metals at low pH, which renders the metals more available to be complexed also by relatively weak chelators such as DTPA.
By comparing the total metal concentrations as determined in section 3, up to 1-2 orders of magnitude differences are observed between the concentration in the extract and the total metal amount.
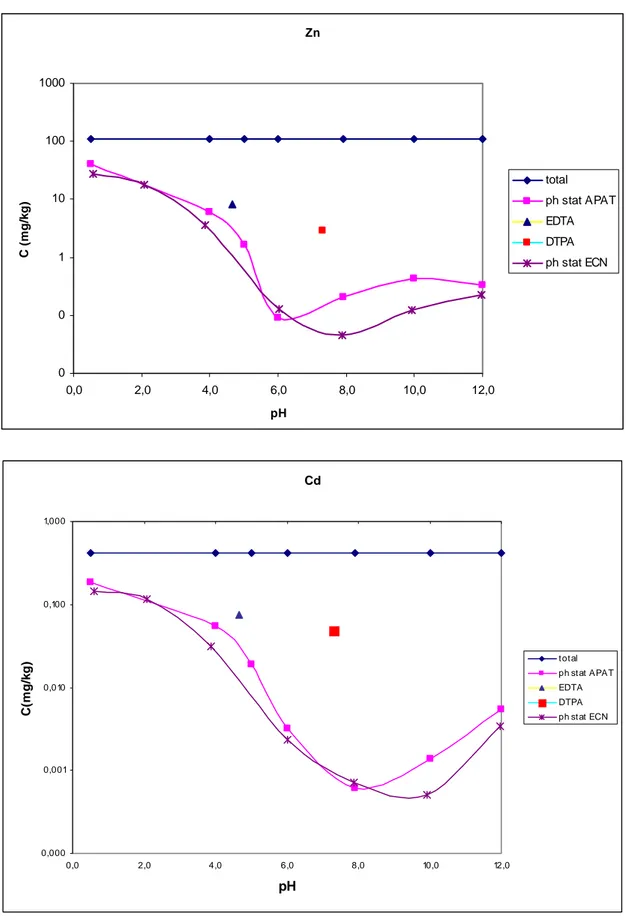
The results for EDTA and DTPA extraction procedure applied to Scarlino 1 and Millesimo samples are also reported in section 5 and “positioned” at the corresponding pH, on the curve of metal leached concentrations as a function of pH. For further details see section 5.
Sample code Cr RSD Mn RSD Fe RSD Co RSD Ni RSD Cu RSD Zn RSD As RSD Cd RSD Pb RSD mg/kg % mg/kg % mg/kg % mg/kg % mg/kg % mg/kg % mg/kg % mg/kg % mg/kg % mg/kg % MILLESIMO <LD 6.40 1.44 26.40 1.59 0.06 0.76 0.25 1.00 1.47 0.83 2.88 8.98 0.03 2.64 0.05 2.96 5.66 0.39 SALICETO <LD 7.90 0.80 18.98 0.93 0.05 0.64 0.72 0.92 2.38 0.83 0.94 1.41 0.01 6.21 0.06 2.45 3.86 0.64 SCARLINO 1 <LD 254.04 1.20 662.52 0.74 6.13 0.64 0.45 0.32 9.18 0.70 229.65 0.58 0.01 13.36 1.20 0.73 6.07 0.52 SCARLINO 2 0.92 1.10 138.80 1.72 7679.51 1.04 10.54 0.50 1.04 0.71 41.25 0.13 208.93 0.55 3.33 1.12 0.84 0.96 1.09 1.56 ERSA <LD 25.68 1.79 28.96 1.10 0.02 6.44 0.21 1.96 5.52 0.75 1.91 0.57 13.54 5.73 0.16 1.93 2.69 1.18 COMPOST <LD 121.66 0.17 406.56 0.59 0.47 0.25 0.56 0.86 3.39 0.39 72.08 0.67 0.07 6.13 0.12 1.83 15.02 0.46
Table 10. DTPA extraction procedure applied to the soils and compost samples.
Sample code Cr Mn Fe Co Ni Cu Zn As Cd Pb
RSD% RSD% RSD% RSD% RSD% RSD% RSD% RSD% RSD% RSD%
MILLESIMO - 6.3 0.6 12.4 22.6 9.5 12.0 1.3 2.0 0.7
SALICETO - 8.7 10.9 11.7 7.5 10.1 20.6 6.6 2.9 3.5
Table 11. Repeatability of DTPA extraction expressed as relative standard (as percentage) of three independent extraction procedures on Scarlino
Sample code Cr RSD Mn RSD Co RSD Ni RSD Cu RSD Zn RSD As RSD Cd RSD Pb RSD mg/kg % mg/kg % mg/kg % mg/kg % mg/kg % mg/kg % mg/kg % mg/kg % mg/kg % ERSA 0.10 5.46 503.34 0.50 2.44 0.22 2.42 2.06 13.51 1.13 5.29 1.20 0.14 3.79 0.32 3.05 12.15 1.14 MILLESIMO 0.14 2.96 91.56 0.63 1.32 0.37 1.00 2.02 3.35 1.43 8.28 0.22 0.77 1.16 0.07 4.65 10.67 0.20 SALICETO 0.17 5.79 152.77 0.38 1.85 1.55 3.48 2.11 6.20 0.70 2.98 0.55 0.49 0.08 0.09 6.42 12.88 1.51 SCARLINO 1 0.41 6.18 255.32 0.74 6.90 0.53 0.74 5.05 29.23 1.14 246.32 0.96 0.11 6.54 1.28 1.41 377.63 1.88 SCARLINO 2 0.98 1.13 139.53 1.36 10.74 1.21 0.95 3.84 33.66 1.35 159.62 1.14 0.16 9.13 0.81 1.96 16.68 2.12 COMPOST 0.19 1.48 164.98 0.74 0.61 1.71 1.05 0.47 10.05 0.38 84.40 1.38 0.42 4.74 0.27 1.82 36.74 0.24
Table 12. EDTA extraction procedure applied to the soils samples and compost.
Sample code Cr Mn Co Ni Cu Zn As Cd Pb
RSD% RSD% RSD% RSD% RSD% RSD% RSD% RSD% RSD%
SCARLINO 1 8.5 2.2 4.2 3.9 9.4 4.3 5.6 4.1 9.4
SALICETO 7.8 2.0 4.4 1.2 0.6 3.9 2.4 4.4 1.5
Table 13. Repeatability of EDTA extraction expressed as relative standard (as percentage) of three independent extraction procedures on Scarlino
SECTION 5. Leaching tests
Introduction
In recent years, it is increasingly being accepted that risk-assessment of contaminated environments should be based on the mobile fractions, rather than total concentration levels, of contaminants in soils, sediments or solid waste materials. This realisation has led to the development and application of various leaching and extraction procedures, which aim at the measurement of environmentally-relevant subfractions of contaminants.
In particular, in matrices that contain organic matter, both particulate organic matter and dissolved organic matter play a key role in the potential for either mobilisation or sorption of constituents [56].
The main release controlling processes are common to all materials - soil, sludge, sediments, compost, industrial and municipal wastes and a wide range of construction materials, including wood and metal products [6].
Leaching can occur in the field by exposure of material to natural infiltration or precipitation (for example a natural soil exposed to rainwater infiltration) or in laboratory during leaching/extraction tests. Generally, leaching/extraction tests are designed to reflect a field exposure situation.
Worldwide a great number of leaching tests have been developed for both research and regulatory controls to evaluate the influence of environmental parameters on different types of material and the impact of the use of these materials in the environment. There are short and long term leaching tests using different leachants and low or high liquid/solid (L/S) ratios, tests performed with pH control or not, different ways of stirring and so on. Each of these tests provide different information and it is necessary to select the most appropriate leaching test on the basis of the specific environmental scenario. As reported in the figure 6, batch tests can quantify contaminant emissions (i.e. the leached amount) from contaminated soils and sediments as a function of the extent of contact with water that is the L/S ratio and/or time.
Figure 6. contaminant emission by leaching from contaminated sample as a function of L/S ratio and/or time and comparison with total contaminant amount
L/S or Time TOTAL
AVAILABLE
Emission
Considering that long term leaching behaviour of soils can not be obtained by experimenting in realistic time frames, the combination of modelling and accelerating certain aspects of leaching in batch or column tests can help to simulate such long term scenarios. This can be accomplished by increasing the volume of liquid used in batch tests or the throughput of liquid through columns.
In this context, the liquid to solid ratio is dramatically different at the laboratory scale (between 1 to 100 and more often 10) compared with the field situation (far below 1), simulating naturally occurring precipitation over a longer time frame.
Batch leaching methods are those in which a sample is placed in a given volume of leachant solution for a set period of time. Most of these methods require some type of agitation to insure constant contact between the sample and the leachant. At the end of the leaching period, the liquid is removed by filtration and analysed. In serial batch test, the sample is leached successively with fresh aliquots of the same leaching liquid. This method is intended to eliminate the effect of concentration on solubility and to simulate long term exposure to the leachant solution.
The driving force influencing the release of constituents from soils are the solubility of substances, the diffusion rate of the constituents inside the matrix and the wash off of the substances which lay on the surface of the matrix.
When risk-assessment is based on mobile, rather than total, metal concentrations, it is important to be able to assess the long-term leaching and


![Metal-ligand delocalization and spin density in the CuCl2 and [CuCl4]2- molecules: Some insights from wave function theory](data:image/gif;base64,R0lGODlhAQABAIAAAP///wAAACH5BAEAAAAALAAAAAABAAEAAAICRAEAOw==)