UNIVERSITA’ DI PISA Facoltà di Medicina e Chirurgia
Scuola di Specializzazione in Radiodiagnostica
Direttore Prof. Carlo Bartolozzi
Tesi di Specializzazione
PULMONARY DISEASE IN PRIMARY CILIARY DYSKINESIA:
CORRELATION BETWEEN HRCT AND STATIC LUNG VOLUMES
Relatore
Chiar.mo Prof. Carlo Bartolozzi
Candidata
Dott.ssa Marta Zangani
INDEX
Abstract ……… 3
Introduction ……….. 4
Materials and methods ………. 5
Results ……….. 9
Discussion ……… 11
References ……… 16
ABSTRACT
Background Primary ciliary dyskinesia is associated with progressive lung damage eventually culminating in chronic infection with Pseudomonas aeruginosa. Lung damage is usually evaluated by high-resolution computed tomography (HRCT).
Objective To evaluate whether the presence of HRCT abnormalities and of Pseudomonas aeruginosa infection was better predicted by spirometry or plethysmography.
Methods A cross-sectional study was performed in consecutive patients diagnosed with PCD.
All patients underwent sputum culture, spirometry, plethysmography and HRCT over a 48 hour period.
Results Fifty patients (26 children) were studied. Pseudomonas aeruginosa infection was found in 40% of the patients and bronchiectasis in 88%. There was a significant correlation between infection with Pseudomonas aeruginosa and extent of bronchiectasis (p=0.009, r=0.367) and air-trapping (p=0.03 r=0.315). Moreover, there was a significant association between infection with Pseudomonas
aeruginosa and RV values > 150% (p=0.04) and RV/TLC ratio > 140% (p=0.001), but not between infection with Pseudomonas aeruginosa and FEV1< 80%, or FEF25-75% < 70%, or FEV1/FVC < 70%
(< 80% in children). Severity of the total lung impairment on chest HRCT inversely correlated with FEV1 (p= 0.02; r= -0.322), FVC (p= 0.007; r= -0.376) and directly correlated with RV (p= 0.003;
r=0.423), and RV/TLC (p < 0.001; r= 0.513).
Conclusions Plethysmography predicts better than spirometry HRCT abnormalities, and might be a useful test to reduce the number of HRCT scans performed in PCD.
INTRODUCTION
Primary ciliary dyskinesia (PCD) is a rare (1:15-30 000 live births) genetic disorder, and nearly half the patients have situs inversus.[1] Abnormal motility of respiratory cilia and impaired mucociliary clearance result in a myriad of clinical manifestations including recurrent infections of the upper and lower airways, eventually causing permanent parenchymal damage, and progressive decline in lung function.
Chest high-resolution computed tomography (HRCT) has become the method of choice to evaluate structural airway changes,[2] and is used in conjunction with clinical and physiological findings in a number of chronic respiratory diseases including PCD.[3, 4]
However, there is little evidence that regular computed tomography scans affect outcome in PCD [5] and the potential high lifetime cumulative radiation exposure should be considered.[6, 7] Guidelines suggest that age-appropriate lung function tests should be performed at every visit in cooperative children [1, 5, 8] since it has been shown that the severity of structural abnormalities may correlate with impairment of pulmonary function, as reflected by first second forced expired volume (FEV1).[3, 4] However, a decreased FEV1 is not indicative of the site of airway obstruction
[9] and, as in cystic fibrosis, there are many reasons to believe that there is small airway disease early on in the course of PCD.[10] Furthermore, spirometry does not detect small airways disease until the damage is very advanced. Since small airways obstruction may lead to an increase of both residual volume (RV) and RV/total lung capacity (TLC) ratio,[9] we hypothesised that air trapping manifest by a raised RV and RV/TLC ratio may be more sensitive than spirometry to structural changes as shown by HRCT in PCD. The aim of the study was to determine the correlations between HRCT abnormalities and dynamic or static lung function parameters in patients with PCD, in order to assess their use as monitoring tools of the disease.[11]
MATERIALS AND METHODS Subjects
Between March 2008 and May 2010, we enrolled consecutively diagnosed PCD patients age > 6 years followed up in the Department of Paediatrics of the University of Pisa. PCD was diagnosed on standard criteria (below) and we obtained sputum, cough swab or pharyngeal aspirate cultures, spirometry and body plethysmography, and a high resolution computed tomography (HRCT) of the chest. Pharyngeal aspirate was obtained in uncooperative children after an overnight fast using a disposable catheter connected to a mucus extractor inserted into the mouth to a depth of 7 to 10 cm and drawn back while applying gentle suction.
Informed consent was obtained from adult patients or from the parents of children with PCD and the study protocol was approved by the Hospital Ethical Committee of Pisa.
Ciliary motion analysis and ultrastructural studies
Samples obtained from the inferior turbinate using a cytology brush (Microvasive, Milford, MA, USA) were suspended in 2 ml of Medium 199 fluid cell culture, in 2 ml of normal saline or in 5 ml of a PBS/antibiotic 2% solution, respectively, for immediate light-microscopic, for transmission electron microscopy (TEM) evaluation, and for cell cultures.[12] Ciliary morphology, motion pattern, beat frequency, ultrastructural studies, and ciliary activity after ciliogenesis in culture were evaluated according to standardised methodology.[13-15]
Ciliary motion analysis, ultrastructural assessment, and cultures were performed by different operators each one blind to the results obtained by the others.
Lung Function
Flow-volume curves and body plethysmography were obtained utilizing standard ATS methodology.[16, 17] Subjects were tested using a Master Screen Body equipment; Jaeger, Wuerzburg, Germany). FEV1 , FVC (Forced Vital Capacity), FEF25-75% (Forced Expiratory Flow
between 25% and 75% of FVC), RV, TLC and RV/TLC were expressed as percentage of predicted values .[18] Lung function studies were all performed on the same day, within two days of the HRCT.
Computed Tomographic scanning of chest
In all patients chest HRCT was performed either following the conventional 1 mm slice thickness 10 mm spacing protocol or applying a retroreconstruction algorithm after a spiral CT acquisition. No intravenous contrast was given and no anaesthesia was needed. All images were evaluated by the same radiologist who was blinded to the clinical data and scored using a modified Bhalla system,[19][*] which includes severity of bronchiectasis (score 0-3) and extent of bronchiectasis (score 0-3), mucous plugging (score 0-3), peribronchial thickening (score 0-3), parenchymal abnormalities, such as atelectasis (score 0-3) and focal air-trapping (score 0-3). Bronchiectasis was identified according to standard criteria.[20]
Thus, a severity class (from 1 to 3) for total lung impairment was obtained (class of severity 1 for total score of 0-6, class 2 for total score of 7-12, class 3 for total score of 13-18).
Soft computing analysis of data
The Principal Component Analysis (PCA) methodology was applied to display data. PCA is a mathematical procedure aimed to scale the data in a three-dimensional uncorrelated space, in order to display statistical meaningful differences among the original variables.[21]
Data were analyzed with soft computing methodologies. Basic elements of soft computing and the application of intelligent control have been recently introduced.[22] The term soft computing denotes methodologies that seek to integrate arithmetical computing, reasoning and decision making into a framework trading off precision and uncertainty. The methodologies used are fuzzy logic, neural networks (NNs) and genetic algorithms and programming.[23] Soft computing-based models are capable of analyzing complex medical data, exploiting meaningful relationships in a
data set to help physicians in the diagnosis, treatment and prediction of the clinical outcomes. The soft computing-based modelling approach was applied to either or both of flow-volume data and body plethysmography in order to develop a model predictive of chest HRCT scores. The model was identified by means of a self-organizing artificial neural network (ANN). ANNs are mathematical models, which distributed adaptable parameters are modified through a learning process according to real data. ANNs are able to deal with imprecision, uncertainty, partial truth of
the biological knowledge, mimicking the processing capabilities of human mind. Kohonen self-organizing map (KSOM) predictive models were identified to classify chest HRCT
scores, (total lung impairment, severity of bronchiectasis, extent of bronchiectasis, peribronchial thickening, mucous plugging, atelectasis, focal air-trapping), starting from flow-volume parameters (FEV1, FVC, FEV1/FVC, FEF25-75%) and body plethysmography data (RV, TLC, RV/TLC). KSOM
is a two-dimensional ANN-based model able to solve classification tasks exploiting structures in the data through an unsupervised learning process.[24]
Statistical analyses
There are no data in the published literature to inform a power calculation, so the sample size was opportunistic. Baseline variables were expressed as group mean ± SD or as median and interquartile range when the variables were normally distributed. Correlations between continuous non-normally distributed variables were assessed using Spearman's rank correlation test. The chi-squared test was used to evaluate the association between Pseudomonas aeruginosa (alone or with other bacterial infection) and RV > 150%, RV/TLC ratio >140%, and FEV1 < 80% or FEF 25-75 <
70% percent of predicted, respectively. The association between Pseudomonas aeruginosa and FEV1/FVC less than 80% predicted for children and less than 70% predicted for adults was also
evaluated. These cut-offs were selected because they were previously demonstrated to correlate with air-trapping on HRCT in children.[25]
A p-value < 0.05 was considered statistically significant. All statistical calculations were performed using SPSS version 18.0 software for Windows (SPSS, Inc, Chicago, IL) for personal computers.
RESULTS
Fifty patients were studied. Twenty-three had situs inversus, 26 were children (19 males and 7 females, age range: 6 –17 years, median 11 years; IQR 5.25) and 24 adults (9 males and 15 females, age range: 18–47 years, median 30.5 years; IQR 9.5).
Infection with Pseudomonas aeruginosa (with or without other bacteria) was found in 20 (40.0%) patients, 7 of whom were children (27% infected). Other infecting organisms (Serratia marcescens,
Rhodococcus equi, Streptococcus pneumoniae, Staphylococcus aureus, Enterobacter cloacae,
Streptococcus pyogenes, Alcaligenes xylosoxidans) were found in 12 (24.0%) subjects.
FEV1 ranged from 31% to 136% of predicted (mean 85.3; SD 24.6). FVC ranged from 47% to
138% of predicted (mean 93.4; SD 18.5). FEF25-75 ranged from 10% to 151% of predicted (mean
63.2; SD 34.4). RV ranged from 83% to 397% (mean 196.5; SD 69.4). TLC ranged from 85% to 174% (mean 119.2; SD 16.7). RV/TLC ranged from 91% to 305% (mean 161.0; SD 45.6).
HRCT Bhalla score was 0 in 3 subjects, 1 in 12 (Image 1), 2 in 27(Images 2a, 2b, 4, 6), and 3(Images 3a, 3b,5) in the remaining 8 subjects. Bronchiectasis was documented in 44 (88%) patients, 21 of whom were children. Bronchiectasis was present in multiple lobes in 36/44 (82 %) subjects. The distribution of bronchiectasis is detailed in table 1.
Patient age was inversely correlated with percent predicted FEV1 (p=0.006; r=-0.384), FVC
(p=0.04; r=-0.295), FEF25-75% (p=0.01; r=-0.362), and FEV1/FVC (p=0.02 r=-0.336) but surprisingly
not with RV and RV/TLC.
There was a significant correlation between infection with Pseudomonas aeruginosa and extent of bronchiectasis (p=0.009, r=0.367) and air-trapping (p=0.03 r=0.315). Moreover, there was a significant association between infection with Pseudomonas aeruginosa and RV values > 150% (p=0.04) and RV/TLC ratio >140% (p=0.001), but not between infection with Pseudomonas
aeruginosa and FEV1<80%, or FEF25-75% <70%, or FEV1/FVC < 70% (<80% in children).
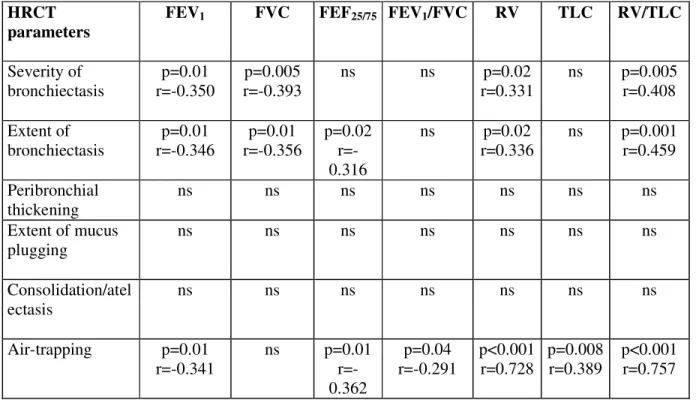
There were significant correlations between HRCT scores and physiological parameters. In particular, severity of the total lung impairment on chest HRCT inversely correlated with FEV1
(p= 0.02; r= -0.322), FVC (p= 0.007; r= -0.376), but not with FEF 25-75 or FEV1/FVC, and directly
correlated with RV (p= 0.003; r=0.423) (Fig. 1), and RV/TLC (p < 0.001; r= 0.513) (Fig. 2), but not with TLC. Among HRCT parameters, severity and extent of bronchiectasis and air-trapping were inversely correlated with spirometry and positively correlated with plethysmography indexes (shown in detail in Table 2)
Moreover, there was a direct correlation between the age of the patients and total lung impairment on chest HRCT (p=0.002; r=0.425), as well as severity (p=0.004; r=0.404) and extent of bronchiectasis (p<0.001; r=0.510), but not with focal air-trapping scores or other parameters. PCA performed using the body plethysmography data is depicted in Figure 3, which shows three dimensional scatter plots of the first three principal components corresponding to the body plethysmography variables (RV, TLC, and RV/TLC ratio), after the removal of an outlier. Each scatter plot shows the differences between scores 1 and 3 for focal air-trapping (Fig 3a), atelectasis (Fig 3b), extent of bronchiectasis (Fig 3c), and total lung impairment (Fig. 3d) respectively. The PCA topological study allows focal air-trapping severity, atelectasis and the extent of bronchiectasis to be visually discriminated, although the clusters overlap. The analysis does not allow severity of bronchiectasis, peribronchial thickening and mucous plugging to be discriminated. The PCA topological study of flow-volume data does not permit any discrimination of chest HRCT scores. The PCA topological study does not identify patients with Pseudomonas aeruginosa infection.
DISCUSSION
Statement of principal findings
To our knowledge this is the largest dataset of contemporaneous spirometry, plethysmography and HRCT in patients with PCD to date. HRCT was performed in all patients aged six years or older because it is known that from this age a many patients already have some degree of bronchiectasis [26] and, furthermore, from this age patients can both cooperate with the procedure and be able to perform reproducible lung function testing.[27]
We show that soft computing modelling based on plethysmography, but not spirometry, is sensitive to a range of HRCT abnormalities. Reduction in lung function associated with bronchiectasis has been previously reported both in cross-sectional and longitudinal studies [11, 28] in patients with PCD. However, we report for the first time that RV and RV/TLC ratio is associated with the severity of air trapping, atelectasis, and extent of bronchiectasis and with Pseudomonas aeruginosa infection. Hence follow-up of PCD patients may be preferable with plethysmography rather than simple spirometry.
Strengths and weaknesses of the study Our study has a number of strengths. First the completeness of ascertainment, since all patients performed all the tests, obviating selection bias. Second all the evaluations were done within 48 hours. Third the objective analytical techniques using soft computing and objective mathematical analyses greatly reduces the chance of investigator bias. We accept that the study would have been stronger with longitudinal data and a second cohort on which to validate our findings.
Strengths and weaknesses in relation to other studies
In our study group the vast majority of adults and 80% of the children had bronchiectasis and, as previously reported, half of the adults [28] and approximately one third of the children had chronic Pseudomonas aeruginosa infection. The later was associated with air-trapping, as previously documented in young children with cystic fibrosis.[29] Focal air-trapping, which indicates small airways disease, probably starts early and our results documents that static lung volume evaluation can detect this even in younger patients. This finding lends further support to the hypothesis that peripheral lung damage may be an early event in PCD.[10]
It has been recently suggested that even the youngest patients already have irreversible lung damage [11] and that bronchiectasis, reduction in lung flows and increased RV and RV/TLC can be present in PCD patients as young as less than 3 years.[30] We were not able to determine this, because we could not study very young children with PCD.
Meaning of the study
Our findings suggest that lung disease in PCD begins early and that it is better identified at least in school age children and adults by the finding of air-trapping or HRCT, rather than spirometry. In previous studies of adults and children with PCD, HRCT scores were shown to be related to spirometry.[3, 4] Our results do not confirm this but suggest that plethysmography is a much more sensitive test.
CT scanning of the chest has become a popular tool to monitor patients with cystic fibrosis,[31] a disease that has similarities with PCD. However, no study has evaluated the impact of such monitoring on health outcomes or on clinical decision making in either PCD or indeed cystic fibrosis patients. Moreover, there are concerns on the uncritical use of high-tech medical imaging and on the potential harm of repeated radiologic exposures particularly in children with life-long diseases.[6, 7] Consequently, careful thought is needed before requesting repeated chest CT scans.
By contrast a detailed evaluation of lung volumes is only limited by the availability of the equipment, and this is usually not a problem in centres that care for these patients.
Unanswered questions and future research Even though we have not studied very young subjects, from our results it is tempting to speculate that accumulation of secretions, in the early stages of disease, may induces primarily an obstruction in terminal bronchioles which may go undetected for a long period during the period of alveolar growth of the lung. The consequent focal air-trapping during this phase of alveolar growth might lead to impaired septation, and decreased elastic recoil as has been observed in animal models.[32] If there were early structural changes in the distal part of the lung, this could explain why we found a lack of correlation between RV and RV/TLC with age, unlike for spiromery which may reflect a slower progressive damage to large airways with age. This hypothesis could only be proved in a longitudinal study in PCD patients from the newborn period, using age appropriate physiological techniques.
Although our findings show the superior sensitivity of plethysmography over spirometry in detecting HRCT changes in PCD, the findings need to be validated in a second cohort of patients. It would be valuable to compare plethysmography with sophisticated assessments of distal airway function such as lung clearance index.[33] Longitudinal data are needed to determine which technique is more sensitive to a change in the patient’s condition. Finally, comparisons of plethysmography and spirometry in other airway diseases would be of interest.
In conclusion, in this group who have a high pre-test probability of lung damage,[26] and given the different correlations between the various lung function parameters and HRCT derived lung disease scores we suggest that measurement of lung volumes rather than spirometry may be preferable in
the routine clinical management of PCD. Furthermore, this may reduce the number of scans used to monitor disease progression, although this needs testing prospectively. As with all investigations, HRCT should be requested only when the results are going to change the therapeutic strategy in the individual patient, or as part of an ethically approved, focused research protocol.[8]
Figure legends
[*] : Modified Bhalla system
Figure 1: Correlation between Residual Volume (RV) % predicted and total lung impairment severity score at chest high resolution computed tomography (HRCT)
Figure 2: Correlation between Residual Volume (RV) and Total Lung Capacity (TLC) ratio (% predicted) and total lung impairment severity score at chest high resolution computed tomography (HRCT).
Figure 3a: Three dimensional scatter plots for air-trapping score 1 (triangles), 2 (circles), 3 (squares) in relationship with RV, TLC and RV/TLC ratio.
Figure 3b: Three dimensional scatter plots for atelectasis score 1 (triangles), 2 (circles), 3 (squares) in relationship with RV, TLC and RV/TLC ratio.
Figure 3c: Three dimensional scatter plots for bronchiectasis extension score 1 (triangles), 2 (circles), 3 (squares) in relationship with RV, TLC and RV/TLC ratio.
Figure 3d: Three dimensional scatter plots for total lung impairment score 1 (triangles), 2 (circles), 3 (squares) in relationship with RV, TLC and RV/TLC ratio.
REFERENCES
1. Bush A, Chodhari R, Collins N, et al. Primary ciliary dyskinesia: current state of the art. Arch Dis Child 2007;92:1136–1140.
2. Rossi UG, Owens CM. The radiology of chronic lung disease in children. Arch Dis Child 2005;90:601-7.
3. Kennedy MP, Noone PG, Leigh MW, et al. High-resolution CT of patients with primary ciliary dyskinesia. AJR Am J Roentgenol 2007;188:1232-8.
4. Santamaria F, Montella S, Tiddens HA, et al. Structural and functional lung disease in primary ciliary dyskinesia. Chest 2008;134:351-7.
5. Barbato A, Frischer T, Kuehni CE, et al. Primary ciliary dyskinesia: a consensus statement on diagnostic and treatment approaches in children. Eur Respir J 2009;34:1264-76.
6. Brody AS, Frush DP, Huda W, et al. Radiation risk to children from computed tomography. Pediatrics 2007;120:677-82.
7. Brenner DJ, Hall EJ. Computed tomography – an increasing source of radiation exposure. N Engl J Med 2007;357:2277-84.
8. Fauroux B, Tamalet A, Clément A. Management of primary ciliary dyskinesia: the lower airways. Paediatr Respir Rev 2009;10:55-7.
9. Stănescu D. Small airways obstruction syndrome. Chest 1999;116:231-3.
10. Tiddens HA, Donaldson SH, Rosenfeld M, et al. Cystic fibrosis lung disease starts in the small airways: can we treat it more effectively? Pediatr Pulmonol 2010;45:107-17.
11. Marthin JK, Petersen N, Skovgaard LT, et al. Lung function in patients with primary ciliary dyskinesia: a cross-sectional and 3-decade longitudinal study. Am J Respir Crit Care Med 2010;181:1262-8.
and study of ultrastructure. Lancet. 1980;2:564-5.
13. Pifferi M, Cangiotti AM, Ragazzo V, et al. Primary ciliary dyskinesia: diagnosis in children with inconclusive ultrastructural evaluation. Pediatr Allergy Immunol 2001;12:274-82. 14. Carlén B, Stenram U. Ultrastructural diagnosis in the immotile cilia syndrome. Ultrastruct
Pathol 1987;11:653-8.
15. Pifferi M, Montemurro F, Cangiotti AM, et al. Simplified cell culture method for the diagnosis of atypical primary ciliary dyskinesia. Thorax 2009;64:1077-81.
16. American Thoracic Society. Standardization of spirometry: 1994 update. Am J Respir Crit Care Med 1995;152:1107–36.
17. American Association for Respiratory Care. Clinical Practice Guideline: Static lung volumes: 2001 revision & update. Respir Care 2001;46:531-9.
18. Zapletal A, Samánek M, Paul T. Lung function in children and adolescents: methods, reference values. Basel, Switzerland: S Karger AG 1987.
19. Bhalla M, Turcios N, Aponte V, et al. Cystic fibrosis: scoring system with thin-section CT. Radiology 1991;179:783-8.
20. Pifferi M, Caramella D, Bulleri A, et al. Pediatric bronchiectasis: correlation of HRCT, ventilation and perfusion scintigraphy, and pulmonary function testing. Pediatr Pulmonol 2004;38:298-303.
21. Shaw PJA, Multivariate statistics for the Environmental Sciences, London, UK: Hodder Arnold 2003.
22. Jamshidi M. Tools for intelligent control: fuzzy controllers, neural networks and genetic algorithms. Philos Transact A Math Phys Eng Sci 2003;361:1781-808.
23. Zadeh LA. The evolution of systems analysis and control: a personal perspective. IEEE Control Syst 1996;16: 95–8.
24. Honkela, T. Self-Organizing Maps in Natural Language Processing. Thesis for the degree of Doctor of Philosophy Espoo, Finland 1997. http://users.ics.tkk.fi/tho/thesis/ (accessed 12 October 2010)
25. Pifferi M, Caramella D, Ragazzo V, et al. Low-density areas on high-resolution computed tomograms in chronic pediatric asthma. J Pediatr 2002;141:104-8.
26. Jain K, Padley SP, Goldstraw EJ, et al. Primary ciliary dyskinesia in the paediatric population: range and severity of radiological findings in a cohort of patients receiving tertiary care. Clin Radiol 2007;62:986-93.
27. Davis SD, Brody AS, Emond MJ, et al. Endpoints for clinical trials in young children with cystic fibrosis. Proc Am Thorac Soc 2007;4:418-30.
28. Noone PG, Leigh MW, Sannuti A, et al. Primary ciliary dyskinesia: diagnostic and phenotypic features. Am J Respir Crit Care Med 2004;169:459–67.
29. Dakin CJ, Numa AH, Wang H, et al. Inflammation, infection, and pulmonary function in infants and young children with cystic fibrosis. Am J Respir Crit Care Med 2002;165:904-10.
30. Brown DE, Pittman JE, Leigh MW, et al. Early lung disease in young children with primary ciliary dyskinesia. Pediatr Pulmonol 2008;43:514–6.
31. Robinson TE. Computed tomography scanning techniques for the evaluation of cystic fibrosis lung disease. Proc Am Thorac Soc 2007;4:310-5.
32. Srinivasan G, Bruce EN, Houtz PK, et al. Dexamethasone-induced changes in lung function are not prevented by concomitant treatment with retinoic acid. Am J Physiol Lung Cell Mol Physiol 2002;283:L275-87.
33. Gustafsson PM, de Jong PA, Tiddens HAWM, et al. Multiple-breath inert gas washout and spirometry versus structural lung disease in cystic fibrosis.Thorax 2008;63:129–34.
Lobes
Right
Left
Upper
20
25
Middle
45
11.4*
Lower
84
70
Lingula
6.8 *
16
Tab. 1 Bronchiectasis distribution (%) in multiple lobes * in patients with situs inversus
HRCT parameters
FEV1 FVC FEF25/75 FEV1/FVC RV TLC RV/TLC
Severity of bronchiectasis p=0.01 r=-0.350 p=0.005 r=-0.393 ns ns p=0.02 r=0.331 ns p=0.005 r=0.408 Extent of bronchiectasis p=0.01 r=-0.346 p=0.01 r=-0.356 p=0.02 r=-0.316 ns p=0.02 r=0.336 ns p=0.001 r=0.459 Peribronchial thickening ns ns ns ns ns ns ns Extent of mucus plugging ns ns ns ns ns ns ns Consolidation/atel ectasis ns ns ns ns ns ns ns Air-trapping p=0.01 r=-0.341 ns p=0.01 r=-0.362 p=0.04 r=-0.291 p<0.001 r=0.728 p=0.008 r=0.389 p<0.001 r=0.757
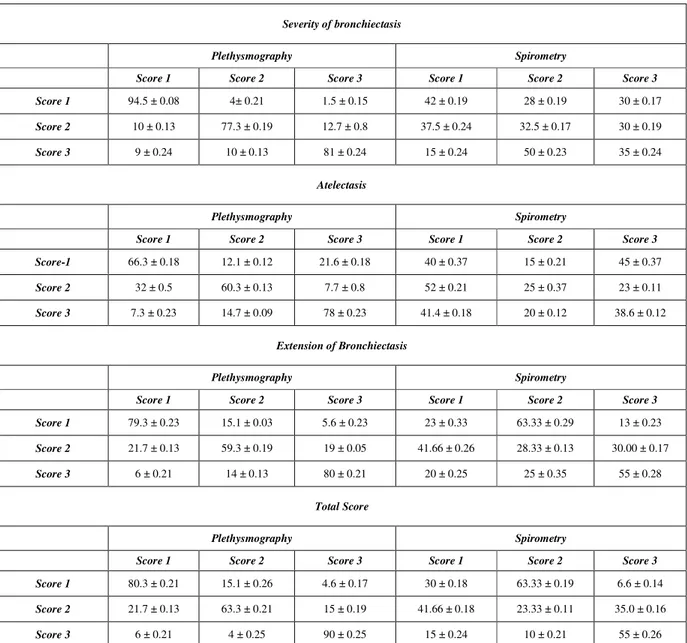
Table 1. Models based on body plethysmography or spirometry variables and correct recognition (expressed as mean ± standard deviation) of focal air-trapping and atelectasis severity, extension of bronchiectasis, and total lung impairment on chest HRCT, respectively.
Severity of bronchiectasis
Plethysmography Spirometry
Score 1 Score 2 Score 3 Score 1 Score 2 Score 3
Score 1 94.5 ± 0.08 4± 0.21 1.5 ± 0.15 42 ± 0.19 28 ± 0.19 30 ± 0.17
Score 2 10 ± 0.13 77.3 ± 0.19 12.7 ± 0.8 37.5 ± 0.24 32.5 ± 0.17 30 ± 0.19
Score 3 9 ± 0.24 10 ± 0.13 81 ± 0.24 15 ± 0.24 50 ± 0.23 35 ± 0.24
Atelectasis
Plethysmography Spirometry
Score 1 Score 2 Score 3 Score 1 Score 2 Score 3
Score-1 66.3 ± 0.18 12.1 ± 0.12 21.6 ± 0.18 40 ± 0.37 15 ± 0.21 45 ± 0.37
Score 2 32 ± 0.5 60.3 ± 0.13 7.7 ± 0.8 52 ± 0.21 25 ± 0.37 23 ± 0.11
Score 3 7.3 ± 0.23 14.7 ± 0.09 78 ± 0.23 41.4 ± 0.18 20 ± 0.12 38.6 ± 0.12
Extension of Bronchiectasis
Plethysmography Spirometry
Score 1 Score 2 Score 3 Score 1 Score 2 Score 3
Score 1 79.3 ± 0.23 15.1 ± 0.03 5.6 ± 0.23 23 ± 0.33 63.33 ± 0.29 13 ± 0.23
Score 2 21.7 ± 0.13 59.3 ± 0.19 19 ± 0.05 41.66 ± 0.26 28.33 ± 0.13 30.00 ± 0.17
Score 3 6 ± 0.21 14 ± 0.13 80 ± 0.21 20 ± 0.25 25 ± 0.35 55 ± 0.28
Total Score
Plethysmography Spirometry
Score 1 Score 2 Score 3 Score 1 Score 2 Score 3
Score 1 80.3 ± 0.21 15.1 ± 0.26 4.6 ± 0.17 30 ± 0.18 63.33 ± 0.19 6.6 ± 0.14
Score 2 21.7 ± 0.13 63.3 ± 0.21 15 ± 0.19 41.66 ± 0.18 23.33 ± 0.11 35.0 ± 0.16
Image 1: score 1 severity of bronchiectasis
Image 2b: score 2 severity of bronchiectasis
Image 3b: score 3 severity of bronchiectasis