1
PhD Program in
Biotechnologies for Human Health
Physicochemical and biological characterization of
magnetic nanoparticles for biomedical applications
Candidate: Enrico Catalano
Tutor: Prof.ssa Lia Rimondini
PhD coordinator: Prof. Claudio Santoro
2014-2015
Cycle XXVII
2
Table of contents
Preface
pag. 4Chapter 1.
Introduction1. Different types of nanoparticles pag. 4 1.1 Organic nanoparticles pag. 4 1.2 Inorganic nanoparticles pag. 6 1.3 Methods of production of iron-oxide nanoparticles pag. 9 1.4 Biomedical applications of magnetic nanoparticles pag. 9 1.5 Cytocompatibility of nanoparticles pag. 10 1.6 Drug targeting pag. 10 1.7 Biosensor technologies pag. 11 1.8 Hyperthermia pag. 11 1.9 Magnetofection pag. 12 1.10 Tissue Engineering pag. 12
1.11 PhD thesis overview
pag. 13Chapter 2.
Characterization of Mag and Mag-SiO2 nanoparticles synthesized viaco-precipitation method
2.1 Aim pag. 14 2.2 Materials and Methods pag. 14 2.3 Results pag. 19 2.4 Discussion pag. 33
Chapter 3.
Biological characterization of magnetic nanoparticles synthesized via co-precipitation methods using citrate acid as dispersant3.1 Aim pag. 35 3.2 Materials and Methods pag. 35 3.3 Results pag. 41 3.4 Discussion pag. 65 3.5 Conclusion pag. 66
3
Chapter 4.
In vitro and in vivo biological characterization of third synthesis of magnetic nanoparticles obtained via co-precipitation methods using citrate acid as dispersant4.1 Aim pag. 67 4.2 Materials and Methods pag. 68 4.3 Results pag. 77 4.4 Discussion pag. 115 4.5 Conclusion pag. 116
5. Concluding remarks
pag. 117Acknowledgments
pag. 1174
Preface
Nanomaterials are defined as the production of matter with at least one dimension ranging between 1 and 100 nanometers. Due to the very small size and the resulting high surface/volume ratio, nanomaterials have physical-chemical properties that differ from those of macroscopic materials. Nowdays nanomaterials are often applied in many industrial fields including electronics, optics, textile and many others till to biomedicine [1].
The use of nanoparticles (NPs) in medicine has expanded recently, especially in diagnostic [2]. Actually nanoparticles could be designed as contrast agents or nanocarriers able to bind, specifically transport biomolecules and accumulate to the site to treat.
Chapter 1 Introduction
1. Different types of nanoparticles
Different types of NPs are most used in the medical field. The nanoparticles can be classified into two main groups: organic and inorganic nanoparticles.
1.1 Organic nanoparticles
Organic nanoparticles can be defined as particles composed of organic compounds, mainly lipids or polymers [3]. They are often designed as liposomes, conjugated polymers, micelles, polymeric NPs, dendrimers, or carbon nanotubes. Sometimes they are derived from virus capsides. They are used as colloids to carry drugs or genes, to coat materials or as templates in various manufacturing processes [3]. The most common nanoparticles of organic origin used as drug delivering carriers are liposomes, micelles and polymer conjugates.
1.1.1 Liposomes
Liposomes are lipid vesicles of spherical shape, consisting of a double membrane structure composed of amphiphilic lipid molecules, with an average diameter between 50 and 500 nm [4].
5 Their structure is characterized by an external phospholipid bilayer and an aqueous phase core which contain hydrophilic substances [4].
1.1.2 Micelles
Micelles are nanoparticles formed by supramolecular self-assembly of surfactants and lipids [5]. The assembly principle of micelles formation is the hydrophobicity of the amphiphilic molecules in water, generating colloidal aggregates of these molecules. In general, micelles are colloidal particles formed by detergents and soaps [6]. Micelle formation needs to be started to have a minimum concentration of surfactant. In the initial formation phase, micelles show spherical shapes and their dimensions increase with the addition of more amount of surfactant [7].
1.1.3 Polymer conjugates
Polymer conjugates are hydrophilic hybrid structures consisting of polymer chains covalently bound to a drug or a protein. Polymer conjugates correspond to drug molecules or bioactive molecules that can be linked to a macromolecule through a spacer molecule, which can incorporate a breaking point to allow the release of the drug at the target site [8]. A high percentage of the applications of polymer conjugates are in the therapeutic and nanomedical field [9].
1.1.4 Dendrimers
Dendrimers are repetitively highly branched, star-shaped monodispersed macromolecules with nanometer-scale dimensions that emanate radially from a central core [10]. Dendrimers are defined by three components: a central core, an interior dendritic structure (the branches), and an exterior surface with functional surface groups [10]. In the biomedical area, dendrimers had been used for in vitro diagnosis, as contrast agents in magnetic resonance imaging when conjugated with other molecules, as drug delivery systems, in gene therapy as vectors to transfer genes through the cell membrane, and in regenerative medicine [11-16].
6
1.1.5 Polymeric Nanoparticles
Polymeric nanoparticles are by far the most studied organic particles. Polymeric NPs, also known as polymeric nanospheres, are usually defined as submicron-sized solid polymer particles with matrix type structure, in which a cargo can be encapsulated within the polymer matrix or absorbed in the surface [17]. Polythiophenes, polyfluorenes, poly(p-phenylenevinylene)s, and poly(p-phenyleneethynylene)s derivatives are polymeric NPs that can be used for electro-optical and photoluminescence applications [18, 19].
1.2 Inorganic nanoparticles
This category include nanoparticles with different chemical origin whose composition are not based only on C, O N, and H chemistry. The nanoparticles of metallic origin are excellent candidates both in the diagnostic field, as contrast agents in MRI (Magnetic resonance imaging), and therapeutically, such as for drug delivery.
1.2.1 Gold nanoparticles
Gold nanoparticles (GNPs) are inorganic NPs that could be used as a promising tool for different biological applications thanks to their size- and shape-dependent physical properties. GNPs are pretty inert, mostly biocompatible, and almost easy to be functionalized and synthesized [20, 21]. GNPs are used due to their unique optical-electronics properties in high technology applications such as organic photovoltaics, sensory probes, therapeutic agents, drug delivery, electronic conductors and catalysis. The optical and electronic properties of gold nanoparticles are tunable by changing the size, shape, surface chemistry, or aggregation state [22]. In fact, the size of spherical gold nanoparticles (AuNPs) influences their ability to enhance the response of optical sensors based on surface plasmon resonance (SPR) [23]. Thus, GNPs are a very promising candidate for biological imaging techniques.
1.2.2 Quantum dots
Quantum dots (QDs) are colloidal nanometre-sized crystals of semiconductor materials that are small enough to exhibit quantum mechanical properties [24]. The electronic properties of QDs are intermediate between those of bulk semiconductors and discrete molecules [25]. Smaller quantum dots (2 nm) present blue fluorescence emission (380-440 nm), while larger particles (5 nm) have red
7 fluorescence emission (605-630 nm) [26]. QDs have many advantages in respect with the most common organic dye molecules. QDs are robust and stable light emitters thanks to their inorganic makeup and are not so susceptible to photobleaching than organic dye molecules. This photostability makes very useful in observing cells for a long period of time [26, 27]. Different surface modifications of QDs were achieved to visualize labelling of whole cells and tissue sections [28, 29]. Quantum dots can be employed such as delivery and reporter systems in transfection therapies in vivo.
1.2.3 Magnetic nanomaterials
Magnetic materials include various materials and are classified according to their chemical origin, crystallographic configuration and magnetic properties. Magnetic nanoparticles (MNPs), consisting of magnetic elements (iron, cobalt, nickel oxides), are of great interest, particularly in biomedicine fields. The use of iron oxide nanoparticles in biomedical research is progressively gaining a lot of importance, with the purpose to develop new types of functionalized and biocompatible magnetic nanoparticles. Different types of iron-oxide nanoparticles can be produced, such as hematite (α-Fe2O3), maghemite (γ-Fe2O3) and magnetite (Fe3O4), among which the latter could be very
interesting for different biomedical applications [30].
Susceptibility to magnetic fields is a criterion to classify magnetic materials into diamagnetic materials which have a weak repulsion from an external magnetic field corresponding to a negative susceptibility, paramagnetic materials showing small and positive susceptibility, and ferromagnetic materials which have a large and positive susceptibility to magnetic fields [31].
Superparamagnetism of iron oxide particles is a prerequisite to MNP use, as well as an underlying reason for its limitations. Superparamagnetism gives the possibility to magnetize the nanoparticles by an external magnetic field. This property is highly useful especially in biomedicine [32]. The limit volume to have superparamagnetic nanoparticles at a certain temperature is related to the magnetocrystalline anisotropy. Iron-oxide nanoparticles have superparamagnetic properties although they have larger dimensions compared to any other magnetic metal [32]. Magnetic nanoparticles have the unique ability that can be directed under the influence of an external magnetic field. Each magnetic particle can be considered similar to a single magnetic domain that shows superparamagnetic behavior when its size is below 10-20 nm and when the temperature is
8 above the so-called blocking temperature [33]. An important property of iron-oxide nanoparticles is the loss of their magnetization when the magnetic field is switched off.
1.2.4 Cobal ferrite
Cobalt ferrite nanoparticles are used in hyperthermia treatment, since in nanosized state, cobalt magnetic moment relaxes much slower than in magnetite or maghemite nanoparticles with similar size [34, 35]. Cobalt ferrite (CoFe2O4) is a hard magnetic material with multiple properties: large
magnetic anisotropy, high coercivity, high Curie temperature, large magnetostrictive coefficient, moderate saturation magnetization with good mechanical hardness and chemical stability [36, 37]. Moreover the saturation magnetization of cobalt ferrite is almost the same as magnetite but its crystalline anisotropy is one order of magnitude larger, making it suitable for hyperthermia treatment [38].
1.2.5 Manganese ferrite
The MnFe2O4 has a structure with excellent properties such as high resistivity, high saturation
magnetization, high initial permeability compared to the other ferrites [39]. The magnetic susceptibility of MnFe2O4 nanoparticles is higher respect to other ferrite nanoparticles such as
Fe3O4, CoFe2O4 and NiFe2O4 [40]. MnFe2O4 nanoparticles could be used as novel MRI contrast
agents [41]. MnFe2O4 MNPs have a greater biocompatibility and a strong phase contrast for
magnetic resonance imaging in comparison with Fe3O4, γ-Fe2O3, CoFe2O4, and NiFe2O4 MNPs.
Thus, MnFe2O4 MNPs can provide the multiple functionalities of imaging, hyperthermia and
triggered drug release [42].
1.2.6 Zinc doped ferrites
Zinc oxide is commonly used as additive in ferrites. It can improve the properties and drive the medical applications of ferrite-based nanoparticles [43, 44]. Zinc oxide increases the saturation of magnetization in small amounts [45].
9
1.3 Methods of production of iron-oxide nanoparticles
The most common synthesis strategies for the preparation of iron-oxide nanoparticles are:
1) Wet chemical preparation methods, such as sol-gel synthesis, oxidation method, chemical co-precipitation, hydrothermal reactions, flow injection synthesis, electrochemical method, aerosol/vaporphase method, sonochemical decomposition reactions, supercritical fluid method, and synthesis using nanoreactors [46-48].
2) Physical methods, such as gas-phase deposition and electron beam lithography. These methods, however, do not allow to control the particle sizes down to the nanometer scale [49, 50].
3) Microbial methods, these methods allow efficient and effective control on the composition and the particle geometry of the resulting material [51]. Diverse microorganisms belonging to prokaryotes are able to synthesize iron-oxide nanoparticles, e.g. Clostridium acetobutylicum [52, 53]. The synthesis of nanoparticles may be intracellular or extracellular. The size and shape of the nanoparticles vary with the organism employed and conditions employed during the synthesis which included pH, temperature and substrate concentration [52].
1.4 Biomedical applications of magnetic nanoparticles
Magnetic nanoparticles can be used for a variety of biomedical applications: 1) Transport and pharmacological release of drugs on specific sites, drug targeting; 2) Gene delivery systems; 3) Hyperthermia; 4) Tissue engineering and repair; 5) Diagnosis by Magnetic resonance imaging (MRI); 6) MRI-guided therapeutic cell replacement; 7) Theranostics; 8) Biochemical separations; 9) Immunoassay platforms; 10) Bioanalysis; 11) Magnetofection for target cancer gene therapy [54-57].
Magnetic nanoparticles could play a key-role in the treatment of tumors, using two different approaches: 1) targeted drug delivery in the cancer site and 2) cancer magnetic induction hyperthermia in which an alternating magnetic field is used to heat up magnetic nanomaterials and hereby destroy targeted cancer cells [58-60].
In this regard, iron-oxide nanoparticles with magnetic properties are one of the most suitable devices to achieve biomedical applications listed above.
10
1.5 Cytocompatibility of nanoparticles
The safety of nanoparticles (NPs) in biomedical applications is a controversial issue. In the last years, the interest in nanotoxicology has increased and more studies regarding the cytotoxic properties of NPs have emerged [61-65]. The assessment of NP safety is related to a great variety of factors: (1) types of NPs, (2) stabilizing coating agents, (3) physicochemical parameters of the NPs, (4) incubation conditions (time and concentration), (5) type of cells used, (6) type of assay used [61-68]. Surface coatings and particle size play a key-role for NPs-induced toxic effects, as they influence cellular responses, intensity of effects, and potential mechanisms of toxicity [65]. Numerous studies have demonstrated different toxic effects associated with exposure to nanomaterials, including mitochondrial damage, oxidative stress, chromosomal and oxidative DNA damage and altered cell cycle regulation [69-73]. Contact of the NPs with the cells may further affect the morphology, cytoskeleton, proliferation, differentiation, migration, and survival [64].
1.6 Drug targeting
The design of nanocarriers for drug delivery with selectivity to disease and anatomical sites has a great potential. For instance nanoparticle-conjugated drug and gene delivery systems could be used to treat neurological diseases using MNP-conjugated drugs to cross the blood-brain barrier [74, 75]. Nanotechnology for drug delivery can be used to achieve (1) site-specific delivery of drugs in tissue and organs; (2) improved delivery of poorly water-soluble drugs; (3) transcytosis of drugs across tight epithelial and endothelial barriers; (4) co-delivery of two or more drugs for combination therapy; (5) theranostic application of drug delivery by combining therapeutic agents with imaging modalities [76, 77]. The basic principles of magnetic targeting of MNP-conjugated drugs have been investigated experimentally. The surface hydrophilicity of MNPs plays a key-role for drug delivery. Targeted therapy using MNPs assembled with drugs was already tested in clinical trials as a cancer therapy [60]. Various studies investigated the biodistribution of MNPs through intravenous injection directed by an external magnetic field to concentrate MNPs at a specific target site; this procedure has been well tolerated in cancer patients [59, 60].
11
1.6.1 Passive and Active Drug Targeting
There are two kinds of targeted drug delivery of nanocarriers: 1) active targeted drug delivery, that overcome the limitations of passive targeting by conjugation with affinity ligands (antibodies, peptides, aptamers, etc.) that recognize and bind to specific receptors on the target cell surface [78]; and 2) passive targeted drug delivery, such as the enhanced permeability and retention effect (EPR-effect) that allows migration of molecules up to 50-100 nm in diameter into the target site [79]. In fact drug carriers are expected to stay in the blood for long time, accumulate in pathological sites with affected and leaky vasculature (tumors, inflammations, and infarcted areas) via the enhanced permeability and retention (EPR) effect, and facilitate targeted delivery of specific ligand-modified drugs and drug carriers into poorly accessible areas [80]. The active drug targeting increases the selectivity of the delivery of drugs [79]. Passive and active drug targeting with nanocarriers to disease or tumor site reduce toxic side-effects, increase efficacy, and enhance delivery of poorly soluble or sensitive therapeutic molecules [79].
1.7 Biosensor technologies
A widespread application of MNPs is cell sorting, sometime streptavidin-coated magnetic beads for phenotypic selection of different cell types, including stem cells [81], lymphocytes, neuronal cells, etc [82, 83]. MNPs linked to monoclonal antibodies, could be used to purify blood from infective agents [84]. Moreover, MNP-based magnetic bioseparation could be applied for biosensor technologies (e.g detection of protein analytes using specific MNP-conjugated antibodies) [85].
1.8 Hyperthermia
Hyperthermia is a very promising therapy for cancer that concentrates a localized heating above 43 °C for about 30 min in the site of tumors [86]. Hyperthermia initiates a series of subcellular events in the tumor site, inducing various forms of damage including apoptosis, leading to subsequent cell death [87, 88]. Moreover, hyperthermia induce other effects in the tumor site such as enhancement of tumor blood flow, activation of immunological responses and oxygenation via greater vascular perfusion and permeability, and a shift toward anaerobic metabolism, all leading to an altered extracellular microenvironment [89]. MNPs are able to induce heat in the specific site of tumor under the influence of alternating magnetic fields due to energy reductions in the traversing of the
12 magnetic hysteresis loop [32]. Induction of heat is related to the magnetization properties of different types of MNPs and magnetic field parameters [30]. The functionalization of MNPs with silica coatings and other reactive chemical groups could improve the selectivity to tumors [90]. In fact, selectivity of magnetic nanoparticles uptake by tumors during hyperthermia therapy could be improved using MNPs conjugated with antibodies which target tumor-specific antigens or modified receptors [91].
1.9 Magnetofection
Another application of MNPs could be magnetofection to transfect permissive and non-permissive cells using MNPs associated to DNA vectors under external magnetic field influence [92]. In fact with this strategy a great increase in transfection performance for both non-viral and viral vectors was demonstrated [93].
1.10 Tissue Engineering
Tissue engineering may have a great benefit by application of magnetic nanomaterials. In fact tissue engineering is useful to overcome the organ transplantation crisis, and thus create artificial organs and tissues [94]. To realize this objective similar architectures of in vivo organs should be replicated
in vitro, in which the cells are allocated precisely. For this purpose, three-dimensional constructs
(scaffolds or hydrogels) functioning similarly as under in vivo conditions should be firstly built up
[95]. To allocate precisely cells into the three dimensional constructs magnetic force-based tissue engineering technique could be useful to provide magneto-responsive features to the cells and to achieve an efficient cell seeding and a controlled tissue assembly and complex tissue formation [96, 97]. The inclusion of magnetic particles has no significant effect on the porosity, stability and wetting properties of the composite scaffolds, making them compatible for cellular support and cultivation [97].
13
1.11 PhD thesis overview
The overall goal of this PhD project was the biological characterization by in vivo and in vitro testing of magnetic nanoparticles that can be used for various applications. In recent years, considerable efforts have been spent to develop magnetic nanoparticles (MNPs) and improve their applicability in several areas [76]. Nanoparticles could open a new arena in the field of biomedicine. In fact, magnetite/maghemite nanoparticles combinations have already been approved for clinical use as MRI contrast agents [98]. Precise control over the synthesis conditions and surface functionalization of MNPs is crucial for their final physicochemical properties, colloidal stability, and biological behaviour/fate [60]. The aim of this work was to understand which of the synthesized magnetic nanoparticles could be more suitable to be used as a carrier or platform for various applications in different scientific fields.
During this PhD program two different kinds of magnetic nanoparticles were developed: naked iron-oxide nanoparticles and silica or silica-based coated nanoparticles (core shell-type nanoparticles). The materials were synthesized at Politecnico di Torino - Laboratory of the Applied Science and Technology Department directed by Prof. Enrica Vernè. During this project three sequential syntheses of magnetic nanoparticles were developed. The concentration of the stock solutions of MNPs changed in the different syntheses of nanoparticles. The technology allowed to produce and gradually improve dispersibility, colloidal stability and biocompatibility of MNPs. Cytocompatibility assessment was performed using both direct and not-direct contact cytotoxicity evaluation with murine endothelial cells (MS1) both in static and dynamic conditions. ROS detection and apoptosis evaluation were also carried out to investigate influence of MNPs on these aspects. Murine endothelial cells were used for two reasons: 1) Endothelial cells are the first cell barrier that come in contact with MNPs intravenously injected; and 2) MS1 cells are involved in the stage of production and expansion of lentiviral vectors (transfection). In fact, MNPs could be used for applications of cancer gene therapy. Due to the formation of cluster of nanoparticles in static conditions, cytocompatibility of MNPs was also evaluated in dynamic conditions of cell culture. In fact, cells were seeded on polycaprolactone strips and cultivated under a continuous medium flow bioreactor to simulate blood stream. Then, in vivo biocompatibility and biodistribution of MNPs for 7 days in mice was investigated after intravenous administration of MNPs via tail vein. Two doses of 2 and 20 mg/kg MNPs were separately given to the mice via tail vein injections. Hematological parameters, changes in serum and tissue iron levels were analyzed after 1 week of MNPs to mice. Experiment term of 7 days was chosen for biodistribution of MNPs. Tissue iron levels were
14 analyzed by ICP-AES and histological Perl’s Prussian Blue Staining. MNPs biodistribution evaluation was important to investigate the nanotoxicological effects of magnetic nanoparticles within tissues and organs. During the different cytocompatibility evaluation two concentrations of MNPs were standardized: 2 and 20 mg/kg body weight. In particular the concentration of 2 mg/kg body weight was found to be biocompatible and then suitable to be used as it is or as a nanocarrier for intravenous administration of drugs.
Chapter 2
Characterization of Mag and Mag-SiO
2nanoparticles synthesized via
co-precipitation method
2.1 Aim
The purpose of this part was to compare and optimize the development, production and cytocompatibility of iron oxide (Fe3O4) nanoparticles respect to the silica coated iron-oxide
nanoparticles (SiO2-Fe3O4). A modified chemical co-precipitation method was used to prepare
naked iron-oxide nanoparticles (Fe3O4), while silica coating was based on wet chemistry (Stöber
method) and condensation of silica precursor tetraethyl orthosilicate (TEOS). The silica shell not only serves to protect nanoparticles from agglomeration but also assists further modifications so increasing their versatility and surface functionalization properties. Moreover it is durable in acid, and useful for the conjugation with biomolecules and for drug delivery.
Silica is known to be one of the most suitable coating layer for superparamagnetic MNPs due to its chemical stability, biocompatibility [99] and versatility for surface modification. Moreover, it helps to convert hydrophobic NPs into hydrophilic water-soluble particles [100]. In addition, silica coating may provide flexibility in the construction of well-defined core-shell nanostructures.
2.2 Materials and methods
2.2.1 Synthesis of nanoparticles
Two different types of magnetic iron-oxide nanoparticles (MNPs) were synthesized: pure magnetite (Mag) and silica-coated magnetite (Mag-SiO2) (Table 1). Magnetite nanoparticles were synthesized
15 a stoichiometric ratio of Fe2+/Fe3+ of 1:2; subsequently NH4OH was added drop by drop under
stirring, up to reach a pH value of about 10. The solution was placed in an ultrasound bath for 20 min. After 24 hours magnetite nanoparticles were washed with bi-distilled water and redispersed always in water.
The Mag-SiO2 nanoparticles were synthesized following the Stöber method [102]: 0,33 ml of
tetraethyl orthosilicate (TEOS), 3 ml of water and 3 ml of ethanol were added to 40 ml of magnetite suspension, the pH of the solution was adjusted at 10 and the suspension was placed in orbital shaker at room temperature for 3 hours at 150 rpm. Then the Mag-SiO2 nanoparticles were washed
with bi-distilled water and redispersed in water. All chemicals were purchased from Sigma Aldrich. The starting concentrations of MNPs were 4.9 mg mL-1 for Mag and 1.4 mg mL-1 for Mag-SiO2.
Before use, the magnetic nanoparticles (Mag and Mag-SiO2) were sterilized by ultra-violet radiation
for 60 minutes.
2.2.2 Nanoparticle characterization
Mag and Mag-SiO2 nanoparticles were characterized by means of transmission electron microscopy
(TEM, Philips CM12, working at 120 kV operating voltage with a LaB6 filament), field emission scanning electron microscopy (FESEM - SUPRATM 40, Zeiss), scanning transmission electron microscopy (STEM-FESEM MERLIN Zeiss.) and energy dispersive spectroscopy (Edax PV9800). Selected area electron diffraction (SAED) patterns were obtained for each sample to observe the morphology and structure.
FESEM micrographs of magnetic nanoparticles were captured using a SUPRATM 40, Zeiss field emission microscope (JEOL, Japan) operated at an excitation voltage of 10 kV. The elemental compositional study was investigated through energy dispersive spectroscopy (EDS) by using EDAX PV 9900 instrument coupled with STEM-FESEM.
A droplet of an aqueous dispersion of nanoparticles was placed on a copper grid for FESEM, TEM and STEM-FESEM sample preparation, allowed to dry, and examined under electron microscopy previously cited.
16
SAMPLE MATERIAL MEDIUM Concentration
of stock solution pH approx Notes Mag Magnetite nanoparticles PBS 4.9 mg/ml 7.70 Not stable in solution
Mag-SiO2 SiO2 coated magnetite
nanoparticles
PBS 1,4 mg/ml 7.22 Not stable in solution
Table 1. Main characteristics of Mag and Mag-SiO2 NPs.
2.2.3 Cell cultures
Endothelial cell lines derived from mouse cells (MS1 - ATCC - CRL 2460) were used to evaluate cytocompatibility of nanoparticles. MS1 cells were cultivated in Dulbecco’s Modified Eagle Medium (DMEM, Sigma Aldrich) additioned with 2 mM L-glutamine, 10% FBS and 1% antibiotics/antimycotics (penicillin/streptomycin/gentamycin, Gibco). Cells were cultured at confluence in a humidified 5% CO2 atmosphere at 37°C. Afterwards murine endothelial cells were
detached using 0.05% trypsin/EDTA solution (Sigma Aldrich) for five minutes.
2.2.4 Not direct contact cytotoxicity evaluation
Not direct contact cytotoxicity evaluation of MNPs was done using leaching solutions. These latter were obtained by adding MNPs to DMEM in a sterile closed tube at the concentration of 0.1 g/mL. Leaching conditions were 37°C for 24 and 72 hours according to ISO standard 10993-12: 1996. Then the specimens were centrifuged at 2500 rpm for 5 minutes and the supernatant was removed by suction and filtered through a microporous filter (0.22 µm) to provide the final eluating solutions. Afterwards, eluates were supplemented with 10% FBS and used to cultivate MS1 cells. Cells were seeded in a defined number (4x10³/well) into 96 wells plates (Cell Star, PBI International, Milan, Italy) and cultivated for three experimental time-points: 24, 48 and 72 hours at 37°C, in humidified 5% CO2 atmosphere. DMEM without any supplementation was used as a
control. At each experimental time cells viability was evaluated by the (3-(4,5-Dimethylthiazol-2-yl)-2,5-diphenyltetrazolium bromide colorimetric assay (MTT, Sigma). Briefly, 100 μl of MTT solution (3mg/ml in PBS) were added to each sample and incubated 4 hours in the dark at 37° C; afterwards, formazan crystals were solved with 100 μl of dimethyl sulphoxyhde (DMSO, Sigma) and 50 μl were collected and centrifuged to remove any debris. Surnatant optical density (o.d.) was
17 evaluated at 570 nm using a spectrophotometer (Spectra Count, Packard Bell, Meriden, CT, USA). The optical density of control sample was considered as 100% viability. Cell viability was calculated as follow: (indirect contact eluate o.d. / control o.d.)*100. Experiments were performed using four replicates at each experimental time. Furthermore, cells morphology was visually investigated at each experimental time by light microscopy (Leica AF 6500, Leica Microsystems) at 20x magnification.
2.2.5 Direct static contact cytotoxicity evaluation
Direct static contact cytotoxicity evaluation of MNPs was done according to ISO standard 10993-5: 2009. The cells were seeded in 24-well plates (1.6 x 10⁴ cells per well) in DMEM medium and cultured for 24 h at 37°C in 5% CO2 atmosphere-controlled incubator. After 24 hours the medium
was substituted with a new one obtained by adding MNPs to DMEM to obtain the following concentrations: 10 μg/ml, 20 μg/ml, 40 μg/ml and 80 μg/ml (w/v).
MS1 endothelial cells cultivated onto polystyrene wells in presence of DMEM additioned with 2 mM L-glutamine, 10% FBS and 1% antibiotics/antimycotics were used as control. Afterwards, cell viability was evaluated after 24, 48 and 72 hours using MTT assay, as above described for the indirect cytocompatibility assay. The viability of controls were considered as 100% viability.
In addition, Trypan blue (TB) exclusion test of cell viability was used to assess the plasma membrane damage. The TB dye passes via the cell membrane of dead cells and thus stains the cells blue. The percentage of dead cells compared to control was determined. Briefly, the cells were seeded onto 24-well plates at a density of 1.6 x 10⁴ cells and cultivated as above described for 24h. After further 24-h, 48-h and 72-h exposure to DMEM additioned with MNPs at the concentrations of 10 μg/ml, 20 μg/ml, 40 μg/ml, 80 μg/ml, the culture medium with nanoparticles was removed and the cells were detached from the plate surface using trypsin/EDTA solution (0.25% trypsin and 0.02% EDTA). Then, DMEM containing 10% FBS (1 ml) was added to each well in order to inactivate trypsin. The cells were stained with TB by mixing equal volumes of the cell suspension and 0.4% TB solution. The experiments were done in triplicate and repeated four time.
2.2.6 Cells morphology evaluation by fluorescent microscopy
Cells morphology after 24, 48 and 72 h in contact with MNPs at the concentrations above described was investigated by fluorescent microscopy (Leica AF 6500, Leica Microsystems, Basel, Switzerland). For the immunofluorescent (IF) staining the following procedure was used: cells were fixed with 4%
18 paraformaldehyde in PBS for 20 minutes at room temperature and then washed 3 times with PBS. Phalloidin (rhodamine B tetramethyl isothiocynate, 1/2000 in PBS, AbCam, Cambridge, UK) solution was added for 45 minutes at room temperature (RT) in order to investigate cells cytoskeleton; afterwards, the specimens were washed for further 3 times with PBS and co-stained with 4',6-diamidino-2-phenylindole (DAPI, Sigma-Aldrich) to dye nuclei. Fluorescence images were acquired with a fluorescent microscope (Leica AF 1500, Leica Instruments).
2.2.7 Reactive oxygen species (ROS) in cells
The production of ROS in cells was measured using CellROX Oxidative Stress Reagents (Life Technologies) as an oxidation-sensitive probe. CellROX Oxidative Stress Reagents are fluorogenic probes designed to reliably measure reactive oxygen species (ROS) in live cells. CellROX Green Reagent is a DNA dye, and upon oxidation, it binds to DNA; thus, its signal is localized primarily in the nucleus and mitochondria. Briefly, 2.5 mM CellROX Green Reagent stock solution was diluted 500-fold with cell culture medium without serum or other additives to prepare a 5 µM working solution. MS1 cells were seeded in 12-well plates (7.5 x 10⁴ cells per well). After exposure to Mag and Mag-SiO2 NPs at the concentrations of 10, 20, 40 and 80 µg/ml for 24 h, the cells were
washed with PBS and incubated in 1 mL of CellROX Green Reagent at a final concentration of 5 μM at 37°C in the dark for 30 min. Experimental time-point (24 h) of ROS production induced by MNPs was chosen according to literature [103, 104]. Menadione (25 µM) was used as a positive control. Then, MS1 cells were analyzed with Flow cytometry (BD FACSCalibur) at an excitation wavelength of 485 nm for CellROX Green Reagent. Statistical data were obtained from the dot plots using CellQuest software (BD Biosciences).
2.2.8 Statistical analyses
All statistical analyses were performed using IBM Statistical Package for Social Sciences v. 20 software (SPSS - IBM). Data were expressed as means ± standard deviations. The results were analyzed using one way analysis of variance (ANOVA) followed by Scheffe’s test, and P values less than 0.05 were considered to be statistically significant.
19
2.3 Results
2.3.1 Nanoparticles: characterization
In Figure 1, TEM images and SAED patterns of Mag and Mag-SiO2 nanoparticles are reported. It
can be observed that both nanoparticles were spherical and the mean diameter was roughly 10-15 nm. Diffraction patterns matched for magnetite [105]. In the case of Mag-SiO2 samples broad halos
can be observed together with the diffraction signals characteristics of magnetite (that resulted a little attenuated), and can be attributed to the amorphous coating.
In Figure 2, FESEM, TEM and STEM images of Mag-SiO2 sample are reported. FESEM confirms
the spherical shape of particles with a diameter of about 10-15 nm. TEM and STEM observation showed the presence of a dense core (magnetite) covered by a less dense shell (silica) with a thickness of 1-2 nm. EDS analyses (spectra not reported for brevity) confirm the presence of iron (Fe) and oxygen (O) in the Mag sample and the appearance of the Si signal for Mag-SiO2 one.
20
Figure 1: TEM Images and SAED patterns of Mag and Mag-SiO2 samples. a) TEM image of Mag, b) SAED
pattern of Mag, c) TEM image of Mag-SiO2, d) SAED pattern of Mag-SiO2. The numbers in SAED patterns
refer to the distances of crystal planes of Mag and Mag-SiO2 NPs according to a defined crystallographic
direction.
Figure 2: FESEM (a), TEM (b) and STEM (c - dark field mode, d - bright field mode) images of Mag-SiO2
NPs.
2.3.2 Not direct contact cytotoxicity
MTT assay demonstrated that the eluate solutions obtained by soaking magnetic nanoparticles in DMEM culture medium for 24 h showed a cell viability in a range of 66-73% and of 77-92% for Mag and Mag-SiO2 nanoparticles respectively (Fig. 3).
21 In a similar way the eluate solutions obtained by soaking MNPs in DMEM for 72 h showed cell viability in a range of 65-72% and of 78-92% for Mag and Mag-SiO2 nanoparticles respectively
(Fig. 3).
Trypan blue assay showed that the leaching solutions obtained from Mag nanoparticles in both soaking conditions showed higher cell mortality in a range of 28-35% (p < 0.05) after three experimental time-points compared to that observed for Mag-SiO2 NPs in a range of 8-23%.
Trypan blue assay validated the results obtained with MTT assay (Tables 2 and 3). The differences were statistically significant (p < 0.05) at 24, 48 and 72 h time-point evaluations. No morphological alterations by microscopic observation were observed when cells cultivated with test media were compared with control ones (Figure 3).
Not direct contact cytotoxicity (37°C for 24 h) Percentage of TB positive MS1 cells
Samples 24 h 48 h 72 h
Mag 26.4 + 1.2* 28.7 + 1.3* 31.1 + 0.9* Mag-SiO2 7.6 + 0.7 16.5 + 0.9** 22.4 + 1.2**
Table 2. Trypan blue exclusion test. MS1 cell mortality after not direct contact with MNPs (37°C for 24 h).
Data are shown as the mean ± standard deviation (n = 4). *P < 0.05 compared with control and Mag-SiO2
nanoparticles. **P < 0.05 compared with control.
Not direct contact cytotoxicity (37°C for 72 h) Percentage of TB positive MS1 cells
Samples 24 h 48 h 72 h
Mag 27.6 + 1.1* 29.1 + 1.4* 32.5 + 1.6* Mag-SiO2 7.9 + 1.0 18.8 + 1.1** 21.9 + 1.3**
Table 3. Trypan blue exclusion test. MS1 cell mortality after not direct contact with MNPs (37°C for 72 h).
Data are shown as the mean ± standard deviation (n = 4).*P < 0.05 compared with control and Mag-SiO2
22
Figure 3. Not direct contact cytotoxicity evaluation of MNPs using murine endothelial cells (MS1 cells) and
different eluates (24 and 72 h of soaking); MTT assay and optical microscopic images. Magnification: 20x, bar scale = 50 µm. Data are shown as the mean ± standard deviation (n = 4). *P < 0.05 compared with control and Mag-SiO2 NPs. **P < 0.05 compared with control.
23
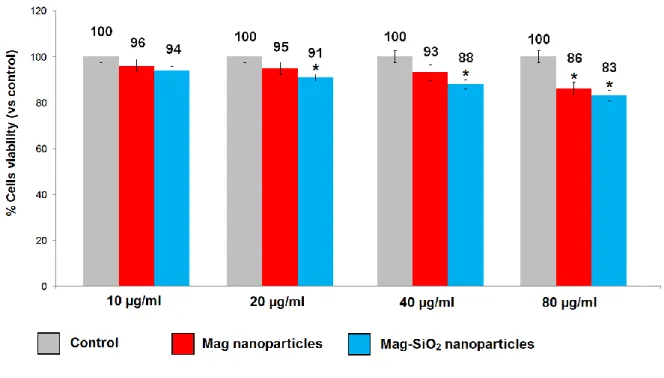
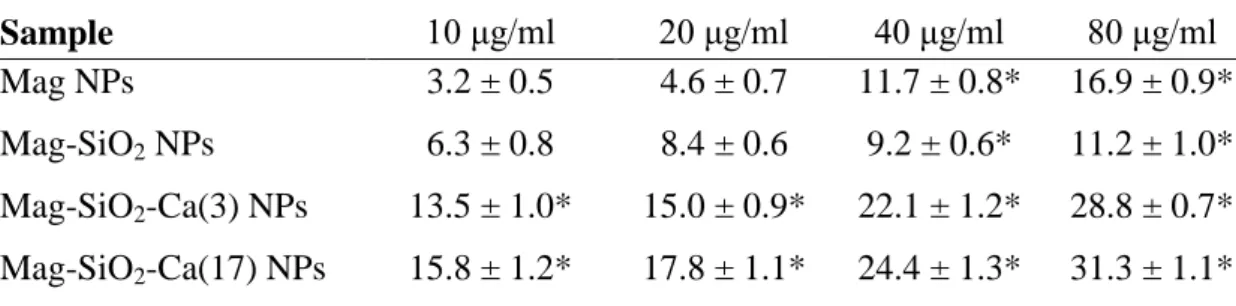
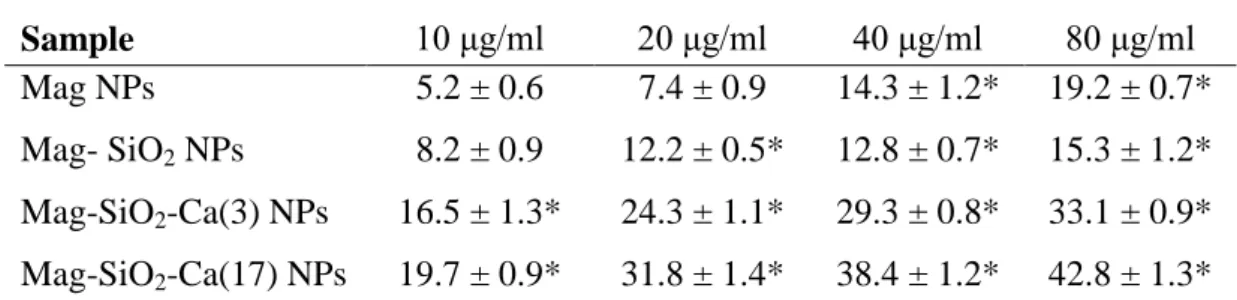
2.3.3 Direct contact cytotoxicity
MS1 endothelial cells showed cell viability similar to that of control when put in direct contact with MNPs at the concentration of 10 µg/ml. Viability slightly decreased by increasing the concentrations of MNPs (20-80 µg/ml) for both Mag and Mag-SiO2 nanoparticles (Fig. 4). The
same trend was observed at all experimental time-points: 24, 48 and 72 hours (Fig. 5 and 6).
Cell viability after contact with Mag-SiO2 NPs was in a range of 81-97% and not significantly
differed when compared with Mag NPs (viability range between 86 and 98%) for concentrations ranging from 10 to 80 µg/ml (Figures 4-6). Trypan blue assay validated the results obtained with MTT assay (Tables 4-6).
No morphological alterations were observed between cells in direct contact with MNPs and control using IF staining (Fig. 7-9) and microscopic observation (Fig. 10-12).
Figure 4. Cytocompatibility assessment of MS1 cells after 24 hours in contact with different concentration
24
Table 4. Trypan blue exclusion test. MS1 cell mortality after direct contact of 24 hours with MNPs. Data are
shown as the mean ± standard deviation (n = 4). *P < 0.05 compared with control.
Figure 5. Cytocompatibility assessment of MS1 cells after 48 hours in contact with different concentration
of MNPs. Data are shown as the mean ± standard deviation (n = 4). *P < 0.05 compared with control.
Percentage of TB positive MS1 cells after 48 hours of contact with MNPs
Samples 10 μg/ml 20 μg/ml 40 μg/ml 80 μg/ml
Mag 4.0 + 0.7 4.8 + 0.9 6.4 + 1.2 13.3 + 1.4* Mag-SiO2 5.9 + 0.9 8.5 + 1.4* 11.4 + 1.5* 16.9 + 0.8*
Table 5. Trypan blue exclusion test. MS1 cell mortality after direct contact of 48 hours with MNPs. Data are
shown as the mean ± standard deviation (n = 4). *P < 0.05 compared with control.
Percentage of TB positive MS1 cells after 24 hours of contact with MNPs
Samples 10 μg/ml 20 μg/ml 40 μg/ml 80 μg/ml
Mag 1.7 + 0.9 4.2 + 1.5 5.8 + 0.7 12.6 + 1.2* Mag-SiO2 2.9 + 1.0 6.4 + 1.2 9.6 + 0.8* 14.7 + 1.4*
25
Figure 6. Cytocompatibility assessment of MS1 cells after 72 hours in contact with different concentration
of MNPs. Data are shown as the mean ± standard deviation (n = 4). *P < 0.05 compared with control.
Percentage of TB positive MS1 cells after 72 hours of contact with MNPs
Samples 10 μg/ml 20 μg/ml 40 μg/ml 80 μg/ml
Mag 4.3 + 1.4 6.2 + 1.3 7.9 + 1.0 14.3 + 1.1* Mag-SiO2 7.9 + 1.8 8.9 + 0.6* 13.6 + 1.3* 18.4 + 1.4*
Table 6. Trypan blue exclusion test. MS1 cell mortality after direct contact of 72 hours with MNPs. Data are
26
Figure 7. Cells seeded for 24 h in contact with nanoparticles (10-80 µg/ml). IF staining with DAPI (blue) and phalloidin (red). Magnification: 20x, bar scale = 50 µm.
27
Figure 8. Cells seeded for 48 h in contact with nanoparticles (10-80 µg/ml). IF staining with DAPI (blue) and phalloidin (red). Magnification: 20x, bar scale = 50 µm.
28
Figure 9. Cells seeded for 72 h in contact with nanoparticles (10-80 µg/ml). IF staining with DAPI (blue) and phalloidin (red). Magnification: 20x, bar scale = 50 µm.
29
Figure 10. Optical microscopic images of endothelial cells (MS1 cells) after direct contact with MNPs
(10-80 µg/ml) for 24 hours. Magnification: 20x, bar scale = 50 µm. No effects are observed on cell morphological features.
30
Figure 11. Optical microscopic images of endothelial cells (MS1 cells) after direct contact with MNPs
(10-80 µg/ml) for 48 hours. Magnification: 20x, bar scale = 50 µm No effects are observed on cell morphological features.
31
Figure 12. Optical microscopic images of endothelial cells (MS1 cells) after direct contact with MNPs
(10-80 µg/ml) for 24 hours. Magnification: 20x, bar scale = 50 µm. No effects are observed on cell morphological features.
32
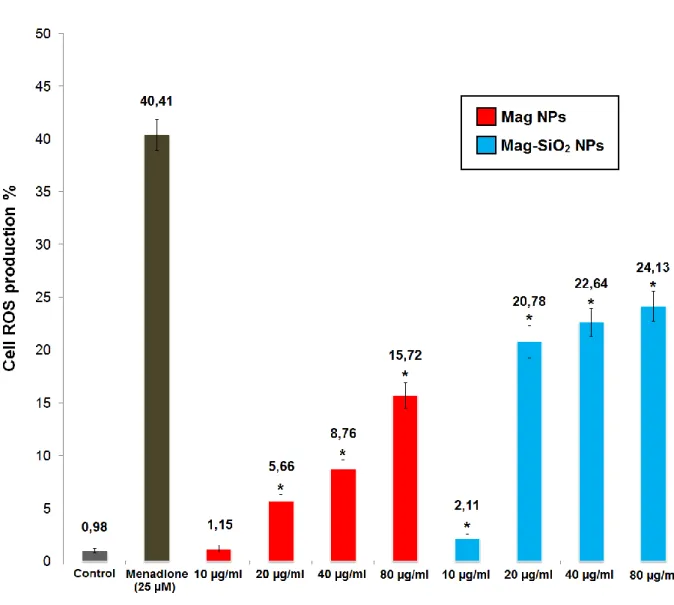
2.3.4 ROS generation induced by MNPs
Naked and silica core-shell type iron oxide nanoparticles could induce the generation of intracellular reactive oxygen species (ROS) depending on the concentration of nanoparticles, and oxidative stress followed by ROS generation may cause damage to mitochondria and DNA. We investigated whether Mag and Mag-SiO2 NPs could induce the generation of intracellular ROS.
CellROX Green Reagent was used to determine the generation of intracellular ROS induced by MNPs.
ROS generation was observed in MS1 cells exposed to Mag and Mag-SiO2 NPs at 10, 20, 40 and 80
µg/ml concentrations for 24 h (Figure 13). An increase in ROS generation was observed in both Mag and Mag-SiO2 NPs in a concentration-dependent manner following the exposure of 10, 20, 40
and 80 µg/ml MNPs for 24 hours (1.15%, 5.66%, 8.76% and 15.72% of ROS expression for Mag NPs and 2.11%, 20.78%, 22.64% and 24.13% of ROS expression for Mag-SiO2 NPs, respectively).
33
Figure 13. Effect of MNPs on the generation of ROS. Cells were treated with a designated concentration of
MNPs for 24 hours. Results are expressed as mean ± SD. *P < 0.05 compared with control untreated and positive control (Menadione 25 µM).
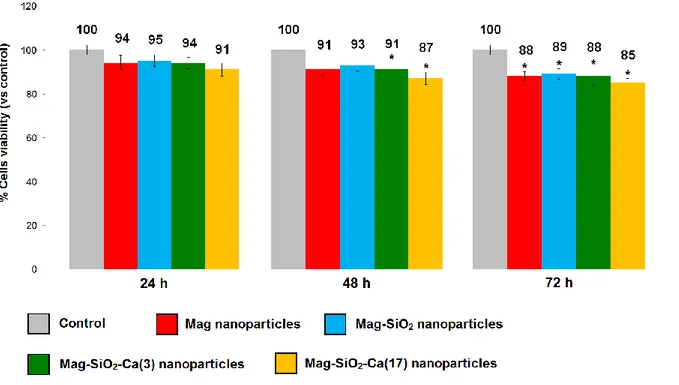
2.4 Discussion
In this chapter we used a chemical co-precipitation method to synthesize magnetic nanoparticles. The advantages of this procedure include ease of synthesis, good control of chemical conditions, and repeatable experimental results [106]. Morphological observations and chemical compositional evaluation using EDS analyses and various electron microscopic methods confirmed that we successfully prepared naked and silica core-shell type iron oxide nanoparticles with uniform electron density, regular morphology, and homogeneous particle size, which are all fundamental
34 factors for biomedical applications. The bad points of this first synthesis of magnetic nanoparticles were the low dispersibility and colloidal stability of MNPs and a slight cell mortality observed for Mag NPs in not direct cytotoxicity. In vitro preliminary cytocompatibility is one of the most important prerequisite for the clinical application of any biomaterial [54]. The European Medicines Agency (EMA) and the U.S. Food and Drug Administration (FDA) are paying more attention to the safety of medical materials. Before any clinical study of a new biomaterial can take place, its compatibility must be evaluated by in vitro testing according to ISO standard 10993-12: 1996 that is a standard biological evaluation for medical instruments and is based on cell toxicity assays. The present study also carried out two cell toxicity tests based on mitochondrial dehydrogenase assessment (MTT assay) and plasma membrane damage evaluation (Trypan Blue (TB) staining). These cell toxicity assays are basic methods of evaluating the biocompatibility of biomaterials when studying cytotoxicity [54]. They are, fast, simple, flexible, and reproducible techniques. Therefore, we performed for MNPs a direct contact cytotoxicity evaluation and an in vitro not direct cytotoxicity test using a leaching solution. In not direct contact cytotoxicity evaluation Mag nanoparticles caused higher cell mortality after 24, 48 and 72 hours for both leaching conditions respect to Mag-SiO2 nanoparticles. Our results showed that Fe3O4/SiO2 magnetic nanoparticle
leaching solutions have a very limited influence on cell viability.
In direct static contact cytotoxicity evaluation a trend of cell viability comparable to control was observed after 24, 48 and 72 hours for both Mag and Mag-SiO2 nanoparticles. The cells maintained
>80% cell viability even after 72 h of treatment with the samples at the concentration of 80 µg/ml. The trypan blue exclusion assays were also employed to determine the effect of iron-oxide nanoparticles on cell mortality of MS1 cells (Tables 3, 4 and 5). The obtained data were consistent with the results of the MTT assay. MTT assay and TB staining were used like two complementary tests for the evaluation of the cytocompatibility of magnetic nanoparticles constituting in this way a mutual confirmation of the experimental data. These results clearly confirmed the low cytotoxicity of the Mag and Mag-SiO2 NPs compared to control in direct static contact conditions. All cell
viability rates of direct contact cytotoxicity were greater than 75%. Thus, it can be considered a promising cytocompatible biomaterial. ROS production induced from the first synthesis of MNPs on MS1 cells was investigated. ROS are important intracellular mediators of the inflammatory response and cell death following uptake of nanoparticles. ROS generation induced by the first synthesis of MNPs was in a concentration-dependent manner after 24 hours.
35
Chapter 3
Biological characterization of magnetic nanoparticles synthesized via
co-precipitation methods using citric acid as dispersant
3.1 Aim
The purpose of this part was to improve dispersibility and cytocompatibility of naked and silica core-shell type iron oxide nanoparticles respect to the first synthesis of MNPs. Dispersibility of the second synthesis of MNPs was improved respect to the first synthesis using citric acid as dispersant. In addition, calcium-silica core-shell type iron-oxide nanoparticles were introduced between the magnetic nanoparticles produced to exploit their positive surface charge for MNPs functionalization with targeting moieties. The first synthesis of MNPs showed problems of dispersibility and colloidal stability. In fact MNPs of first synthesis were observed to precipitate in solution. Physical-chemical, magnetic and in vitro biological characterization of the second synthesis of nanoparticles was carried out to investigate their colloidal stability, superparamagnetic properties and cytocompatibility.
3.2 Materials and methods
3.2.1 Nanoparticles preparation
Four different types of magnetic nanoparticles were preapared: Mag, Mag-SiO2, Mag-SiO2-Ca(3),
Mag-SiO2-Ca(17). The preliminary physico-chemical characterization of the nanoparticles was
performed by Politecnico di Torino as following reported. Their main characteristics are described in table 7. One samples were naked magnetite while three consisted of a magnetite core covered by an amorphous silica shell (Mag-SiO2) (Figure 14). The silica or silica-based glass layer (e.g. SiO2
-CaO) is useful to increase NP surface reactivity (e.g. by exposition of hydroxyl groups) and allow functionalization with targeting moieties (e.g. folic acid, monoclonal antibodies, fatty acids), drugs (e.g. cisplatinum, doxorubicin) and lentiviral vectors or other drug/tracers.
36
Figure 14. Schematic representation of silica core-shell type magnetic nanoparticles.
SAMPLE MATERIAL MEDIUM Concentration
of stock solution
pH approx
Notes
Mag Citric acid treated magnetite nanoparticles
Water 5 mg/ml 4.12 Stable in
solution for weeks
Mag-SiO2 SiO2 coated citric acid
stabilized magnetite nanoparticles Water 1,4 mg/ml 6.96 Stable in solution for weeks Mag-SiO2 -Ca(3)
SiO2 - Ca (low amount
Ca) coated citric acid stabilized magnetite nanoparticles Water 1,3 mg/ml 7.10 Stable in solution for weeks Mag-SiO2 -Ca(17)
SiO2 - Ca (high amount
Ca) coated citric acid stabilized magnetite nanoparticles
Water 2,6 mg/ml 8.01 Tendency to partial precipitation
Table 7. Main characteristics of MNPs synthesized via co-precipitation methods using citric acid.
3.2.2 Nanoparticles: synthesis of MNPs
Magnetite nanoparticles (Mag) were produced by co-precipitation method [101] as explained in chapter 2.2.1. Aqueous solutions of FeCl2 and FeCl3 were mixed and pH was brought to basic
values (about 10.0) by dropwise NH4OH addition.
To improve water dispensability of the MNPs, a treatment of magnetite with citric acid was carried out by soaking nanoparticles in citric acid solution (0.05 M) for 24h and then exhaustively washed with water.
37 At the end of nanoparticles synthesis and fictionalization with citric acid, by adding tetraethyl orthosilicate (TEOS) (a silica precursor), with ethanol and water as solvent, an amorphous silica shell (Mag-SiO2) was obtained.
To avoid the uncontrolled TEOS polymerization in the reaction media and to optimize the silica shell [107], the TEOS amount was reduced and concomitantly ethanol was added in the synthesis step, as described in the Stöber method [102].
To obtain calcium-silica magnetite NPs, calcium citrate was selected as precursor of Ca2+ ions and thus added in the synthesis process together with TEOS. Two different amounts of calcium citrate were tested to reach 99:1 (Mag-SiO2-Ca(3)) and 95:5 ((Mag-SiO2-Ca(17)) Si:Ca ratios,
respectively.
3.2.3 Nanoparticle characterization
The size and shape of MNPs were characterized by means of transmission electron microscopy (TEM, Philips CM12, working at 120 kV operating voltage with a LaB6 filament), field emission scanning electron microscopy (FESEM - SUPRATM 40, Zeiss), scanning transmission electron microscopy (STEM-FESEM MERLIN Zeiss.) and energy dispersive x-ray spectroscopy (EDS) (Edax PV9800). Selected area electron diffraction (SAED) patterns were obtained for each sample to observe the morphology and structure.
FESEM micrographs of magnetic nanoparticles were captured using a SUPRATM 40, Zeiss field emission microscope operated at an excitation voltage of 10 kV. The elemental compositional study was investigated through energy dispersive spectroscopy (EDS) by using EDAX PV 9900 instrument coupled with STEM-FESEM.
A droplet of an aqueous dispersion of nanoparticles was placed on a copper grid for FESEM, TEM and STEM-FESEM sample preparation, allowed to dry, and examined under electron microscopy previously cited.
3.2.4 X-ray diffraction (XRD) analysis
XRD analysis of the synthesized magnetic nanoparticles was carried out in D8 Advance Powder X-ray diffractometer (Bruker, Germany) using CuKα radiation (λ = 1.54 nm). The XRD patterns were obtained between 2θ of 10° and 80° at a scanning rate of 4° min-1. The obtained pattern from the XRD analysis was used to identify the crystalline structure of the samples.
38
3.2.5 Magnetic performance testing
A vibrating sample magnetometer (VSM-Lakeshore) was used to measure the magnetic hysteresis of naked iron-oxide nanoparticles and silica or silica-based glass layer core shell-type nanoparticles at 300 K under an applied field of ±15000 g.
3.2.6 Determination of sedimentation rates
Sedimentation tests were performed in order to evaluate the stability over time of iron oxide nanoparticles suspensions with and without different dispersants. The sedimentation rates of magnetic nanoparticles were measured by the change of optical absorbance with time, which can be related to the normalized nanoparticle concentration C/C0, where C is the concentration in time t,
and C0 is the initial concentration (i.e. the initial absorbance at time 0). The sedimentation rate is
then d(C/C0)/dt [108]. For relatively fast sedimentation conditions, the initial sedimentation rate was
estimated from the decrease in the normalized particle concentration within the first 90 min, while for slower sedimentation conditions (C/C0 decrease less than 80% in 600 min), all data within 50
hours were included. The following dispersants with the same concentration of MNPs (10 µg/ml) were used: citric acid, PEI (polyethylenimine), Dispex (polyacrylate dispersant) and Dolapix (deflocculant polycarboxylic acid). The tests were performed with and without the presence under the samples of a magnet for a period of time of 50 h.
3.2.7 AFM/MFM
AFM/MFM images of magnetic nanoparticles were acquired at room temperature with a Shimadzu Scanning Probe Microscope (SPM-9600). Tapping-mode was used to obtain the sample surfaces topography and lift-mode was used for the magnetic phase. In lift-mode, the tip-sample distance varied by tens to hundreds of nanometres. Magnetic force microscopy (MFM) images were obtained by allowing the cobalt coated magnetic tip (oscillating at its resonance frequency) to scan the air dried magnetic nanoparticles at the start height of 20 nm in 5 µm × 5 µm area using the MFM facility of Nanoscope IV.
39
3.2.8 Zeta potential
Zeta potential of nanoparticles was detected using a laser-scattering method (Zetasizer Nano ZS90; Malvern Instruments, Malvern, UK). The nanodispersions were diluted 100-fold with deionized water before testing. The measurement was repeated three times per sample at room temperature and the values reported as the average ± SD. Zeta potential was measured to different acid and basic pH values to evaluate the colloidal properties of MNPs by varying the isoelectric point of MNPs solutions.
Zeta potential can be related to the stability of colloidal dispersions. The relationship between the zeta potential value of the solution measured and the colloidal stability are indicated in Table 8 [109].
Zeta potential [mV] Stability behavior of the colloid
from 0 to ±5, Rapid coagulation or flocculation
from ±10 to ±30 Incipient instability
from ±30 to ±40 Moderate stability
from ±40 to ±60 Good stability
more than ±61 Excellent stability
Table 8. Relationship between the value of Zeta Potential measured and colloidal stability of the solution
[109].
3.2.9 Cell culture
As previously described in the paragraph 2.2.2.
3.2.10 Not direct contact cytotoxicity evaluation of MNPs
40
3.2.11 Direct static contact cytotoxicity evaluation of MNPs
Direct static contact cytotoxicity evaluation of MNPs was done according to ISO standard 10993-5: 2009. Direct contact cytotoxicity was evaluated on MS1 cells for the following MNPs: Mag, Mag-SiO2, Mag-SiO2-Ca(3) and Mag-SiO2-Ca(17). The cells were seeded in 24-well plates (1.6 x 10⁴
cells per well) in DMEM medium and cultured for 24 h at 37°C in 5% CO2 atmosphere-controlled
incubator. After 24 hours the medium was substituted with a new one obtained by adding MNPs to DMEM to obtain the following concentrations: 10 μg/ml, 20 μg/ml, 40 μg/ml and 80 μg/ml (w/v). MS1 endothelial cells cultivated onto polystyrene wells in presence of DMEM additioned with 2 mM L-glutamine, 10% FBS and 1% antibiotics/antimycotics were used as control. Afterwards, cell viability was evaluated after 24, 48 and 72 hours using MTT assay, as above described for the indirect cytocompatibility assay. The viability of controls were considered as 100% viability. Even for direct contact cytotoxicity evaluation the percentages of cell viability observed in MTT assay were validated by Trypan Blue (TB) staining. Furthermore, cells morphology was visually investigated at each experimental time by light microscopy (Leica AF 6500, Leica Microsystems) at 20x magnification.
3.2.12 Lactate dehydrogenase assay
The effect of the NPs on the integrity of the cell membrane was assayed using a LDH Cytotoxicity Assay Kit (Gesan group). The assay was performed as per the manufacturer’s instructions. LDH is released by cells in response to damage or loss of integrity of cell membrane and is a cellular toxicity indicator. Briefly, 1.6 ×10⁴ cells/well were seeded in 24-well plates and treated with the following concentrations of MNPs: 10 μg/ml, 20 μg/ml, 40 μg/ml and 80 μg/ml (w/v) for 24, 48 and 72 hours. Untreated cells were taken as the negative control and cells treated with lysis buffer were taken as the high control (total LDH in the cell). As a positive control, 1 μL of LDH was used to validate the assay. Following the incubation with NPs, the well plates were centrifuged at 600 g for 10 minutes and 10 μL of the medium was transferred to a fresh 96-well plate. The medium was then incubated with 100 μL of LDH reaction mixture for 15 minutes at room temperature and the absorbance was measured at 450 nm using the microplate reader (Victor X4 - PerkinElmer) with the reference wavelength at 650 nm. LDH was quantified using the following formula:
41 LDH% = Test – low control x 100
High control – low control
in which “low control” was the cells without any treatment and “high control” was the cells treated with lysis buffer (total LDH).
3.2.13 Cells morphology evaluation by fluorescent microscopy
MNPs influence on cell morphology and cytoskeleton was evaluated by immunofluorescence (IF) staining. MS1 cells morphology in contact with magnetic nanoparticles (40 μg/ml for 72 h) was investigated by immunofluorescence (IF) staining. Briefly, after direct contact (72 h) with MNPs, cells were gently washed with PBS and fixed for 5 min with 4% formaldehyde-3% sucrose solution (in PBS) at RT. Afterwards, samples were washed three times with PBS and stained to visualize F-actins and nucleic acids by phalloidin (Molecular Probes Inc.) and 49,6-diamidino-2- phenylindole (DAPI, Molecular Probes Inc.). Fluorescence images were collected with a fluorescent microscope (Leica AF 1500, Leica Instruments).
3.2.14 Statistical analyses
All statistical analyses were performed using IBM Statistical Package for Social Sciences v. 20 software (SPSS - IBM). Data were expressed as means ± standard deviations. The results were analyzed using one way analysis of variance (ANOVA) followed by Scheffe’s test, and P values less than 0.05 were considered to be statistically significant.
3.3 Results
3.3.1 Physical-chemical characterization of MNPs
Small (10-15 nm) Mag NPs were obtained as observable with Field Emission Scanning Electron Microscopy (FESEM) (Figure 15a). X-ray diffraction (XRD) patterns confirmed that they consisted of magnetite/maghemite (Figure 15b). Spherical silica coated magnetite nanoparticles, with an evident core-shell structure were obtained, as observed by TEM and scanning transmission electron microscope (STEM) (Figure 16).
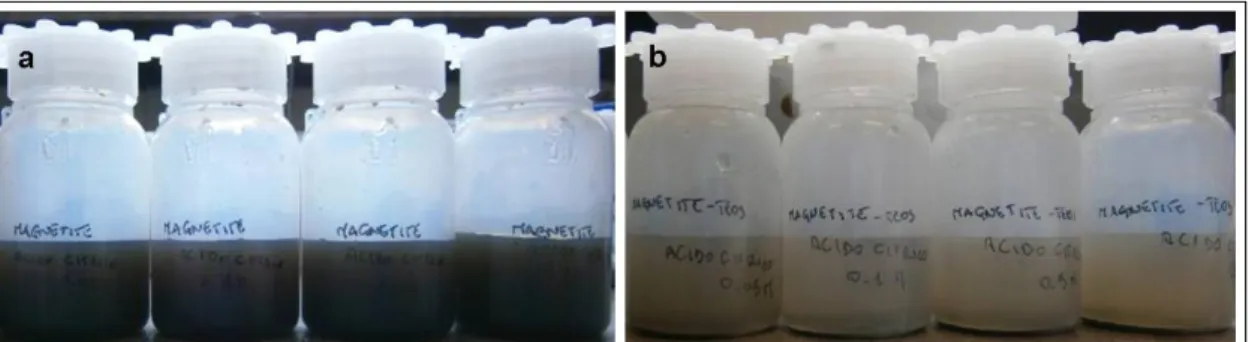
42 A good dispersion was reached for magnetite (Fig. 17a), and less for SiO2-coated magnetite NPs
(Figure 17b). Selected area electron diffraction (SAED) patterns detected signals of Mag NPs and Mag-SiO2 NPs (Figure 18).
Figure 15. Magnetite obtained by co-precipitation a) FESEM observation, b) XRD analysis.
Figure 16. TEM image (a), SAED (b) and STEM (c) of optimized SiO2 coated magnetite nanoparticles.
Figure 17. a) citric acid treated magnetite nanoparticles, b) citric acid treated SiO2-coated magnetite
43
Figure 18. SAED patterns of Mag NPs (a) and Mag-SiO2 NPs (b).
3.3.2 Mag-SiO2-Ca NPs characterization
In view of the fact that MNPs should be functionalized, their surface reactivity was enhanced. This aim was approached by adding calcium ions to their surface. Mag-SiO2-Ca nanoparticles (10-15
nm) with calcium and with a good dispersion in water were obtained. An effective enrichment in Ca2+ was verified for both formulations with an increased calcium content, according to expectancies by means of compositional analysis (Figure 19).
Figure 19. TEM image (a), SAED patterns (b) and EDS spectrum (c) of Mag-SiO2-Ca nanoparticles.
3.3.3 Morphological observations
TEM showed that the electron density of the magnetic particles was relatively high, and that the particles, which were spherical and partially agglomerated (Figure 20). Mag, Mag-SiO2, Mag-SiO2
-Ca(3) and Mag-SiO2-Ca(17) NPs obtained after citric acid (CA) treatment were analyzed for their
size at transmission electron microscope (TEM) and shown to be small (10-15 nm) and spherical with a shell (silica) with a thickness of 1-2 nm (Figure 20). EDS analysis confirmed the composition of the nanoparticles through a rough estimate (data not shown).
44
Figure 20. TEM images of magnetic nanoparticles: Mag (A), Mag-SiO2 (B), Mag-SiO2-Ca3 (C) and
Mag-SiO2-Ca17 (D).
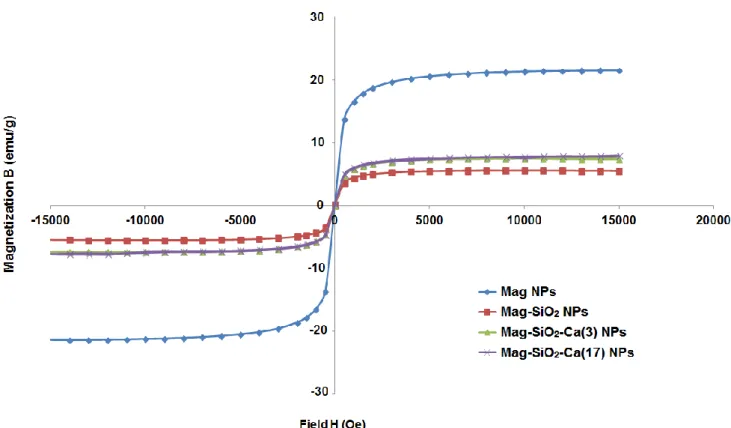
3.3.4 Magnetic performance
A vibrating sample magnetometer was used to measure the magnetic hysteresis of the magnetic nanoparticles at 300 K in an applied field of ± 15000 g. The results showed that the saturated magnetic intensity of Mag NPs and Mag-SiO2 NPs were ± 20.2 emu/g and ± 5.3 emu/g
respectively. Instead, the saturated magnetic intensities were ± 7.3 emu/g and ± 7.4 emu/g for Mag-SiO2-Ca(3) NPs and Mag-SiO2-Ca(17) NPs respectively (Figure 21). The four lines of the
hysteresis loop overlapped, ie, no coercivity was noted, indicating that the magnetic nanoparticles prepared were superparamagnetic.
45
Figure 21. Measurement of the magnetic hysteresis of Mag, Mag-SiO2, Mag-SiO2-Ca(3), Mag-SiO2-Ca(17)
NPs - Magnetic performance.
3.3.5 AFM/MFM
MFM images of magnetic nanoparticles along with its AFM image counterpart in 5 µm × 5 µm scan area were shown in the Figure 22. The image clearly indicated the core structure of magnetic nanoparticles. The dark contrasts appearing in the MFM image are the signals due to presence of iron oxide MNPs. Consequently, it is observed a high frequency change (up to 125 Hz) in the vertically oscillating magnetic tip nearby the surfaces of magnetic nanoparticles. The sample presents a relative constant magnetism all over the scanned MNPs surface regardless of the sample’s corresponding height. The relative intensity of the magnetic phase has a scale of 1°, indicating a weak detected field. The phase images shown in the right side of Figures present a magnetic response from the sample induced by the magnetization of the tip. The results here cannot be considered to be quantitative measurements because the principle of magnetic force microscopy (MFM) involves measuring a phase change in the resonance frequency spectrum of the (magnetized) cantilever, compared to the original resonance frequency while scanning different regions of the sample.
46
Figure 22. Representative AFM/MFM images of Mag, Mag-SiO2, Mag-SiO2-Ca(3) and Mag-SiO2-Ca(17)
47
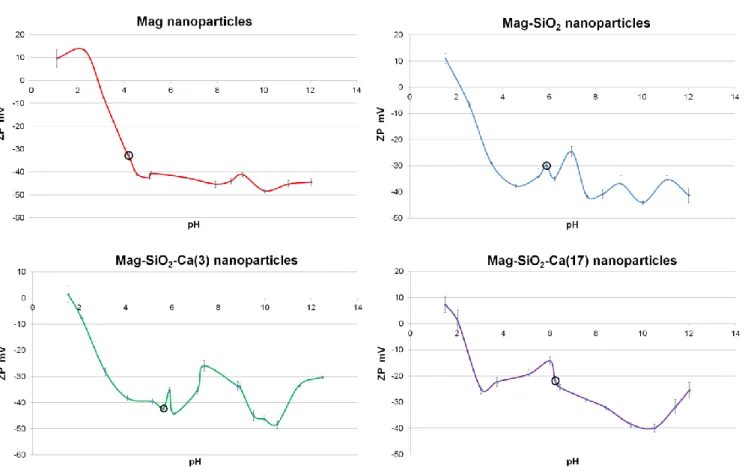
3.3.6 Zeta potential evaluation
Zeta-potential measurement is considered as a key parameter for providing an insight into the colloidal stability of the resulting magnetic nanoparticles. The zeta-potential results are shown in Fig. 23. The zeta potential of suspension for Mag NPs, Mag-SiO2 NPs, Mag-SiO2-Ca(3) NPs and
Mag-SiO2-Ca(17) NPs is - 32.46 mV, - 29.88 mV, - 42.21 mV and - 21.74 mV, respectively (Table
9). Zeta potential measurements revealed an incipient colloidal instability for Mag-SiO2 NPs and
Mag-SiO2-Ca(17) NPs, a moderate colloidal stability for Mag NPs and a good colloidal stability for
Mag-SiO2-Ca(3) NPs.
Figure 23. Zeta Potential measurements of MNPs. Data are shown as the mean ± standard deviation (n = 3).