ContentslistsavailableatScienceDirect
NeuroImage
journalhomepage:www.elsevier.com/locate/neuroimage
Multi-centre,
multi-vendor
reproducibility
of
7T
QSM
and
R
2
∗
in
the
human
brain:
Results
from
the
UK7T
study
Catarina
Rua
a,∗,
William
T.
Clarke
b,
Ian
D.
Driver
c,
Olivier
Mougin
d,
Andrew
T.
Morgan
e,
Stuart
Clare
b,
Susan
Francis
d,
Keith
W.
Muir
e,
Richard
G.
Wise
c,
T.
Adrian
Carpenter
a,
Guy
B.
Williams
a,
James
B.
Rowe
f,g,
Richard
Bowtell
d,
Christopher
T.
Rodgers
aa Wolfson Brain Imaging Centre, Department of Clinical Neurosciences, University of Cambridge, Box 65, Cambridge Biomedical Campus, Cambridge CB2 0QQ, United
Kingdom
b Wellcome Centre for Integrative Neuroimaging, FMRIB, Nuffield Department of Clinical Neurosciences, John Radcliffe Hospital, University of Oxford, Oxford OX3
9DU, United Kingdom
c Cardiff University Brain Research Imaging Centre, School of Psychology, Cardiff University, Maindy Road, Cardiff CF24 4HQ, United Kingdom d Sir Peter Mansfield Imaging Centre, School of Physics and Astronomy, University of Nottingham, University Park, Nottingham NG7 2RD, United Kingdom e Imaging Centre of Excellence, Queen Elizabeth University Hospital, University of Glasgow, Langlands Dr, Glasgow G51 4LB, United Kingdom
f Department of Clinical Neurosciences and Cambridge University Hospitals NHS Trust, University of Cambridge, Herchel Smith Building, Cambridge Biomedical Campus,
Cambridge CB2 0SZ, United Kingdom
g Medical Research Council Cognition and Brain Sciences Unit, University of Cambridge, 15 Chaucer Road, Cambridge CB27EF, United Kingdom
a r t i c l e
i n f o
Keywords:7 tesla MRI
Quantitative susceptibility mapping R 2∗ mapping
Multi-centre Reproducibility
a b s t r a c t
Introduction:Wepresentthereliabilityofultra-highfieldT2∗MRIat7T,aspartoftheUK7TNetwork’s“Travelling
Heads” study.T2∗-weightedMRIimagescanbeprocessedtoproducequantitativesusceptibilitymaps(QSM)and
R2∗maps.Thesereflectironandmyelinconcentrations,whicharealteredinmanypathophysiologicalprocesses.
TherelaxationparametersofhumanbraintissuearesuchthatR2∗mappingandQSMshowparticularlystrong
gainsincontrast-to-noiseratioatultra-highfield(7T)vsclinicalfieldstrengths(1.5–3T).Weaimedtodetermine theinter-subjectandinter-sitereproducibilityofQSMandR2∗mappingat7T,inreadinessforfuturemulti-site
clinicalstudies.
Methods: Tenhealthyvolunteerswerescannedwithharmonisedsingle-andmulti-echoT2∗-weighted
gradi-entechopulsesequences.Participantswerescannedfivetimesateach“home” siteandonceateachoffour othersites.Thefivesiteshad1×Philips,2×SiemensMagnetom,and2×SiemensTerrascanners.QSMandR2∗
mapswerecomputedwiththeMulti-ScaleDipoleInversion(MSDI)algorithm(https://github.com/fil-physics/ Publication-Code).Resultswereassessedinrelevantsubcorticalandcorticalregionsofinterest(ROIs)defined manuallyorbytheMNI152standardspace.
ResultsandDiscussion: Meansusceptibility(𝜒)andR2∗valuesagreedbroadlywithliteraturevaluesinallROIs.
Theinter-sitewithin-subjectstandarddeviationwas0.001–0.005ppm(𝜒)and0.0005–0.001ms−1(R 2∗).For𝜒
thisis2.1–4.8foldbetterthan3Treports,and1.1–3.4foldbetterforR2∗.ThemedianICCfromwithin-and
cross-siteR2∗datawas0.98and0.91,respectively.Multi-echoQSMhadgreatervariabilityvssingle-echoQSM
especiallyinareaswithlargeB0inhomogeneitysuchastheinferiorfrontalcortex.Acrosssites,R2∗valueswere
moreconsistentthanQSMinsubcorticalstructuresduetodifferencesinB0-shimming.Onabetween-subjectlevel,
ourmeasured𝜒 andR2∗cross-sitevarianceiscomparabletowithin-sitevarianceintheliterature,suggestingthat
itisreasonabletopooldataacrosssitesusingourharmonisedprotocol.
Conclusion: TheharmonizedUK7Tprotocolandpipelinedeliversonaveragea3-foldimprovementinthe coeffi-cientofreproducibilityforQSMandR2∗at7Tcomparedtopreviousreportsofmulti-sitereproducibilityat3T.
Theseprotocolsarereadyforuseinmulti-siteclinicalstudiesat7T.
1. Introduction
Neurodegenerativediseasesareasignificantglobalhealthburden. Inmany instances,neurodegenerationis associated withthe
deposi-∗Correspondingauthor.
E-mailaddress:[email protected](C.Rua).
tion of iron in the brain. Understanding the patterns of deposition and their association with other risk factorsis a key area of clini-calresearch,butprogresshasbeenlimitedbytheneedtoscaleover multi-centre trials(Moeller etal., 2019). TheEUFIND(Düzel etal., 2019)isanexampleofanetworkfocusedonadvancementsin neurode-generativeresearchbyrunninglarge-scalemulti-centreimaging stud-ies.Also,theUK7Tnetwork(http://www.uk7t.org)hasrecentlyruna https://doi.org/10.1016/j.neuroimage.2020.117358
Received22April2020;Receivedinrevisedform3September2020;Accepted3September2020 Availableonline9September2020
multi-sitestudywithadementiacohorttoassessfeasibilityinpatient groups.ImagingaspartoftheC-MOREstudy(Capturingthe MultiOR-ganEffectsofCOVID-19)isalsoincludingharmonizedmulti-centre se-quenceswhichmightprovideinsightsintothelong-termimpactin sur-vivorsofCOVID-19( https://oxfordbrc.nihr.ac.uk/brc-funds-new-covid-19-research-projects/).Yet,inordertoperformsuchmulti-centre stud-ies,itisnecessarytofirstguaranteetheconsistencyandreproducibility ofimagingmarkers.
Apopularapproachtoestimatingironconcentrationinthehuman brainusesgradient-echo(GE)magnetic resonanceimaging(MRI).In grey matter,ironis mainlyfound in theprotein ferritinwhich, due toitsantiferromagneticcoreandthepresenceofuncompensatedspins atthesurfaceorinthecore,exhibitsasuperparamagneticbehaviour (Makhlofetal.,1997;Langkammeretal.,2012).Thisparamagneticiron interactswiththeMRIscanner’sstaticmagneticfield(B0)causinglocal dipolarfieldperturbations.Theseaccentuatetherateoftransverse sig-naldecaycausingT2∗relaxationinsurroundingtissue,whichisvisible asdecreasingsignalamplitudewithincreasingechotimeinaseriesof GEimages.Thiseffectcausesanincreaseintherateoftransverse re-laxation,R2∗,whichcorrelateswellwithnon-hemeironconcentrations ingreymatter(Gelmanetal.,1999;Langkammeretal.,2010),andhas beenusedtoinvestigatethedistributionofironinthehealthybrainand indisease(Haackeetal.,2005;Yaoetal.,2009;Lietal.,2019).
Thelocalpresenceofiron(andtoalesserextentmyelin and cal-cium)alsoaffectsthesignalphaseofGEimagesbecauseoftheeffect ofthefieldperturbationonthelocalLarmorfrequency(Houseetal., 2007;Heetal.,2009;Leeetal.,2012).QuantitativeSusceptibility Map-ping(QSM)methodsattempttodeconvolvethesedipolephasepatterns toidentifythesourcesofthemagneticfieldinhomogeneity.Inother words,QSMestimatesquantitativemapsoftissuemagnetic suscepti-bility𝜒 fromGEphasedata(LiandLeigh,2004;Reichenbach,2012; WangandLiu,2015).Thisapproachhasshownsensitivitytoseveral neurologicalconditions(Lotfipouretal.,2012;Acosta-Cabroneroetal., 2013;Blazejewskaetal.,2015;Acosta-Cabroneroetal.,2016)and of-fersadvantagesovermagnitudeR2∗suchashavingreducedblooming artifactsorbeingabletodistinguishbetweenparamagneticand diamag-neticsubstances(Eskreis-Winkleretal.,2017).
R2∗imagingandQSMhavebeenshowntoprovidereproducible re-sultsinsingle-siteandcross-sitestudiesat1.5Tand3T(Hinodaetal., 2015;Cobzasetal.,2015;Dehetal.,2015;Linetal.,2015;Santinetal., 2017;Fengetal.,2018;Spincemailleetal.,2019).
Thedipole-inversionproblemattheheartofQSMmethodsbenefits fromtheincreasedsensitivitytomagneticsusceptibilityvariationand spatialresolutionatultra-highfields(B0≥7T)(Yacoubetal.,2001; Reichenbach etal., 2001; Tie-Qianget al.,2006; Duyn etal., 2007; WhartonandBowtell, 2010).At7T, closeattentionmustbe paidto B0shimmingandgradientlinearitytoachieveaccurateQSMandR2∗ mapping(Yangetal.,2010).Headpositionisalsoanimportantfactor thataffectsthesusceptibilityanisotropy(Lancioneetal.,2017;Lietal., 2017).
Inthisstudy,weintroducesingle-echoandmulti-echoGEimaging protocolsforQSMandR2∗mappingat7Twhichwerestandardisedon threedifferent7TMRIscannerplatforms,fromtwodifferentvendors. WeappliedthisstandardisedprotocolintheUK7TNetwork’s “Travel-lingHeads” studyon10subjectsscannedat5sites.Wereport repro-ducibilityforderivedR2∗andQSMmapsandmakerecommendations forthedesignoffuturemulti-centrestudies.
2. Methods
2.1. Measurementsetup
Tenhealthyvolunteers(3female,7male;age32.0±5.9years)were recruited:comprisingtwosubjectsfrom eachof thefive7Timaging
sites in theUK7TNetwork (describedin Table 1).Each subjectwas scannedfivetimes attheir “home” site,andonceat theothersites, under local ethicsapproval for multi-site studiesobtained at Site-4 (HBREC.2017.08).Scansforeachsubjectwerecompletedwithina pe-riodofbetween83and258days.Thefivehome-sitescanswere per-formed acrossdifferent sessions: themedian timetoacquireall five scanswas59days(range:3–71days).
In every scan session, B0 shimming was performed using the vendors’ default second-order (or third-order for Site-4 and Site-5) B0-shimming routines. B1+-calibration was performed initially using the vendor’s default adjustment scans. A 3D DREAM se-quence (Nehrke and Bornert, 2012; Ehses et al., 2019) was subse-quently acquired and the transmit voltage (or power attenuation) was then adjusted for all subsequent imaging based on the mean flip-angle from the brain in an anatomically-specified axial slice of the 3DDREAMflip anglemapas described in Clarkeet al.(2019). Single-echo 0.7mm isotropic resolution T2∗-weighted GE data were thenacquired with: TE/TR=20/31ms;FA=15°;bandwidth=70Hz/px; in-plane acceleration-factor=4 (Sites-1/2/4/5) or 2 × 2 (Site-3); FOV=224 × 224 × 157mm3; scan-time=~9min. Multi-echo 1.4mm isotropic resolution T2∗-weighted GE data were acquired with: TE1/TR=4/43ms; 8echoes with monopolar gradientreadouts; echo-spacing=5ms; FA=15°; bandwidth=260Hz/px; acceleration-factor=4 (Sites-1/2/4/5)or2×1.5(Site-3);FOV=269×218×157mm3; scan-time~6min (Sites-1/2/4/5)and~4min(Site-3).ForSiemensdata, coilcombinationwasperformedusingacustomimplementationof Roe-mer’salgorithm,aspreviouslydescribed(Clarkeetal.,2019).Subject 6’ssingle-echoscanfailedtoreconstructusingRoemer’smethodondata fromthefirstvisitatSite-5soasum-of-squares(SoS)algorithmwasused forcoilcombinationforthatscaninstead.A0.7mmisotropicMP2RAGE scanwasusedforwithin-andcross-siteregistrationaspreviously de-scribed(Mouginetal.,2019).
2.2. QSMandR2∗dataprocessing
QSMmapsweregeneratedfromboththesingle-echoandmulti-echo T2∗-weighted datasetsusing theMulti-ScaleDipoleInversion(MSDI) algorithm,asimplementedinQSMboxv2.0(Acosta-Cabroneroetal., 2018). Briefly:first the local fieldwas estimated by phase unwrap-ping(Abdul-Rahmanetal.,2005)andmagnitude-weightedleastsquares phaseechofittingwasperformedonthemulti-echodata.Then, indepen-dentlyforbothsingle-echoandmulti-echodata,backgroundfieldwas removedusingtheLaplacianBoundaryValue(LBV)methodfollowed bythevariableSphericalMeanValue(vSMV)algorithmwithan ini-tialkernelradiusof40mm(Zhouetal.,2014;Acosta-Cabroneroetal., 2018).MSDIinversionwasestimatedwithtwoscales:theself-optimised lambdamethodwasusedonthefirstscalewithfilteringperformed us-ingakernelwith1mmradius,andonthesecondscalethe regulariza-tiontermwassetto𝜆=102.7(theoptimalvalueforin-vivo7Tdatasets foundin(Acosta-Cabroneroetal.,2018))andfilteringwasdonewitha kernelradiussetto5mm.Brain masksusedintheanalysiswere ob-tained with FSL’sBrain Extraction Tool(BET) with fractional inten-sitythreshold=0.2forsingle-echodata(Smith,2002).Thesewerethen mappedtomulti-echodataspace.
Onthemulti-echodata,QSMwasreconstructedsevenmoretimes: withonlyoneechoat19ms(matchingthesingle-echodata),withthe twoshortestechoes(i.e.TE1/TE2=4/9 ms),withthethreeshortest echoes(i.e.TE1/TE2/TE3=4/9/14ms),andsoforth.
Onthemulti-echodataset,voxel-wisequantitativemapsofR2∗were obtainedusingtheAuto-RegressiononLinearOperations(ARLO) algo-rithmforfastmonoexponentialfitting(Peietal.,2015).R2∗wasalso fit-tedfivemoretimes:withdatafromthefirstthreeechoes(TE1/TE2/TE3 =4/9/14 ms), then with the first four echoes (TE1/TE2/TE3/TE4 =4/9/14/19ms),andsoforth.
Table1
DetailsofthescannersandhardwareusedfortheUK7TNetwork’sTravellingHeadsstudy.
# Site Vendor Scanner Model Gradient Performance
Installation Date (Month-Year)
Software Version 1 Wellcome Centre for Integrative Neuroimaging (FMRIB),
University of Oxford
Siemens Magnetom 7T 70 mT m −1 Dec-2011 VB17A
200 mT m −1 ms −1
2 Cardiff University Brain Research Imaging Centre, Cardiff University
Siemens Magnetom 7T 70 mT m −1 Dec-2015 VB17A
200 mT m −1 ms −1
3 Sir Peter Mansfield Imaging Centre, University of Nottingham Philips Achieva 7T 40 mT m −1 Sep-2005 R5.1.7.0
200 mT m −1 ms −1
4 Wolfson Brain Imaging Centre, University of Cambridge Siemens Magnetom Terra 80 mT m −1 Dec-2016 VE11U
200 mT m −1 ms −1
5 Imaging Centre of Excellence, University of Glasgow Siemens Magnetom Terra 80 mT m −1 Mar-2017 VE11U
200 mT m −1 ms −1
2.3. Dataregistration
The neckwas cropped from the magnitude data with FSL’s “ro-bustfov” command (https://fsl.fmrib.ox.ac.uk/fsl/), applied to the single-echo data and the 4th echo of the multi-echo data. High-resolution single-echo and multi-echo templates were made from this cropped data for each subject with antsMultivariateTemplate-Construction2.sh from the Advanced Normalization Tools (ANTs, http://stnava.github.io/ANTs/).Twoapproacheswerecompared: trans-formationsusingrigidregistrationwithmutualinformationsimilarity metric(denotedas“Rigid” below)orusingsymmetricdiffeomorphic im-ageregistrationwithcross-correlationsimilaritymetric(denoted“SyN” below).Othersettingswerekeptthesameforbothapproaches:4steps with0.1gradientstepsize,maximumiterationsperstep1000,500,250 and100,smoothingfactorsperstepof4,3,2,and1voxels,andshrink factorsperstepof12×,8×,4×,and2×.Theresultingregistrationswere thenappliedtotheQSMandR2∗mapswhichwereaveragedtocreate single-echoandmulti-echoQSMandR2∗templatesforeachsubject.
2.4. SelectionofRegionsofInterest(ROIs)
Fiveregionsofinterest(SubstantiaNigra,RedNucleus,Caudate Nu-cleus,PutamenandGlobusPallidus)weremanuallysegmentedbased onthesubject-specificQSMtemplatesofthesingle-echodataregistered withthe“SyN” approach.Inordertominimizetheamountof segmenta-tionvariability,theseROIswerethenmappedtothesingle-echo“Rigid”, andmulti-echo“SyN” andmulti-echo“Rigid” spaceswithnearest neigh-bourinterpolationandvianon-linear registrationsobtainedwiththe defaultsettingsintheantsRegistrationSyN.shcommandinANTs.
MagnitudedatawerefirstregisteredtotheT1-weightedMP2RAGE scans(Rigidtransformations;MIsimilaritymetric)andlatertothe stan-dardT1“MNI152brain” (MontrealNeurologicalInstitute152)(using settingsinantsRegistrationSyN.sh)appliedtothesingle-echodataand tothe1stechoofthemulti-echodata.Theseregistrationswerethen usedtomapthe48probabilisticcorticalROIs,“cortical ROIs”,from theHarvard-OxfordCorticalAtlasandthe21probabilisticsubcortical ROIs,“subcorticalROIs”,fromtheHarvardOxfordSubcorticalAtlasto theQSMandR2∗templatespaces.
The T1-weighted MP2RAGE data was bias-field corrected, brain extracted, and segmented into five tissues using SPM (https://www.fil.ion.ucl.ac.uk/spm/): the grey matter (GM), white matter (WM)and cerebral-spinal fluid (CSF) volumes were mapped intoeachsubject-specificQSMtemplatespace.Then,using“fslmaths” from FSL (https://fsl.fmrib.ox.ac.uk/fsl/), the mapped cortical ROIs werethresholdedat10%ofthe“robustrange” ofnon-zerovoxelsand multipliedbytheGMtissuemapinordertoobtainGM-specificcortical ROIs.Themapped subcorticalROIs werethresholded at50%of the “robustrange” ofnon-zero voxels. Fromthese,anyCSF voxelswere excludedfromtheleftandrightCaudateNucleus,PutamenandGlobus Pallidus,andthevoxelsetsfromtheleftandrightcounterpartswere mergedtogether.
Fromthesingle-echoandmulti-echodata,average𝜒 andR2∗values wereextractedfromthemanualandatlas-basedROIsforallvolunteers andsessionsintemplatespace(valuesgiveninSupplementarymaterial 1).
Inordertoestimatewherethemagneticfieldisspatiallymore vari-able,field-mapswerefirstestimatedfromthemulti-echodatasets.ΔB0
was calculated from thebackground fieldremoval step of the QSM pipeline,andwasdefined,per-voxel,astheaveragedifferencebetween thefieldinavoxelanditsimmediatenearestneighbours.Theaverage ΔB0 wasextractedforeach ofthecorticalROIs andaveragedacross allsubjectsandsessions.ThenthecorticalROIsweredividedintotwo groupsbasedontheΔB0values:wherever|ΔB0|>0.005HztheROIwas groupedinto“highΔB0” regions,otherwiseitwasgroupedinto“low ΔB0” regions.ΔB0 wascalculatedfromthemulti-echopipelineonly, asdifferencestovaluescalculatedusingsingle-echodatawereminimal (Fig.1,Supplementarymaterial2).
WeexploredthreepossiblesusceptibilityreferenceregionsforQSM processing.TheaverageQSMsignalwasextractedfrom:
1 Awholebrainmask,“wb”;
2 Awhole-brainCSFmaskerodedintwosteps,“csf”;
3 AmanuallyplacedcylindricalROIintherightventricle,“cyl” (across allsubjectstheROIvolumewas104±11mm3).
2.5. Statisticalanalysis
StatisticalanalysiswasperformedwithR3.5.3(RCoreTeam,2013). Cross-siteanalysisusedonlythe1stscanatthe“home” sitealongwith thescansattheotherfoursites.Toobtainthewithinsubjectaverage, AVw,the𝜒 andR2∗valueswereaveragedwithinthesamesiteandacross thesitesandthenaveragedacrosssubjects:
AV𝑤= ∑𝑚 𝑖=1( ∑𝑛 𝑗=1𝑥𝑖𝑗∕𝑛) 𝑚 (1)
wherenisthenumberofsessions(𝑛=5forwithin-siteandcross-site) andmthenumberofsubjects.Relativereliabilitywasmeasuredusing theintra-classcorrelationcoefficient(ICC)fromwithin andcross-site dataindependentlyforeachROI(Weir,2005):
ICC= 𝑀𝑆𝑏−𝑀𝑆𝑤
𝑀𝑆𝑏+𝑀𝑆𝑤(𝑛−1) (2)
whereMSbandMSwarethebetween-subjectsandwithin-subjectsmean squarefromarandom-effects,one-wayanalysisofvariance(ANOVA) model.Intra-subjectabsolutevariabilityisassessedbymeasuringthe within-subject standard-deviation (SDw) calculated as (Santin et al., 2017): 𝑆𝐷𝑤= √∑ 𝑚 𝑖=1𝜎𝑖2 𝑚 with𝜎𝑖= √∑ 𝑛 𝑗=1(𝑥𝑖𝑗−̄𝑥𝑖)2 𝑛−1 (3) where𝑥𝑖= 𝑛 ∑
𝑗=1𝑥𝑖𝑗∕𝑛isthereplicateaverageforeachsubject.SDwwas computedusingwithin-sitedataandcross-sitedataindependently.
Simi-larly,cross-subjectvariabilitywascalculatedbymeasuringthe between-subjectstandard-deviation(SDb): 𝑆𝐷𝑏= √∑ 𝑚 𝑖=1 ∑𝑛 𝑗=1 ( 𝑥𝑖𝑗−𝑥𝑎𝑣𝑔)2 𝑛×𝑚−1 (4) where𝑥𝑎𝑣𝑔= 𝑚 ∑ 𝑖=1 𝑛 ∑
𝑗=1𝑥𝑖𝑗∕(𝑛×𝑚)isthemeasurementaverageacross sub-jectsandsessions.NotethatSDbiscomputedusingdatafromallsites.
StatisticaltestingonAVw,SDwandICCvaluesextractedfrom man-ualandtemplate-basedROIswasdonebyfirstfittingthedatawith nor-mal,log-normal,gammaandlogisticdistributions.Thegoodness-of-fit statisticsfortheparametricdistributionswerecalculatedandthe dis-tributionwhichshowedthelowestAkaikesInformationCriterion(AIC) wasthenusedonagenerallinearmodelfitting.Allmodelsincludedas fixedmaineffectsROInumberanddatatype(within-andcross-site). Whenevaluating thedataregistrationtype, themodelalsoincluded registrationtype(“Rigid” and“SyN”)asafixedmaineffect.When test-ingforQSMreference,themodelalsoincludedreferenceregion(“wb”, “csf”,and“cyl”)asafixedmaineffect.Onmulti-echoQSMdata,amodel wasfittedwhichalsoincludedthenumberofechoesprocessedasafixed maineffect.WhencomparingthemanualandsubcorticalROIs,theROI type(manualvs.atlas-based)wasalsoincludedasafixedmaineffect. Finally,onthedatafromthecorticalROIs,ROInumberwasreplaced with“highΔB0” and“lowΔB0” ROItypeascovariate.Ap-valueless than0.05wasconsideredsignificant.
2.6. Headorientation
WeinvestigatedtheeffectofheadorientationonQSMvariability. Sinceallourdatawasacquiredwithtransversesliceorientation,the slicenormalvectorintheacquiredimageswasparalleltoB0.Weused theper-subjectrotationmatricesoftheaffinetransformsfromthis ac-quiredtransversedatatoMNIspacetoestimatethez-axis rotation𝜃
withrespecttotheB0vector(0,0,1)(Fig.7(A)):
𝜃 =cos−1(𝑀 33
)
whereM33isthe3rdrow,3rdcolumnoftheaffinetransformmatrix. Twolinearmixedeffectsmodels,‘mod1’and‘mod2’,werefittedon thewithin-siteandcross-site𝜒 dataseparately:bothmodelsincluded site,ROI,andsessionnumberasfixedeffects,andsubjectnumberasa randomeffect,while‘mod2’alsoincluded𝜃 asafixedeffect.Foreach model,theR2wasevaluatedandbothmodelswerecomparedwitha chi-squaredtest.
Finally,from‘mod2’the𝜃 fitcoefficientswereusedtoestimate cor-rected𝜒-values basedonachosen standard𝜃 forallofthe measure-ments(𝜃𝑛𝑜𝑟𝑚=0.52radians).Then,newwithin-siteandcross-siteSDw ofthecorrected𝜒 were calculatedbasedonthesameapproachasin Section2.5.
3. Results
Fig. 1 shows QSM and R2∗ maps for one example subject. Basal ganglia structures, including Caudate Nucleus, Putamen and GlobusPallidus are clearlyvisible consistentwith previous findings (Langkammeretal.,2010;Wangetal.,2015;Bettsetal.,2016; Acosta-Cabroneroetal.,2016).Fig.2,Supplementarymaterial2highlightsthe differenceinQSMdataqualitywhenusingourchosenRoemercoil com-binationmethodvsusingsum-of-squarescoilcombination.
3.1. QSMandR2∗resultsandliterature
Fig.2comparesaverage𝜒 andR2∗valuescalculatedinthisstudy inthefivemanualROIsandthreecorrespondingatlas-basedsubcortical ROIsagainstliteratureranges.Thesingle-echo𝜒-valuesandmulti-echo
𝜒-valuesfromthisstudyareconsistentwithliteraturevaluesat1.5T,3T and7T.R2∗valuesfromthisstudyalsoagreecloselywith7Tliterature values.
3.2. ReproducibilityofQSMandR2∗
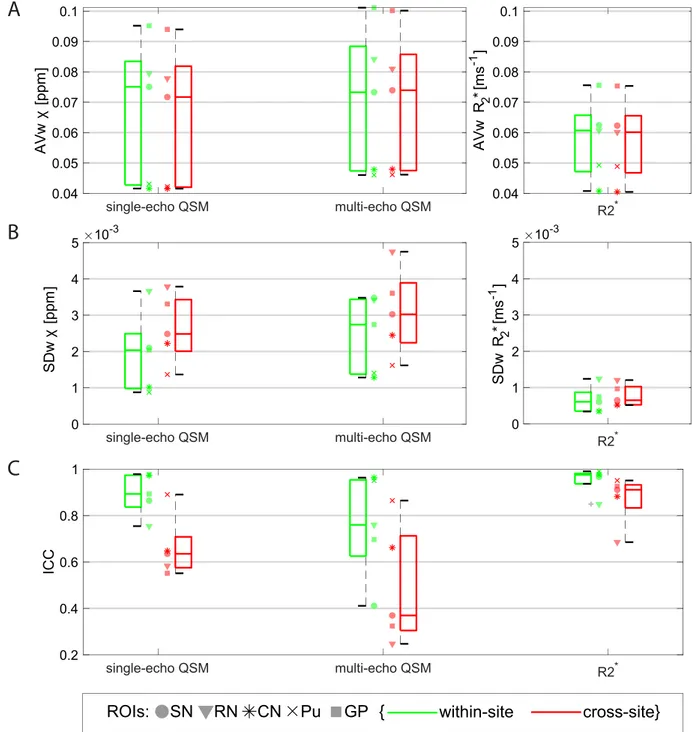
Fig.3showsboxplotsoverROIsofthewithin-andcross-siteAVw(A), SDw(B)andICC(C)valuesforthemanualROIsonthe𝜒 andR2∗maps. TheAVw fromR2∗mapsmeasuredonthesamesite issystematically highercomparedtotheAVwmeasuredacrosssites(p<0.0001;e.g.,on thePutamenROI,AVw_within-site=0.0493ms−1vsAVw_cross-site=0.0489 ms−1).Onthiscomparison,QSMdatadidnotshowsignificant differ-encesbetweenwithin-siteandcross-sitegroupsforeithersingle-echo data(p=0.053)ormulti-echodata(p=0.65).
FromallthedatainthemanualROIs,themedianSDwofsingle-echo
𝜒-values wasapproximately29%lowerthanformulti-echo𝜒-values
(p=0.0010).TherewasasignificantlylargerSDwcross-sitecompared towithin-siteonsingle-echo𝜒 data(p<0.0001;e.g.,onthePNROI, SDw_within-site=0.00088ppmvsSDw_cross-site=0.0014ppm),multi-echo
𝜒 (p=0.033)andonR2∗data(p<0.0001).
The ICC values for within- and cross-site R2∗ data (medianICC was0.98and0.91,respectively)werefoundtobesignificantlyhigher thanvaluesforsingle-echo𝜒 (medianICCwas0.89and0.64, respec-tively)orformulti-echo𝜒 (medianwasICC0.76and0.38,respectively) (p=0.00011).Forallmeasurements,theICCforcross-sitedatawas sig-nificantlylowerthanforwithin-sitedata(single-echoQSM:p<0.0001; multi-echoQSM:p=0.017;R2∗:p<0.0001).
SimilarstatisticswereobtainedforAVw,SDwandICCmeasurements intheAltas-basedcorticalROIs(Table2Supplementarymaterial2).
3.3. Registration
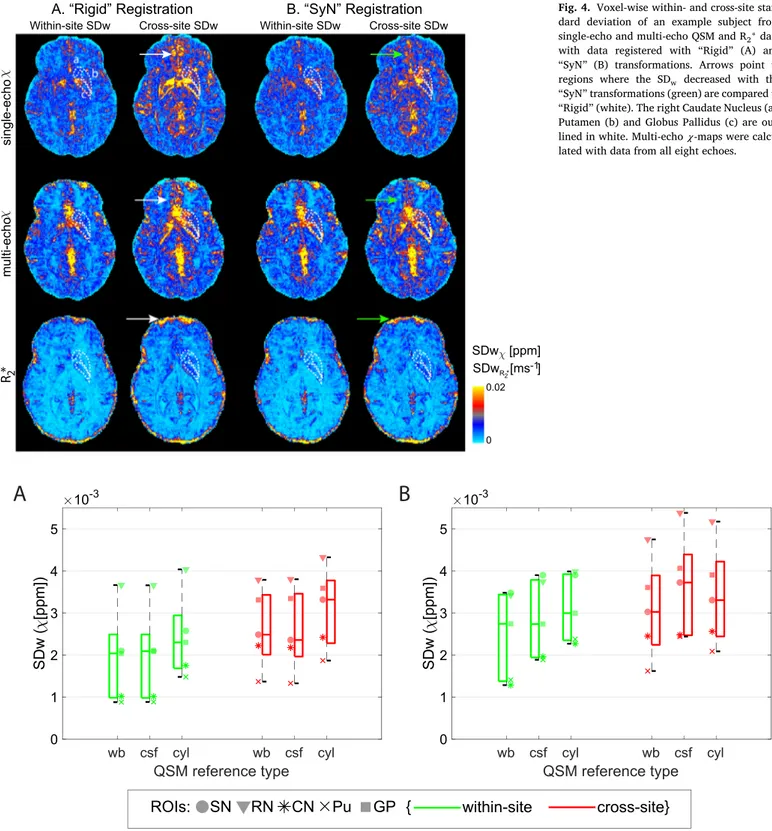
Thewithin-andcross-sitestandarddeviationsforoneaxialslicefrom oneexamplesubjectusing“Rigid” and“SyN” registrationapproaches areshowninFig.4.Generally,withbothregistrationmethods, within-siteandcross-siteSDwincreasesinveins,intheorbitofrontalregionsand atthecorticalsurface(whiteandgreenarrows,Figure4).Theseare ar-easassociatedwithlargeB0inhomogeneitiesandgradientnon-linearity. However,thereisadecreaseinthecross-sitestandarddeviationinthe orbitofrontalregionandclosetotheedgesofthecortexwhenusingthe “SyN” comparedtothe“Rigid” method(greenarrows,Fig.4).
OnthemanualROIsincreasedvariabilitywasobservedforR2∗on “Rigid” registereddatacomparedto“SyN” (SDw:p<0.0001;ICC:p= 0.013)butnotforsingle-echoormulti-echo𝜒:forexample,themedian cross-siteR2∗SDwfromallROIswas0.00066ms−1using“SyN” method and0.00086ms−1usingthe“Rigid” registrationmethod.Onthe atlas-basedcorticalROIs,thesamesignificanttrendwasobservedforR2∗and single-echo𝜒 data(Table2Supplementarymaterial2).
3.4. QSMreferencing
ToassesstheoptimalQSMsusceptibilityreferencing,Fig.5shows boxplotsoftheSDwforsingle-echoandmulti-echo𝜒 usingdifferent ref-erencingmethodsonthemanualROIs.Onsingle-echo𝜒 data,compared to“wb” correction(chosencorrectionforthisstudy),the“csf” reference didnotincreasesignificantlytheSDw(p=0.93)butwith“cyl” the me-dianSDwincreasedbyapproximately14%(p<0.0001).
Multi-echo𝜒 datashowedanincreaseinthemedianSDwof, respec-tively,11%(p=0.00096)and8%(p=0.00064)whenusing“csf” and “cyl” methodsforcorrection.Theeffectofvaryingthereferencingof QSMdatawassimilarinwithin-siteandcross-sitedata,forallmethods tested.
3.5. Multi-echoQSMandR2∗
OnaverageacrossallthemanualROIsandcomparedtosingleecho data,multi-echodata(usingtwoormoreechoes)showedasignificant 14%increaseoftheSDw(Fig.6)and3%oftheICC(Table1, Supplemen-tarymaterial2).Thissupportsthesingle-echoandmulti-echo𝜒 compar-isoninSection3.2.Similarbehaviourwasobservedontheatlas-based
Fig.1. Representative slicesof single-echo𝜒
(A)multi-echo𝜒 (B)andR2∗maps(C)froman
examplesubject templates.TherightCaudate Nucleus(a),Putamen(b)andGlobusPallidus (c)areshowningreen.Multi-echo𝜒 maps cal-culatedwithdatafromall8echoes.
Fig.2. MeanandstandarddeviationliteraturevaluesofQSM(A)andR2∗(B).Themeanandstandarddeviationresultsfromthisstudyarealsoplotted.Fordatawith
thesymbol‘§’thestandarderrorofthemeanwasoriginallyreportedandhasbeenrescaledbyreportedN.Shadedregionscorrespondtoliteraturedata.Multi-echo
𝜒-mapswerecalculatedwithdatafromalleightechoes(Choietal.,2019;Deistungetal.,2013;KeuKenetal.,2017;Barbosaetal.,2015;Schweseretal.,2011;
Fig.3. BoxplotsfromdataobtainedonthemanualROIsofwithin-andcross-siteAVw(A),SDw(B)andICC(C)ofsingle-echoandmulti-echoQSM,andR2∗.Data
fromeachROIisshownwithadifferentmarkerforeachboxplot.Legend:SN=SubstantiaNigra;RN:RedNucleus;CN:CaudateNucleus;Pu:Putamen;GP:Globus Pallidus.ThevariabilityinAVwreflectsthenaturalvariationofironcontentinsubcorticalstructuresinthehealthybrain.Multi-echo𝜒-mapswerecalculatedwith
datafromalleightechoes.
corticalROIs(Table2Supplementarymaterial2).OnthemanualROIs, thereisnosignificantdifferenceinAVw(p=0.79)orinSDw(p=0.11) from𝜒 computedfrommultipleechoes (i.e.2ormoreechoesinthe QSManalysis).Yet,in theatlas-basedcorticalROIs,long echotimes (i.e.using6ormoreechoes)showedanaverageincreaseof15.7%in SDw (p<0.0001)comparedtousing2to5echoesandadecreaseof 1.75%inICC(p<0.0001)(Table2Supplementarymaterial2).
InthemanualROIs,R2∗showednosignificantchangeinvariability acrossallROIswhendifferentnumberofechoeswereusedinthe fit-ting(SDw:p=0.11;ICC:p=0.95)(Fig.6(B))oronAVw(p=0.97). Intheatlas-basedcorticalROIs,thenumberofechoesusedinfluenced theaverageR2∗value(AV
w:p<0.0001),weaklyICC(p=0.021),but
notSDw(p=0.61).Tables1and2Supplementarymaterial2display individualstatistics.
3.6. ROIselection
There is a smallbut significanthigher average 𝜒 frommanually drawnROIscomparedtotheatlas-basedsubcorticalROIsinsingle-echo QSMdata (p < 0.0001;e.g. 0.042±0.009 ppmvs 0.033±0.010 ppm inthecaudatenucleus)andinmulti-echoQSMdata(p<0.0001;e.g. 0.048±0.010ppmvs0.038±0.011ppminthecaudatenucleus)(Fig.2). Similarly,forR2∗(e.g.0.041±0.004ms−1vs0.039±0.006ms−1inthe caudatenucleus)thisdifferencewassignificant(p<0.0001).In
addi-Fig.4. Voxel-wisewithin-andcross-site stan-dard deviation of an example subject from single-echoandmulti-echoQSMandR2∗data
with data registered with “Rigid” (A) and “SyN” (B) transformations. Arrows point to regions where the SDw decreased with the
“SyN” transformations(green)arecomparedto “Rigid” (white).TherightCaudateNucleus(a), Putamen(b)andGlobusPallidus(c)are out-linedinwhite.Multi-echo𝜒-mapswere calcu-latedwithdatafromalleightechoes.
Fig.5.BoxplotsfromdataobtainedonthemanualROIsofwithin-andcross-siteSDw(redandgreen,respectively)ofsingle-echoQSM(A)andmulti-echoQSM
(B)withawhole-brainreference(wb),withacsfreference(csf),andwithacylinderreference(cyl).DatafromeachROIisshownwithadifferentmarkerforeach boxplot.Legend:SN=SubstantiaNigra;RN:RedNucleus;CN:CaudateNucleus;Pu:Putamen;GP:GlobusPallidus.Multi-echo𝜒-mapswerecalculatedwithdatafrom alleightechoes.
tion,theSDwwas,onaverage,approximatelytwotimeshigherandthe ICClowerintheatlas-basedsubcorticalROIscomparedtothemanual ROIsinalldatasets(SDw:single-echoQSMp<0.0001,multi-echoQSM
p<0.0001,R2∗p<0.0001;ICC:single-echoQSMp=0.00021, multi-echoQSMp=0.0023,R2∗p=0.012).So,ROIselectionshouldbedone consistentlyinastudy.
3.7. Spatialdistributionofthemagneticfield
Ontheatlas-basedcorticalROIstheSDwincreasedbyapproximately 28%and88%on“highΔB0” regionscomparedto“lowΔB0” regionson multi-echo𝜒 andR2∗data,respectively(p=0.0011andp<0.0001) (Table2Supplementarymaterial 2).Similarly,ICCvalues decreased significantlyforsingle-echoandmulti-echo𝜒 andR2∗values.
Fig.6. BoxplotsfromdataobtainedonthemanualROIsofwithin-andcross-siteSDwformulti-echoQSM(A)andR2∗(B)calculatedwithdifferentnumberof
echoes.IncreasingtrendonthemedianSDwobservedwithincreasingnumberofechoeswasobservedontheQSMdata(dottedgreenandreddottedlinesin(A)).
Legend:SN=SubstantiaNigra;RN:RedNucleus;CN:CaudateNucleus;Pu:Putamen;GP:GlobusPallidus.
Table2
Within-sitetoCross-siteratioofthemedianSDwobtainedfromallfivemanually-definedROIsonsingle-echoandmulti-echo
𝜒 withoutandwith𝜃-correction.
Parameter within-site/cross-site median SD w (without 𝜃-correction) within-site/cross-site median SD w (with 𝜃 -correction)
Single-echo 𝜒 0.82 0.67
Multi-echo 𝜒 0.91 0.82
3.8. QSMvariabilitywithheadorientation
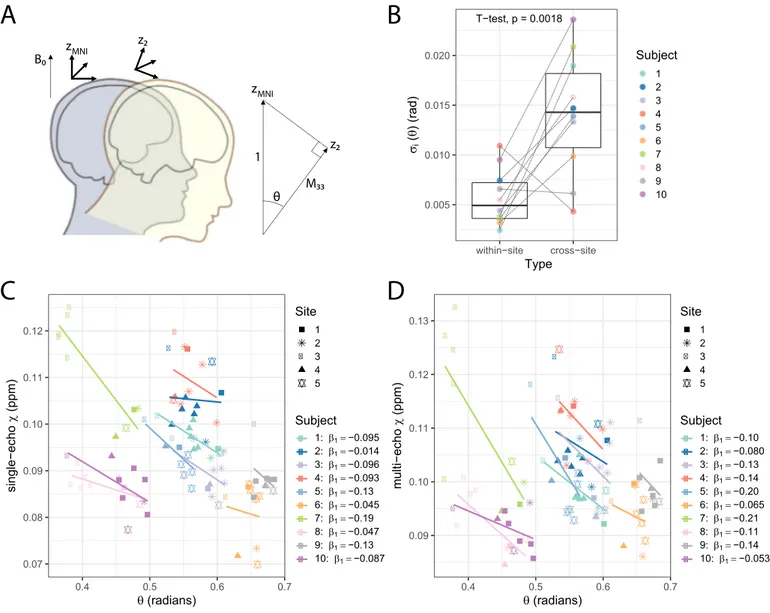
Whenanalysing𝜒 inthemanually-definedROIswithrespectto𝜃,
aconsistentnegativetrendwasobservedforallsubjects.Fig.7(C)and (D)showsanexamplefortheanalysisintheGlobusPallidusROI. Fit-tingalinearmodelon𝜒,with𝜃 andROIasfixedvariables,𝜃 showed
asignificantnegativecorrelationwithsingle-echo𝜒 (p<0.0001)and multi-echo𝜒 (p=0.015).
Inaddition,for𝜃,thewithin-siteSDwwasnearlyhalfofthe cross-siteSDw(0.011and0.028radians,respectively),indicatingthatthere waslargervariabilityinheadorientationacrosssites(subject-wise vari-abilityof𝜃,𝜎iofequation[3],isplottedinFig.7(B)).
Separately for within-site andcross-site 𝜒 data, we assessed the goodness-of-fit of a modelcontaining 𝜃 as an explanatory variable. Onsingle-echowithin-site data,themarginalR2 increasedfrom0.71 with‘mod1’to0.76with‘mod2’(whichincludes𝜃)(Chi-squaredtest,
p=0.041).Thecorrespondingcross-siteR2swere:0.77and0.80 (Chi-squaredtest,p=0.057).Onmulti-echodata,themarginalR2increased from0.75with‘mod1’to0.79with‘mod2’onwithin-site data (Chi-squared test,p=0.041)andmaintainedat0.79onbothmodelsfor cross-sitedata(Chi-squaredtest,p=0.14).
Fromthecorrected𝜒-valuesat𝜃norm,resultsshowaslightdecrease intheratioofwithin-sitetocross-siteSDw(Table2),butvariabilityof
𝜒 obtainedfromcross-sitedatawasstillhigherthanfromwithin-site(𝜒 with𝜃-correction,p=0.01;uncorrected𝜒,p<0.0001(Section3.2)). For multi-echodata, theSDw obtained from the corrected 𝜒-values
weresimilaronwithin-sitecomparedtocross-site(𝜒 with𝜃-correction,
p=0.11;uncorrected𝜒,p=0.033(Section3.2)). 4. Discussion
Inthispaper,thereproducibilityofQSM𝜒 andR2∗measurements incorticalandsubcorticalregionsofthebrainwasassessedforthefirst timeinamulti-sitestudyat7Tfortwodifferentprotocols(asingle-echo 0.7mmisotropicT2∗-weightedscananda1.5mmisotropicmulti-echo T2∗-weightedscan),usingthreedifferentscannerplatformsprovidedby twodifferentvendors.
Previousstudiesat1.5Tand3Thaveshowngoodreproducibilityfor
𝜒 andR2∗dataacquiredonthesamescanneroracrosssites(1.5Tand 3T)(Hinodaetal.,2015;Cobzasetal.,2015;Dehetal.,2015;Linetal., 2015;Santinetal.,2017;Fengetal.,2018;Spincemailleetal.,2019). IntermsofQSManddependingonthesubcorticalregion,intra-scanner 3TrepeatabilitystudiesreportanSDwof0.002–0.005ppm(Fengetal., 2018)and0.004–0.006ppm(Santinetal.,2017),andthecross-site3T studybyLinetal.(2015)reportedanaverageSDWof0.006–0.010ppm. Weobservedawithin-siteSDwrangeof0.0009–0.004ppmand cross-siteSDwrangeof0.001–0.005ppmat7T.Comparedto3Tstudies,this isa2.0–5.3folddecreaseinthewithin-siteSDw,anda2.1–4.8decrease inthecross-siteSDw.
Therangeofwithin-siteSDwvaluesforR2∗wasaveraged0.0003– 0.001ms−1inourstudyandthecross-siteSD
wrangewas0.0005–0.001 ms−1. Thecross-site valuesarecomparabletothesame sitereported
Fig.7. InQSM,itisassumedthatthemacroscopicsusceptibilityinanimagingvoxelisisotropic.However,ithasbeenshownthatthisassumptionistoosimplistic forsingleheadorientationQSMmethods,complicatingtheinterpretationoftheQSMresults(Lietal.,2017).Weinvestigatedtheeffectofheadorientationon QSMestimationinourdata:(A)ConsideringthatdatawasallacquiredinthetransverseplanewithB0perpendiculartotheimagingslice,subjectshadavariable
headrotation𝜃 withrespecttoB0.Toestimate𝜃,weusedMNIspaceasacommonheadorientation(zMNI)acrossallscans.FromtheaffineregistrationmatrixM
convertingacquireddataintoMNIspace,theangleofrotationfromtherotatedz-axis,z2,willbegivenby𝜃 =cos−1(𝑀33)whereM33isthe3rdrow,3rdcolumnof
theaffinetransformmatrix.(B)Subject-wisewithin-siteandcross-site𝜎imeasurementson𝜃.(C)Single-echoand(D)multi-echoscatterplotsof𝜒 measurements
accordingto𝜃 ontheGlobusPallidusmanualROI.Foreachsubjectalineartrendisalsoplottedandthefitcoefficientsaregivenintheplotlegend.Datafromeach siteisdisplayedwithadifferentsymbol.Multi-echo𝜒-mapswerecalculatedwithdatafromalleightechoes.
at 3T: 0.0005–0.0009ms−1 (Feng etal., 2018), 0.0006–0.002 ms−1 (Santinetal.,2017).Comparedtothelatter,ourcross-siteresultsshow a1.1–3.4improvementoverthesamebrainregionsinR2∗variability.
ThestudyfromHinodaetal.(2015)measuredQSMreproducibility at1.5Tand3Tbyscanningsubjectstwiceoneachofthescanners.They showedthereisa1.1–2.1folddecreaseintheupperandlowerlimitsin Bland-Altmanplotsat3Tcomparedto1.5T,whichisinlinewiththe expectedsignal-to-noiseratio(SNR)increasebetweenthesetwofield strengths(Edelsteinetal.,1986;Wardlawetal.,2012).Comparedto 3Treports,thereis,onaverage,animprovementofapproximately 3-foldinourQSMandR2∗7Tmeasurementsofreproducibility.Thisis inlinewiththeexpectedSNRincreaseinbrainimagingfrom3Tto7T (Pohmannetal.,2016).
Thehighervaluesofcross-siteSDwcomparedtothewithin-site val-uesinourstudymaybeattributedtothedifferentgradientsystemsand automaticdistortioncorrectionsusedinthedifferentscannerplatforms
andtothedifferentapproachestoshimming,whichleadtodifferent ge-ometricaldistortionsanddropoutregions(Figs.3and4Supplementary material2)(Yangetal.,2010).Inourstudyweverifiedthatnotonly regionsinthecortexclosetoair-tissueinterfacesshowdifferencesinB0 acrossscanners,butalsolargesubcorticalregionssuchastheCN,the PuandtheGPROIs.
We alsoshowedthat theuse of anon-linear registrationmethod (here,“SyN” inANTs)significantlyreducedtheinter-scanner variabil-ityofcorticalQSMcomparedtorigid-bodyregistration,indicatingthat differences ingeometricdistortionacrossscanners werepresent.The R2∗resultsforbothcorticalandsubcorticalstructuresalsoshow sig-nificantlylowerinter-scannervariabilitywhenanon-linearregistration wasused.ForQSM,highercross-sitevariabilitymayalsobeattributed totheheadorientationwithrespecttoB0(Lancioneetal.,2017;Lietal., 2017).Ourresultsindicateheadorientationvariedsomewhatbetween scansandtherewasgreatervariationbetweensitesthanintra-site;we
alsoobservedaconsistentnegativecorrelationbetween𝜒 andhead ori-entation(𝜃).Usingalinearmodeltoattempttoregress-outtheeffects ofheadrotationimprovedthereproducibilityofbothwithin-siteand cross-sitedata. Italsoreduced thepenaltyformulti-site scanningvs single-sitescanning,butnotcompletely.
Inthisstudy, thereproducibility ofQSMusingsingle-echo, high-resolution(0.7 mm isotropicresolution; TE= 20ms)andmulti-echo standard-resolution(1.4 mm isotropicresolution; TE= 4,9, 14,19, 24,29,34and39ms)protocolswerecompared,andtheresultsshow that the multi-echo QSM data has a significantly higher variability thansingle-echoQSM.Althoughmulti-echophasedatahasbeen com-binedwithamagnitude-weightedleastsquaresregressionofphaseto echotime,itmaycarryinconsistentphaseaccumulationacrossechoes thatwereinconsistentlyunwrapped.Thisisalsoparticularlyrelevant forregionsoflargefieldinhomogeneities,wherephaseaccumulation could exceed±𝜋 between neighbouringvoxels, resulting in multiple phasewraps,whichtheunwrappingalgorithmmaybeunableto cor-rect(Croninetal.,2017).Thishasalsobeenverifiedontheanalysisof QSMdatafromthecorticalROIsreconstructedwithdifferentnumbersof echoes:longechotimesincreasesignificantlythetest-retestvariability. Alternatively,phaseunwrappingcanbecompletelyomittedby calculat-ingthephasechangeoverallecho-timesusingacomplexfittingroutine (Liuetal.,2012;Liuetal.,2013)(fit_ppm_complex.mofMEDItoolbox) andcalculatingtheLaplaciandirectlyfromtheresulting,stillwrapped, temporalphasechangedata(Schweseretal.,2013).
It has been shown that resolution influences QSM estimation. Haacke et al. (2015) showed on phantom data that by decreasing slice thicknessfrom 3mm to0.5mm partialvolume effects are re-duced,absolutesusceptibilityvaluesdecrease,andaccuracyimproves up to 25%. Similar findings on in vivo brain data are reported in Sunetal.(2017)(single-echodata)andKarsaetal.(2019)(multi-echo data).Ourresultssupportthesuggestionthatareductionofpartial vol-umeeffectsathigher-resolutionmightplayaroleindecreasingboth test–retestandcross-sitevariabilityonthesingle-echohigh-resolution datacomparedtothemulti-echolow-resolutiondata.
R2∗ values show significantly lower variability, reflected in the higherICCwithinandacross-sitescomparedtocorrespondingvaluesfor
𝜒 insubcorticalareas.Thismaybebecausethe𝜒 estimationisglobally moresensitivetobackgroundfieldinhomogeneitycomparedto magni-tudedata.However,inorbitofrontalandlowertemporalregionslarge through-planefieldvariationsfromtissue-airinterfacesdominatethe fieldchangesandproducedropoutsinthesignalmagnitudeandincrease thebackgroundphase,affectingbothQSMandR2∗mapsbyincreasing variabilityanddecreasingICCacrosssites.Inaddition,becauseoflarge fieldvariations,theestimatedcorticalR2∗increasessignificantlywhen lateechotimes areusedforthefitting,butthiseffect isnotseen in subcorticalareas.
QSM can only determine relative susceptibility differences (Cheng et al., 2009) and most approaches to calculation of sus-ceptibilityfrommeasuredphaseyieldmapsinwhichtheaveragevalue ofsusceptibilityiszerooverthemaskedimagingvolume.Issuesrelated toreferencingofQSMdatahavebeeninvestigated(Fengetal.,2018; Straubetal.,2017),withaimoffindingareferenceregionortissueto whichallsusceptibilityvaluesarereferredthatproduceswell-defined andreproducible values of susceptibility. Here we investigated how thechoiceofreferenceaffectsthewithin-siteandcross-sitevariability ofmeasuredsusceptibilityatultra-high-field.Wetestedthreeaccepted reference regions: total whole brain signal, “wb”, whole brain CSF erodedinordertoexcludeanypialorskullsurfaces,“csf”,anda manu-allyselectedcylindricalROIintherightventricle,“cyl”.Wefoundthat the“cyl” referencinggenerallyincreasedthevariabilityofthecross-site andwithin-sitesusceptibilitymeasurementsincorticalandsubcortical ROIs compared to “wb” referencing. In the case of the multi-echo acquisitionthe“csf” referencingalsoincreasedthevariabilityrelative to“wb” data. This maybe becauseof imprecisionin systematically obtainingaverageQSMsignalfromCSFregions.Referencingusinga
small ROI inthe ventriclesmightbe prone tosubjectivitygiven the natural variationinventricle sizeinhealthysubjectsandindisease. Furthermore,theventriclesdonotcontainpureCSF:theyaretraversed bybloodvesselswithadifferent𝜒 (Sullivanetal.,2002).Thismakes whole-brainreferencingattractive inmanysituations. Yet,inpatient cohorts wherethereis substantialironloadin subcorticalstructures (SnyderandConnor,2009),wholebrainreferencingmightnotbean appropriate approach. In this case, the more appropriate approach willbetochooseasmallreferenceregionwhichshowsnochangesin theparticulardiseasetobe“zero” susceptibility ata costofaslight increaseinSD.
Toeliminateoperator-dependentbiasinsegmentationwhen deter-miningbrainstructures,wehaveanalyseddatausingbothmanualand atlas-based segmentation.Fromourresults,manualROIsshowed sig-nificantlylowervariabilitycomparedtoatlas-basedmethods.This hap-pensbecauseofimprecisioninregistrationbetweenMNIandsubject spaceaswellastheempiricalthresholdingthatwaschosentoobtain thesubcorticalROIs.Thisresultedin largerROIsbeingderivedfrom theatlas-basedmethodcomparedtothemanualmethod(Wilcoxontest, CN:p=0.014;Pu:p=0.00018;GP:p=0.0010).Overestimationofthe re-gion(Fig.5Supplementarymaterial2)meantincludingboundaryvoxels that,generally,havelowersusceptibility(white-matter,forexample), loweringtheaverage𝜒 andR2∗.However,traditionalmanualdrawing ofROIsforcohortstudiesisdifficult,timeconsumingandpotentially unsuitableasitbiasesresultstowardsparticularcohorts(Collinsetal., 2003)soitmaynotalwaysbethemostappropriateapproach.
Inthisstudy,harmonizedprotocolswereproducedforallfive scan-nerswithoutanysignificantsequencealterations,asaproduct3D gra-dientecho(GE)sequencewasreadilyavailableonallsystems(the prod-uct‘gre’sequencefromSiemensandtheproduct‘ffe’fromPhilips).The protocolsandanexampledatasetareprovidedin(Clarke,2018). Gener-ally,wealsoreliedonthevendors’reconstruction.However,attheend ofthereconstructionpipelineoftheSiemenssystemsweadopteda dif-ferentcoilcombination approachbasedonRoemeretal.(1990)and Walsh et al.(2000), tomatch theSENSE approachimplemented on Philipsscanners(Pruessmannetal.,1999;Robinsonetal.,2017).This was requireddue toartifactsappearingon phaseimagesin Siemens datareconstructedwiththevendor’spipeline,suchasopen-endedfringe linesorsingularities(Chavezetal.,2002)(Fig.2,Supplementary mate-rial2).ThesereducetheconsistencyoftheQSMresults(Santinetal., 2017).However,othercoil combinationmethods suchasaselective channelcombinationapproach(Veghetal.,2016)ortheCOMPOSER (COMbiningPhasedatausingaShortEcho-timeReferencescan)method (Bollmannetal.,2018) havealsobeenshown toreduce open-ended fringelinesandnoiseinthesignalphase.Forfutureinvestigations,the rawk-spacedatacollectedfromallsitesinthisstudyhasbeenstored andisavailablefromtheauthorsuponrequest.
OntheQSMreconstruction,animperfect background field filter-ingcaninfluencethereproducibilityofQSMdata.Forthisreason,we performedbackgroundremovalintwostepsasimplementedin QSM-boxv2.0andasdescribedin(Acosta-Cabroneroetal.,2018):firstwith theLBVapproachandthenfollowedbythevSMVmethod. Regular-izedfield-to-susceptibilityinversionstrategieshavebeenproposed to overcometheill-posedprobleminQSMwithdataacquiredatasingle headorientation(deRochefortetal.,2010).WeoptedtousetheMSDI implementationinQSMboxv2.0(Acosta-Cabroneroetal.,2018),asit rankedtop-10inallmetricsofthe2016QSMReconstructionChallenge (Langkammeretal.,2018),andalsonowincludesanewself-optimized local scale,whichresultsin abetterpreservationofphasenoise tex-ture andlowsusceptibilitycontrast features.Onthesecondstep,the regularizationfactor,𝜆,usedforthisstudywassetto102.7,as recom-mendedbyAcosta-Cabroneroetal.(2018)basedonanL-curveanalysis (Hansenetal.,1993)withhigh-resolution7Tdata.
Thestandardmulti-echoGEprotocolinthisstudywasproducedas aharmonisedsequencethatcouldbeperformedatallsites,witha rel-ativelyshortacquisitiontime(approximately5min),whichis
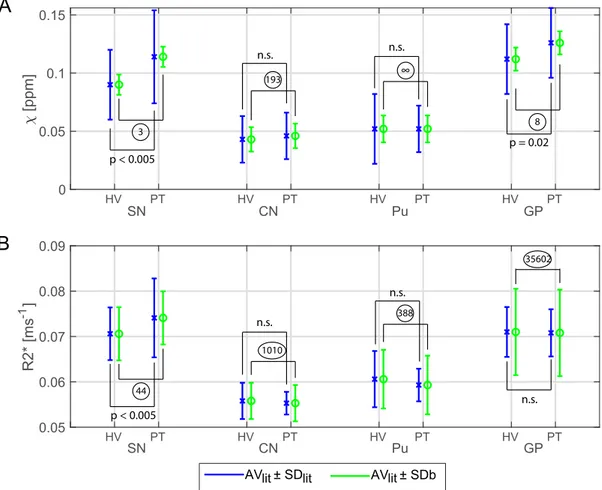
accept-Fig.8. Illustrationofthefeasibilityofa7TQSMclinicalstudy.𝜒 (A)andR2∗(B)forfourROIs(SubstantiaNigra,SN;CaudateNucleus,CN;Putamen,Pu;Globus
Pallidus,GP)fromhealthyvolunteer(HV)andsynthetic“patient” (PT)dataforwhichAVlitandSDlitwereobtainedfromLangkammeretal.(2016)andSDbwere
calculatedfromdataofthecurrentstudy.AVlitvaluesforR2∗werelinearlyscaledto7TaccordingtoYaoetal.(2007).BluebarsshowtheAVlit±SDlitandgreen
barstheAVlit±SDb.StatisticaldifferencesbetweenHVandPTobtainedfromLangkammeretal.(2016)arealsoshown.ForeachROI,thesamplesizethatwould
havebeenneededtogiveasignificanteffectwascalculatedfromthegroupmeans,AVlit,andtheSDbperROIandisshownincircles.Multi-echo𝜒-mapswere
calculatedwithdatafromalleightechoes.
ableforpatientstudies.Mid-brainstructuressuchasthebasalganglia areidentifiable,yetsmallsubcorticalstructureswillsufferfrom partial-volumeeffects,whichcouldbealimitationofthisharmonizedprotocol forfutureultra-highfieldmulti-sitestudies.
Atultra-highfieldtherecanbevariationsinSNRinmagnitudedata causedbythevariableB1+acrossthebrain(Abduljaliletal.,2003).As R2∗ isestimatedvoxel-wise,andasthereisalwaysareasonableSNR inthemagnitudedata,thecoefficientintheexponentialfitthat esti-matesR2∗willnotbestronglyaffectedbyvariationsinB1+.QSMmaps areestimatedfromfilteredphasedatawhichisnotstronglyaffectedby transmitB1+ variations.Onourdata,nocorrelationswerefound be-tweenQSMorR2∗mapsandB1+flip-anglemapscollectedinthesame session(Fig.6Supplementarymaterial2).
Tominimiseconfoundingeffectsofageorpathology,weassessed test-retestreliabilityandcross-sitevariabilitywithtenhealthyyoung subjects.Thecross-site,between-subjectstandard-deviation,SDb, mea-suredinthisstudywasevaluatedtogetherwithhealthyandParkinson’s diseasedatafrom(Langkammeretal.,2016).Apoweranalysisrevealed asamplesizethatwouldhavebeenrequiredforamulti-site clinical studyineachROIasshowninFig.8.ForallthesignificantROIsthe numberofsubjectsthatwouldhavebeenrequiredpergroupwaslessor equalto44.Sincethisislowerthanthesamplesizewehaveusedinthis study(90healthyvolunteerscans)andthenumbersintheLangkammer study(66patientsand58controlsubjects),itgivesstrongconfidence offeasibilityforfuture7TQSMclinicalstudies.
5. Conclusion
We investigated test-retest reliabilityand reproducibility of T2∗ -weightedimagingprotocolsatultra-highfieldMRI.Consideringthe in-creaseinsusceptibilityeffectsat7T,wefoundthatvariabilityof mea-surementsofQSM𝜒 andR2∗inthebasalgangliaarereducedcompared toreportsfromlowerfieldstrengths,1.5Tand3T.Scannerhardware differencesgivemoremodestimprovementsforcorticalmeasurements ofQSM𝜒 andR2∗.Multi-echoprotocolsdonotbenefitfromlongecho timesastheseincreasetheimprecisionintheestimationofQSM.We suggestthat7TMRIissuitableformulticentrequantitativeanalysesof brainiron,inhealthanddisease.
Centrefunding
TheWellcomeCentreforIntegrativeNeuroimagingissupportedby corefundingfromtheWellcomeTrust(203139/Z/16/Z).
Cardiff UniversityBrain ResearchImagingCentreissupportedby theUKMedicalResearchCouncil(MR/M008932/1)andtheWellcome Trust(WT104943).
Thisresearchwasco-fundedbytheNIHRCambridgeBiomedical Re-searchCentre.Theviewsexpressedarethoseoftheauthor(s)andnot necessarilythoseoftheNHS,theNIHRortheDepartmentofHealthand SocialCare.TheCambridge7TMRIfacilityisco-fundedbythe Univer-sityofCambridgeandtheMedicalResearchCouncil(MR/M008983/1).
Individualfunding
CTRisfundedbyaSirHenryDaleFellowshipfromtheWellcome TrustandtheRoyalSociety[098436/Z/12/B].JBRissupportedbythe WellcomeTrust(WT103838).
Creditauthorstatement
CatarinaRua:Conceptualization,Methodology,Formalanalysis, In-vestigation,Writing– OriginalDraft,Writing– Review&Editing
WilliamT Clarke: Conceptualization, Methodology, Investigation, Writing– Review&Editing
IanDDriver:Conceptualization,Methodology,Investigation, Writ-ing– Review&Editing
Olivier Mougin: Conceptualization, Methodology, Investigation, Writing– Review&Editing
AndrewT.Morgan:Conceptualization,Methodology,Investigation. StuartClare:Conceptualization, Methodology,Project administra-tion,Fundingacquisition.
SusanFrancis:Conceptualization,Methodology,Project administra-tion,Fundingacquisition.
KeithMuir:Conceptualization,Methodology,Projectadministration, Fundingacquisition.
RichardWise:Conceptualization,Methodology,Project administra-tion,Fundingacquisition.
AdrianCarpenter:Conceptualization,Methodology,Project admin-istration,Fundingacquisition.
GuyWilliams:Conceptualization,Methodology,Project administra-tion,Fundingacquisition.
JamesBRowe:Conceptualization,Methodology,Project administra-tion,Writing– Review&Editing,Fundingacquisition.
RichardBowtell:Conceptualization,Methodology,Project adminis-tration,Writing– Review&Editing,Fundingacquisition.
ChristopherTRodgers:Conceptualization,Methodology,Project ad-ministration,Investigation,Writing– Review&Editing,Funding acqui-sition.
Acknowledgements
TheUK7TNetworkandthisworkwasfundedbytheUK’sMedical ResearchCouncil(MRC)[MR/N008537/1].WethankDr.Julio Acosta-CabroneroformakingtheQSMboxpubliclyavailableandProf.David PorterforhissupportintheUK7Tnetwork.
Supplementarymaterials
Supplementarymaterialassociatedwiththisarticlecanbefound,in theonlineversion,atdoi:10.1016/j.neuroimage.2020.117358. References
Abdul-Rahman, H., Gdeisat, M., Burton, D., Michael, L., 2005. Fast three-dimensional phase-unwrapping algorithm based on sorting by reliability following a non- continuous path. App. Optic. 46, 6623–6635. doi: 10.1117/12.611415 .
Abduljalil, A.M., Schmalbrock, P., Novak, V., Chakeres, D.W., 2003. Enhanced gray and white matter contrast of phase susceptibility ‐weighted images in ultra ‐high ‐field mag- netic resonance imaging. J. Magn. Resonanc. Imaging: Off. J. Int. Soc. Magn. Reso- nanc. Med. 18 (3), 284–290. doi: 10.1002/jmri.10362 .
Acosta-Cabronero, J., Milovic, C., Mattern, H., Tejos, C., Speck, O., Callaghan, M.F., 2018. A robust multi-scale approach to quantitative susceptibility mapping. NeuroImage 183, 7–24. doi: 10.1016/j.neuroimage.2018.07.065 .
Acosta-Cabronero, J., Betts, M.J., Cardenas-Blanco, A., Yang, S., Nestor, P.J., 2016. In Vivo MRI mapping of brain iron deposition across the adult lifespan. J. Neurosci. 36, 364–374. doi: 10.1523/JNEUROSCI.1907-15.2016 .
Acosta-Cabronero, J., Williams, G.B., Cardenas-Blanco, A., Arnold, R.J., Lupson, V., Nestor, P.J., 2013. In vivo quantitative susceptibility mapping (QSM) in Alzheimer’s disease. PLoS One 8, e81093. doi: 10.1371/journal.pone.0081093 .
Barbosa, J.H.O., Santos, A.C., Salmon, C.E.G., 2015. Susceptibility weighted imaging: dif- ferentiating between calcification and hemosiderin. Radiol. Brasil. 48 (2), 93–100. doi: 10.1590/0100-3984.2014.0010 .
Betts, M.J., Acosta-Cabronero, J., Cardenas-Blanco, A., Nestor, P.J., Düzel, E., 2016. High- resolution characterisation of the aging brain using simultaneous quantitative sus- ceptibility mapping (QSM) and R2 ∗ measurements at 7 T. Neuroimage 138, 43–63.
doi: 10.1016/j.neuroimage.2016.05.024 .
Bilgic, B., Pfefferbaum, A., Rohlfing, T., Sullivan, E.V., Adalsteinsson, E., 2012. MRI es- timates of brain iron concentration in normal aging using quantitative susceptibility mapping. Neuroimage 59 (3), 2625–2635. doi: 10.1016/j.neuroimage.2011.08.077 . Blazejewska, A.I., Al-Radaideh, A.M., Wharton, S., Lim, S.Y., Bowtell, R.W., Constanti-
nescu, C.S., Gowland, P.A., 2015. Increase in the iron content of the substantia nigra and red nucleus in multiple sclerosis and clinically isolated syndrome: a 7 Tesla MRI study. J. Magn. Reson. Imaging 41, 1065–1070. doi: 10.1002/jmri.24644 . Bollmann, S., Robinson, S.D., O’Brien, K., Vegh, V., Janke, A., Marstaller, L., Reutens, D.,
Barth, M., 2018. The challenge of bias ‐free coil combination for quantitative susceptibility mapping at ultra ‐high field. Magn. Reson. Med. 79 (1), 97–107. doi: 10.1002/mrm.26644 .
Chavez, S., Xiang, Q., Li, A., 2002. Understanding phase maps in MRI: a new cutline phase unwrapping method. IEEE Trans. Med. Imaging 21, 966–977. doi: 10.1109/TMI.2002.803106 .
Cheng, Y.-C.N., Neelavalli, J., Haacke, E.M., 2009. Limitations of calculating field dis- tributions and magnetic susceptibilities in MRI using a Fourier based method. Phys. Med. Biol. 54 (5), 1169–1189. doi: 10.1088/0031-9155/54/5/005 .
Choi, S., Li, X., Harrison, D.M., 2019. The impact of coregitration of gradient re- called echo images on quantitative susceptibility and R2 ∗ mapping at 7T. bioRxiv.
doi: 10.1101/529891 .
Clarke, W.T., 2018. UK7T Network harmonized neuroimaging protocols. https://ora.ox.ac.uk/objects/uuid:55ca977f-62df-4cbf-b300-2dc893e36647 . Clarke, W.T., Mougin, O., Driver, I.D., Rua, C., Morgan, A., Asghar, M., Clare, S., Fran-
cis, S., Wise, R., Rodgers, C.T., Carpenter, T.A., Muir, K., Bowtell, R., 2019. Multi-site harmonization of 7 Tesla MRI neuroimaging protocols. NeuroImage 206, 116335. doi: 10.1016/j.neuroimage.2019.116335 .
Cobzas, D., Sun, H.F., Walsh, A.J., Lebel, R.M., Blevins, G., Wilman, A.H., 2015. Subcorti- cal gray matter segmentation and voxel-based analysis using transverse relaxation and quantitative susceptibility mapping with application to multiple sclerosis. J. Magn. Reson. Imaging 42 (6), 1601–1610. doi: 10.1002/jmri.24951 .
Collins, D.L. , Zijdenbos, A.P. , Paus, T. , Evans, A.C. , 2003. Use of registration for cohort studies. Med. Image Regist. .
Cronin, M.J. , Wang, N. , Decker, K.S. , Wei, H. , Zhu, W.Z. , Liu, C. , 2017. Exploring the origins of echo-time-dependent quantitative susceptibility mapping (QSM) measure- ments in healthy tissue and cerebral microbleeds. Neuroimage 149, 98–113 . de Rochefort, L., Liu, T., Kressler, B., Liu, J., Spincemaille, P., Lebon, V., Wu, J., Wang, Y.,
2010. Quantitative susceptibility map reconstruction from MR phase data using Bayesian regularization: validation and application to brain imaging. Magn. Reson. Med. 63, 194–206. doi: 10.1002/mrm.22187 .
Deh, K., Nguyen, T.D., Eskreis-Winkler, S., Prince, M.R., Spincemaille, P., Gauthier, S., Kovanlikaya, I., Zhang, Y., Wang, Y., 2015. Reproducibility of quantitative suscepti- bility mapping in the brain at two field strengths from two vendors. J. Magn. Reson. Imaging 42, 1592–1600. doi: 10.1002/jmri.24943 .
Deistung, A., Schäfer, A., Schweser, F., Biedermann, U., Güllmar, D., Trampel, R., Turner, R., Reichenbach, J.R., 2013. High-resolution MR imaging of the human brainstem in vivo at 7 Tesla. Front. Hum. Neurosci. 7, 710. doi: 10.3389/fn- hum.2013.00710 .
Düzel, E., Acosta ‐Cabronero, J., Berron, D., Biessels, G.J., Björkman ‐Burtscher, I., Bottlaen- der, M., Bowtell, R., Buchem, M.V., Cardenas ‐Blanco, A., Boumezbeur, F., Chan, D., 2019. European Ultrahigh ‐Field Imaging Network for Neurodegenerative Diseases (EUFIND). Alzheimer’s Dementia: Diagn. Assessm. Dis. Monit. 11 (1), 538–549. doi: 10.1016/j.dadm.2019.04.010 .
Duyn, J.H., van Gelderen, P., Li, T.Q., de Zwart, J.A., Koretsky, A.P., Fukunaga, M., 2007. High-field MRI of brain cortical substructure based on signal phase. Proc. Natl. Acad. Sci. 104 (28), 11796–11801. doi: 10.1073/pnas.0610821104 .
Edelstein, W.A., Glover, G.H., Hardy, C.J., Redington, R.W., 1986. The intrinsic signal ‐to ‐noise ratio in NMR imaging. Magn. Resonanc. Med. 3 (4), 604–618. doi: 10.1002/mrm.1910030413 .
Ehses, P., Brenner, D., Stirnberg, R., Pracht, E.D., Stöcker, T., 2019. Whole ‐brain B1 ‐mapping using three ‐dimensional DREAM. Magn. Resonanc. Med. 82 (3), 924– 934. doi: 10.1002/mrm.27773 .
Eskreis ‐Winkler, S., Zhang, Y., Zhang, J., Liu, Z., Dimov, A., Gupta, A., Wang, Y., 2017. The clinical utility of QSM: disease diagnosis, medical management, and surgical planning. NMR Biomed. 30 (4), e3668. doi: 10.1002/nbm.3668 .
Feng, X., Deistung, A., Reichenbach, J.R., 2018. Quantitative susceptibility mapping (QSM) and R2 ∗ in the human brain at 3 T: Evaluation of intra-scanner repeatabil-
ity. Z. Med. Phys. 28, 36–48. doi: 10.1016/j.zemedi.2017.05.003 .
Gelman, N., Gorell, J.M., Barker, P.B., Savage, R.M., Spickler, E.M., Windham, J.P., Knight, R.A., 1999. MR imaging of human brain at 3.0 T: preliminary report on trans- verse re-laxation rates and relation to estimated iron content. Radiology 210, 759– 767. doi: 10.1148/radiology.210.3.r99fe41759 .
Haacke, E.M., Cheng, N., House, M.J., Liu, Q., Neelavalli, J., Ogg, R.J., Khan, A., Ayaz, M., Kirsch, W., Obenaus, A., 2005. Imaging iron stores in the brain using magnetic reso- nance imaging. Magn. Resonanc. Imaging 23, 1–25. doi: 10.1016/j.mri.2004.10.001 . Haacke, E.M., Liu, S., Buch, S., Zheng, W., Wu, D., Ye, Y., 2015. Quantitative susceptibility mapping: current status and future directions. Magn. Resonanc. Imaging 33 (1), 1–25. doi: 10.1016/j.mri.2014.09.004 .
Hansen, P.C., O’Leary, D.P., 1993. The use of the l-curve in the regularization of discrete ill-posed problems. SIAM J Sci. Comput. 14 (6), 1487–1503. doi: 10.1137/0914086 . He, X., Yablonskiy, D.A., 2009. Biophysical mechanisms of phase contrast in gradient echo
MRI. Proc. Natl. Acad. Sci. USA 106, 13558–13563. doi: 10.1073/pnas.0904899106 . Hinoda, T., Fushimi, Y., Okada, T., Fujimoto, K., Liu, C., Yamamoto, A., Okada, T.,
Kido, A., Togashi, K., 2015. Quantitative susceptibility mapping at 3 T and 1.5 T: evaluation of consistency and reproducibility. Investig. Radiol. 50, 522–530. doi: 10.1097/RLI.0000000000000159 .
House, M.J., Pierre, T.G.S., Kowdley, K.V., Montine, T., Connor, J., Beard, J., Berger, J., Siddaiah, N., Shankland, E., Jin, L.W., 2007. Correlation of proton transverse relax- ation rates (R2) with iron concentrations in postmortem brain tissue from Alzheimer’s disease patients. Magn. Resonanc. Med. 57, 172–180. doi: 10.1002/mrm.21118 . Karsa, A., Punwani, S., Shmueli, K., 2019. The effect of low resolution and coverage on
the accuracy of susceptibility mapping. Magn. Resonanc. Med. 81 (3), 1833–1848. doi: 10.1002/mrm.27542 .
KeuKen, M.C., Bazin, P.L., Backhouse, K., Beekhuizen, S., Himmer, L., Kandola, A., Lafeber, J.J., Prochazkova, L., Trutti, A., Schäfer, A., Turner, R., 2017. Effects of ag- ing on T1, T2 ∗ , and QSM MRI values in the subcortex. Brain Struct. Funct. 222 (6), 2487–2505. doi: 10.1007/s00429-016-1352-4 .
Lancione, M., Tosetti, M., Donatelli, G., Cosottini, M., Costagli, M., 2017. The impact of white matter fiber orientation in single-acquisition quantitative susceptibility map- ping. NMR Biomed. 30, e3798. doi: 10.1002/nbm.3798 .
Langkammer, C., Schweser, F., Shmueli, K., Kames, C., Li, X., Guo, L., Milovic, C., Kim, J., Wei, H., Bredies, K., Buch, S., 2018. Quantitative susceptibility mapping: report from the 2016 reconstruction challenge. Magn. Reson. Med. 79 (3), 1661–1673. doi: 10.1002/mrm.26830 .
Langkammer, C., Pirpamer, L., Seiler, S., Deistung, A., Schweser, F., Franthal, S., Homayoon, N., Katschnig-Winter, P., Koegl-Wallner, M., Pendl, T., Stoegerer, E.M., 2016. Quantitative susceptibility mapping in Parkinson’s disease. PLoS One 11 (9), e0162460. doi: 10.1371/journal.pone.0162460 .
Langkammer, C., Schweser, F., Krebs, N., Deistung, A., Goessler, W., Scheurer, E., Sommer, K., Reishofer, G., Yen, K., Fazekas, F., Ropele, S., Reichenbach, J.R., 2012. Quantitative susceptibility mapping (QSM) as a means to measure brain iron? A post mortem validation study. Neuroimage 62 (3), 1593–1599. doi: 10.1016/j.neuroimage.2012.05.049 .
Langkammer, C., Krebs, N., Goessler, W., Scheurer, E., Ebner, F., Yen, K., Fazekas, F., Ropele, S., 2010. Quantitative MR imaging of brain iron: a postmortem validation study. Radiology 257 (2), 455–462. doi: 10.1148/radiol.10100495 .
Lee, J., Shmueli, K., Kang, B.T., Yao, B., Fukunaga, M., van Gelderen, P., Palumbo, S., Bosetti, F., Silva, A.C., Duyn, J.H., 2012. The contribution of myelin to magnetic susceptibility-weighted contrasts in high-field MRI of the brain. Neuroimage 59, 3967–3975. doi: 10.1016/j.neuroimage.2011.10.076 .
Li, G., Zhai, G., Zhao, X., An, H., Spincemaille, P., Gillen, K.M., Ku, Y., Wang, Y., Huang, D., Li, J., 2019. 3D texture analysis within substantia nigra of Parkinson’s disease pa- tients on quantitative susceptibility maps and R2 ∗ maps. NeuroImage 188, 465–472.
doi: 10.1016/j.neuroimage.2018.12.041 .
Li, L., Leigh, J.S., 2004. Quantifying arbitrary magnetic susceptibility distributions with MR. Magn. Reson. Med. 51, 1077–1082. doi: 10.1002/mrm.20054 .
Li, W., Liu, C., Duong, T.Q., van Zijl, P.C., Li, X., 2017. Susceptibility tensor imaging (STI) of the brain. NMR Biomed. 30 (4), e3540. doi: 10.1002/nbm.3540 .
Lin, P.Y., Chao, T.C., Wu, M.L., 2015. Quantitative susceptibility mapping of human brain at 3T: a multisite reproducibility study. AJNR Am J. Neuroradiol. 36, 467–474. doi: 10.3174/ajnr.A4137 .
Liu, T., Wisnieff, C., Lou, M., Chen, W., Spincemaille, P., Wang, Y., 2013. Nonlinear formu- lation of the magnetic field to source relationship for robust quantitative susceptibility mapping. Magn. Resonanc. Med. 69 (2), 467–476. doi: 10.1002/mrm.24272 . Liu, J., Liu, T., de Rochefort, L., Ledoux, J., Khalidov, I., Chen, W., Tsiouris, A.J., Wisni-
eff, C., Spincemaille, P., Prince, M.R., Wang, Y., 2012. Morphology enabled dipole in- version for quantitative susceptibility mapping using structural consistency between the magnitude image and the susceptibility map. Neuroimage 59 (3), 2560–2568. doi: 10.1016/j.neuroimage.2011.08.082 .
Lotfipour, A.K., Wharton, S., Schwarz, S.T., Gontu, V., Schaefer, A., Peters, A.M., Bowtell, R.W., Auer, D.P., Gowland, P.A., Bajaj, P.S., 2012. High resolution magnetic susceptibility mapping of the substantia nigra in Parkinson’s disease. J. Magn. Reso- nanc. Imaging 35, 48–55. doi: 10.1002/jmri.22752 .
Makhlouf, S.A., Parker, F.T., Berkowitz, A.E., 1997. Magnetic hysteresis anomalies in fer- ritin. Phys. Rev. B 55 (22). doi: 10.1103/PhysRevB.55.R14717 , R14 717-R14 720. Moeller, H.E., Bossoni, L., Connor, J.R., Crichton, R.R., Does, M.D., Ward, R.J., Zecca, L.,
Zucca, F.A., Ronen, I., 2019. Iron, myelin, and the brain: Neuroimaging meets neuro- biology. Trends Neurosci. 42 (6), 384–401. doi: 10.1016/j.tins.2019.03.009 . Mougin, O. , Clarke, W. , Driver, I. , Rua, C. , Morgan, A.T. , Francis, S. , Muir, K. , Carpen-
ter, A. , Rodgers, C. , Wise, R. , Porter, D. , Clare, S. , Bowtell, R. , 2019. Robustness of PSIR segmentation and R1 mapping at 7T: a travelling head study. Proc. Intr. Soc. Mag. Reson. Med. 27, 237 .
Nehrke, K., Bornert, P., 2012. DREAM–a novel approach for robust, ultrafast, multislice B(1) mapping. Magn. Reson. Med. 68 (5), 1517–1526. doi: 10.1002/mrm.24158 . Pei, M., Nguyen, T.D., Thimmappa, N.D., Salustri, C., Dong, F., Cooper, M.A., Li, J.,
Prince, M.R., Wang, Y., 2015. Algorithm for fast monoexponential fitting based on auto-regression on linear operations (ARLO) of data. Magn. Reson. Med. 73, 843– 850. doi: 10.1002/mrm.25137 .
Pohmann, R., Speck, O., Scheffler, K., 2016. Signal ‐to ‐noise ratio and MR tissue parameters in human brain imaging at 3, 7, and 9.4 tesla using current receive coil arrays. Magn. Resonanc. Med. 75 (2), 801–809. doi: 10.1002/mrm.25677 .
Pruessmann, K.P., Weiger, M., Scheidegger, M.B., Boesiger, P., 1999. SENSE: sensitivity encoding for fast MRI. Magn. Resonanc. Med. 42 (5), 952–962. doi: 10.1002/(SICI)1522-2594(199911)42:5 < 952::AID-MRM16>3.0.CO;2-S .
R Core team, 2013. R: A Language and Environment for Statistical Computing. R Founda- tion for Statistical Computing, Vienna, Austria. http://www.R-project.org/ . Reichenbach, J.R., 2012. The future of susceptibility contrast for assessment of anatomy
and function. Neuroimage 62, 1311–1315. doi: 10.1016/j.neuroimage.2012.01.004 . Reichenbach, J.R., Jonetz-Mentzel, L., Fitzek, C., Haacke, E.M., Kido, D.K.,
Lee, B.C., Kaiser, W.A., 2001. High-resolution blood oxygen-level depen- dent MR venography (HRBV): a new technique. Neuroradiology 43, 364–369. doi: 10.1007/s002340000503 .
Robinson, S.D., Bredies, K., Khabiova, D., Dymerska, B., Marques, J.P., Schweser, F., 2017. An illustrated comparison of processing methods for MR phase imaging and QSM: combining array coil signals and phase unwrapping. NMR Biomed. 30, e3601. doi: 10.1002/nbm.3601 .
Roemer, P.B., Edelstein, W.A., Hayes, C.E., Souza, S.P., Mueller, O.M., 1990. The NMR phased array. Magn. Reson. Med. 16 (2), 192–225. doi: 10.1002/mrm.1910160203 . Santin, M.D., Didier, M., Valabregue, R., Yahia Cherif, L., García ‐Lorenzo, D., Loureiro
de Sousa, P., Bardinet, E., Lehéricy, S., 2017. Reproducibility of R2 ∗ and quantitative
susceptibility mapping (QSM) reconstruction methods in the basal ganglia of healthy subjects. NMR Biomed. 30 (4), e3491. doi: 10.1002/nbm.3491 .
Schweser, F., Deistung, A., Lehr, B.W., Reichenbach, J.R., 2011. Quantitative imag- ing of intrinsic magnetic tissue properties using MRI signal phase: an ap- proach to in vivo brain iron metabolism? Neuroimage 54 (4), 2789–2807. doi: 10.1016/j.neuroimage.2010.10.070 .
Schweser, F., Deistung, A., Sommer, K., Reichenbach, J.R., 2013. Toward online recon- struction of quantitative susceptibility maps: superfast dipole inversion. Magn. Reso- nanc. Med. 69 (6), 1582–1594. doi: 10.1002/mrm.24405 .
Smith, S.M., 2002. Fast robust automated brain extraction. Hum. Brain Mapp. 17 (3), 143–155. doi: 10.1002/hbm.10062 .
Snyder, A.M., Connor, J.R., 2009. Iron, the substantia nigra and related neurological dis- orders. Biochim. Biophys. Acta 1790, 606–614. doi: 10.1016/j.bbagen.2008.08.005 . Spincemaille, P., Liu, Z., Zhang, S., Kovanlikaya, I., Ippoliti, M., Makowski, M., Watts, R.,
de Rochefort, L., Venkatraman, V., Desmond, P., Santin, M.D., 2019. Clinical in- tegration of automated processing for brain quantitative susceptibility mapping: multi ‐site reproducibility and single ‐site robustness. J. Neuroimaging 29 (6), 689– 698. doi: 10.1111/jon.12658 .
Straub, S., Schneider, T.M., Emmerich, J., Freitag, M.T., Ziener, C.H., Schlemmer, H.P., Ladd, M.E., Laun, F.B., 2017. Suitable reference tissues for quantitative susceptibility mapping of the brain. Magn. Reson. Med. 78, 204–214. doi: 10.1002/mrm.26369 . Sullivan, E.V., Pfefferbaum, A., Adalsteinsson, E., Swan, G.E., Carmelli, D., 2002. Differ-
ential rates of regional brain change in callosal and ventricular size: a 4-year longi- tudinal MRI study of elderly men. Cereb. Cortex 12 (4), 438–445. doi: 10.1093/cer- cor/12.4.438 .
Sun, H., Seres, P., Wilman, A.H., 2017. Structural and functional quantitative sus- ceptibility mapping from standard fMRI studies. NMR Biomed. 30 (4), e3619. doi: 10.1002/nbm.3619 .
Tie-Qiang, T., Gelderen, P., Merkle, H., Talagala, L., Koretsky, A.P., Duyn, J., 2006. Extensive heterogeneity in white matter intensity in high-resolution T2 ∗ -
weighted MRI of the human brain at 7.0 T. NeuroImage 32, 1032–1040. doi: 10.1016/j.neuroimage.2006.05.053 .
Vegh, V., O’Brien, K., Barth, M., Reutens, D.C., 2016. Selective channel combination of MRI signal phase. Magn. Reson. Med. 76 (5), 1469–1477. doi: 10.1002/mrm.26057 . Walsh, D.O., Gmitro, A.F., Marcellin, M.W., 2000. Adaptive reconstruc-
tion of phased array MR imagery. Magn. Reson. Med. 43 (5), 682–690. doi: 10.1002/(SICI)1522-2594(200005)43:5 < 682::AID-MRM10>3.0.CO;2-G . Wang, Y., Liu, T., 2015. Quantitative susceptibility mapping (QSM): decoding MRI data for
a tissue magnetic biomarker. Magn. Reson. Med. 7, 82–101. doi: 10.1002/mrm.25358 . Wardlaw, J.M., Brindle, W., Casado, A.M., Shuler, K., Henderson, M., Thomas, B., Macfarlane, J., Maniega, S.M., Lymer, K., Morris, Z., Pernet, C., 2012. A system- atic review of the utility of 1.5 versus 3 Tesla magnetic resonance brain imag- ing in clinical practice and research. European radiology 22 (11), 2295–2303. doi: 10.1007/s00330-012-2500-8 .
Weir, J.P. , 2005. Quantifying test-retest reliability using the intraclass correlation coeffi- cient and the SEM. J. Strength Cond. Res. 19 (1), 231–240 .
Wharton, S., Bowtell, R., 2010. Whole-brain susceptibility mapping at high field: a com- parison of multiple-and single-orientation methods. Neuroimage 53 (2), 515–525. doi: 10.1016/j.neuroimage.2010.06.070 .
Yacoub, E., Shmuel, A., Pfeuffer, J., Van de Moortele, P.F., Adriany, G., Andersen, P., Vaughan, J.T., Merkle, H., Ugurbil, K., Hu, X., 2001. Imaging brain function in humans at 7 Tesla. Magn. Reson. Med. 45, 588–594. doi: 10.1002/mrm.1080 .
Yang, X., Sammet, S., Schmalbrock, P., Knopp, M.V., 2010. Postprocessing correction for distortions in T2 ∗ decay caused by quadratic cross-slice b0 inhomogeneity. Magn.
Reson. Med. 63 (1), 1258–1268. doi: 10.1002/mrm.22316 .
Yao, B., Li, T., van Gelderen, P., Shmueli, K., De Zwart, J.A., Duyn, J.H., 2009. Neuro image susceptibility contrast in high field MRI of human brain as a function of tissue iron content. Neuroimage 44 (4), 1259–1266. doi: 10.1016/j.neuroimage.2008.10.029 . Yao, B. , van Gelderen, P. , de Zwart, J.A. , Duyn, J.H. , 2007. Brain iron in MR imaging:
R2 ∗ and phase shift at different field strengths. Proc. Intr. Soc. Mag. Reson. Med. 15, 2165 .
Zhou, D., Liu, T., Spincemaille, P., Wang, Y., 2014. Background field removal by solving the Laplacian boundary value problem. NMR Biomed 27 (3), 312–319. doi: 10.1002/nbm.3064 .