DIPARTIMENTO DI SCIENZE BIOMOLECOLARI
CORSO DI DOTTORATO DI RICERCA IN
SCIENZE DELLA VITA, SALUTE E BIOTECNOLOGIE
Currriculum Scienze Biochimiche, Farmacologiche e Biotecnologie
CICLO XXXCHEMOPREVENTIVE POTENTIAL
OF OAT DERIVED PHYTOCHEMICALS.
The role of naturally isolated and chemically synthesized avenanthramides.
SSD: BIO/10
RELATORE
Chiar.mo Prof. Paolino Ninfali
DOTTORANDA
Dott.ssa Elena Antonini
Contents
Abstract ... 3
Introduction ... 7
Objectives ... 13
Materials and Methods ... 14
Extraction of free polyphenols (FPs) ... 16
Extraction of bound polyphenols (BPs) ... 16
Determination of total phenols (TPs) ... 16
Isolation of AVNs from oat sprouts ... 16
Syntheses of AVNs ... 17
HPLC-PDA-MS analysis of AVNs ... 18
Chemical antioxidant capacity of synthetic AVNs... 18
DPPH assay ... 18
ABTS assay ... 19
ORAC assay ... 19
In vitro digestion of malted oat-based food products ... 19
Cell cultures ... 21
Sulforhodamine B (SRB) assay ... 21
Cellular Antioxidant Capacity (CAA) ... 21
Caspase 3, 9, 8 and 2 activities ... 22
RNA extraction, cDNA production and RTqPCR experiments ... 22
COX-2 activity assay ... 23
Statistical analysis ... 23
Results and discussion ... 24
Morphology of oat caryopsis ... 24
Effect of genotype on antioxidant levels ... 26
Effect of storage conditions of antioxidant levels ... 28
Effect of mechanical processing of antioxidant levels ... 31
Recovery of antioxidants after in vitro digestion ... 37
Biological effects of natural AVNs isolated from oat sprouts ... 41
Biological effects of synthetic AVNs ... 48
Antioxidant activity of synthetic AVNs ... 49
Cellular antioxidant activity of synthetic AVNs ... 50
Anti-proliferative activity of synthetic AVNs ... 51
Anti-inflammatory activity of the s-2c versus the n-MIX ... 53
Important outcomes of the thesis ... 56
Concluding remarks and future research ... 57
Appendix ... 58
Abstract
The present research project was designed to evaluate the main parameters which affect the nutrient level during the formulation of oat-based food products. The focus was on avenanthramides (AVNs), a group of more than 30 phenol compounds found exclusively in oats. The three main AVNs (2c, 2p and 2f) were isolated by us, as a mixture (n-MIX), from oat sprouts, as well as chemically synthesized, in order to test their health protective effects, namely antioxidant, anti-proliferative and anti-inflammatory activities.
First, we described the morphology of oat caryopsis, in order to localize nutrients within its layers, with particular attention to phenol compounds. Conventional optical microscopy coupled with specific staining techniques, as well as Environmental Scanning Electron Microscopy-Energy Dispersive Spectroscopy enabled us to identify macronutrients, whereas autofluorescence allowed us to observe phenol compounds in the outer layers of oat caryopsis. Second, we evaluated the effects of genotype/environment interactions and oat processing, on phenol concentration. Our results indicated that genotype was the main determinant on AVN levels, as naked oats showed about three-fold higher values than dehulled oats. Nevertheless, also the interaction soil x genotype was relevant on AVN content. Regarding the mechanical processing, the greatest loss of phenol antioxidants was observed after dehulling, as AVNs were also found in hulls; milling reduced bound polyphenols only, due to their covalent bound with the fibrous matrix.
Third, we evaluated the increase of AVN levels during malting, in order to obtain functional products, namely oat-based cookies, which underwent to simulated digestion process to evaluate the recovery of antioxidants. Minor AVNs, namely 2s, 2pd, 2fd, in addition to the three
main forms, were identified by us in malted oats and in their derived cookies. Total AVNs showed a ten-fold increase after five days of malting, probably due to enzymatically catalyzed
de novo biosynthesis. Cooking did not affect the AVN content of our bakery products, whereas
the in vitro digestion provided a relative bioaccessibility, ranging from 10 to 55%, depending on the individual AVN form.
Finally, we evaluated the main biological effects exerted by the n-MIX or synthetic AVNs s-2c, s-2p, s-2f. Among the three synthetic forms, the s-2c showed the highest antioxidant capacity, detected by three different methods (DPPH, ABTS, ORAC), due to the presence of two hydroxyl groups in the molecule.
The study of their anti-proliferative effect was carried out on one normal cell line (NCTC 2544) and three different cancer cell lines (CaCo-2, HepG2, Hep3B). On NCTC 2544 no cytotoxic effect was observed in the range 0-120 µM, whereas on cancer cell lines the n-MIX and the s-2c showed the greatest citotoxicity. The anti-tumor activity was exploited by AVNs by targeting the extrinsic apoptotic pathway, as demonstrated by the activation of caspases 3, 8, 2. The strong pro-apoptotic effect of AVNs was linked to: high membrane permeability, as ascertained by their cellular antioxidant capacity; downregulation of the pro-survival factors, like the hypoxia inducible factor (HIF1A) and the vascular endothelial growth factor (VEGFA), as well as the cyclooxigenase (COX-2).
The overall conclusion is that malting can be a good method to increase AVN levels in oats. The choice of the cultivar, as well as the mechanical processing and storage conditions are key factors to ensure the maintenance of high levels of AVNs in the final oat-based functional products.
Keywords: antioxidant; anti-inflammatory; anti-proliferative; avenanthramides; Avena sativa
L.; malting; oat-based cookies; polyphenols.
Author’s address: Elena Antonini, Department of Biomolecular Sciences, University of Urbino
The present thesis is based on the following papers:
I. Panato A, Antonini E, Bortolotti F, Ninfali P. 2017. The histology of grain caryopses for nutrient location: a comparative study of six cereals. International Journal of Food
Science and Technology 52, 1238-1245.
II. Antonini E, Zara C, Valentini L, Gobbi P, Ninfali P, Menotta M. Novel insights into globoids of aleurone, starch granules and the outer layers of three cereals gained using atomic force microscopy and environmental scanning electronic microscopy. Submitted
for publication.
III. Antonini E, Lombardi F, Alfieri M, Diamantini G, Redaelli R, Ninfali P. 2016. Nutritional characterization of naked and dehulled oat cultivar samples at harvest and after storage. Journal of Cereal Science 72, 46-53.
IV. Antonini E, Diamantini G, Ninfali P. 2017. The effect of mechanical processing on avenanthramide and phenol levels in two organically grown Italian oat cultivars.
Journal of Food Science and Technology 54, 2279-2287.
V. Oat-based food products. Manuscript to be submitted.
VI. Scarpa ES, Antonini E, Palma F, Mari M, Ninfali P. 2017. Antiproliferative Activity of Vitexin-2-O-Xyloside and Avenanthramides on CaCo-2 and HepG2 Cancer Cells Occurs Through Apoptosis Induction and Reduction of Pro-Survival Mechanisms.
European Journal of Nutrition. DOI: 10.1007/s00394-017-1418-y.
VII. Scarpa ES, Mari M, Antonini E, Palma F, Ninfali P. Natural and synthetic avenanthramides: a comparative study of their antioxidant, anti-proliferative and anti-inflammatory effects. Submitted for publication.
List of abbreviations
ABTS, 2,2'-azino-bis(3-ethylbenzothiazoline-6-sulphonic acid) AVNs, avenanthramides
BPs, bound polyphenols cv., cultivar
CAA, cellular antioxidant capacity COX, cyclooxygenase
DCFH-DA, 2’,7’-dichlorodihydrofluorescein diacetate DPPH, 2,2-Diphenyl-1-picrylhydrazyl
EDS, energy dispersive spectroscopy
ESEM, environmental scanning electron microscopy FPs, free polyphenols
HIF1A, hypoxia inducible factor 1A
HPLC, high performance liquid chromatography MS, mass spectrometry
n-AVN, natural avenanthramide
ORAC, oxygen radical absorbance capacity PDA, photo diode array
ROS, reactive oxygen species s-AVN, synthetic avenanthramide SRB, sulforhodamine B
TPs, total polyphenols
VEGF, vascular endothelial growth factor WGF, whole grain flour
2p, N-(4’hydroxy-(E)-cinnamoyl)-5-hydroxyanthranilic acid 2c, N-(3’, 4’-dihydroxy-(E)-cinnamoyl)-5-hydroxyanthranilic acid 2f, N-(4’-hydroxy-3’-methoxy-(E)-cinnamoyl)-5-hydroxyanthranilic acid 2s, N-(4’-hydroxy-3’,5’-dimethoxy-(E)-cinnamoyl)-5-hydroxyanthranilic acid
Introduction
Oats (Avena sativa L.) are important crops with a lot of potential for improvement by breeding based on a wealth of European genetic resources (Redaelli et al., 2014). They differ from other cereals in that they are consumed almost exclusively in wholegrain products (van der Kamp et al., 2014). The importance of wholegrain consumption has long been investigated for reduction of the risk of chronic diseases, such as coronary heart disease (Mellen et al., 2008), type II diabetes (Liu et al., 2000) and certain cancers (Haas et al., 2009; Kasum et al., 2002). In this regard, oat-based food products have gained considerable attention in recent years as they are rich in β-glucan, belonging to the soluble fiber, with positive effects on blood glucose and cholesterol levels (Daou and Zhang, 2012; EU, 2012). The mechanisms by which oat β-glucan reduce blood glucose and cholesterol levels are shown in Fig. 1.
The European Commission (EU, 2009) has included oats among permitted ingredients for celiac patients, if the gluten content does not exceed 20 mg/kg. This is an attractive task for the industry, due to lack of micronutrients in gluten free flours. In recent years, the demand of oat-based products has increased. Therefore, the industry is providing technology for new and diversified oat-based functional foods, like pasta or cakes, in order to favor the consumption of this cereal, reduce the cost of production and cover meals of all day times (Rasane et al., 2015).
Specific oat phenol compounds have received increasing interests along the last decades (Peterson, 2001). In particular, oats biosynthesize, in response to pathogen infections, a group of unique secondary metabolites, termed avenanthramides (AVNs) (Collins, 1989).
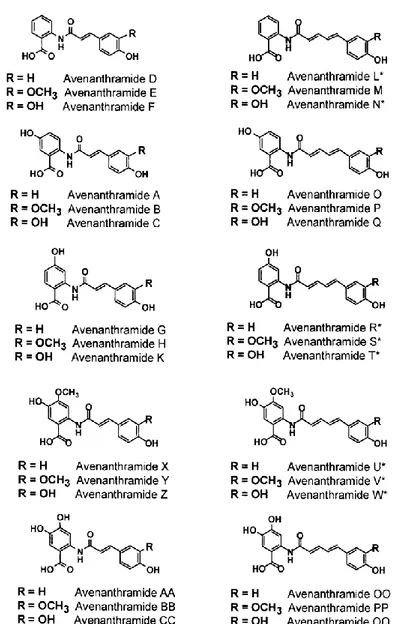
Chemically, AVNs consist of an anthranilic acid derivative, linked to a cinnamic acid derivative; the substitution on one of the two moieties allows to distinguish them among a group of about 30 forms. The most abundant AVNs in oats are reported in Table 1.
To describe AVNs, two nomenclature systems have been used in the literature. Collins (1989) used alphabetic descriptors (Fig. 2), whereas Dimberg et al. (1993) assigned numbers to indicate the substitution on the anthranilic acid moiety (1 for anthranilic, 2 for 5-hydroxy, 3 for 5-hydroxy-4-methoxy anthranilic acids) and letters to indicate the substitution on the cinnamic acid moiety (c for caffeic, f for ferulic, p for p-coumaric, s for synapic acid).
Table 1. Main AVN forms, as named by Collins and Dimberg. Collins (1989) Dimberg et al. (1993) n R 1 R2 R3 A 2p 1 H H OH B 2f 1 OCH3 H OH C 2c 1 OH H OH O 2pd 2 H H OH P 2fd 2 OCH3 H OH
Figure 2. Structural formula of 30 AVNs described by Collins and Burrows (2012).
Regarding genotype/environment interactions, AVN concentrations in oat kernel vary from 2 to 300 mg/kg, probably due to both genetically and environmental factors (Bratt et al., 2003; Bryngelsson et al., 2002; Emmons and Peterson, 2001; Mattila et al., 2005; Yang et al., 2014). In a recent report, the total AVN content in 137 genotypes, distributed over Europe, was found to reach levels up to 4081 mg/kg (Redaelli et al., 2016).
Concerning the localization of AVNs in oat caryopsis, their content is always higher in the outer layers of the grain than in the starchy endosperm, indicating that AVNs are localized primarily in the bran fraction (Emmons et al., 1999; Mattila et al., 2005).
The AVN levels in oat kernels can be increased through physiological processes. Malting is a process of soaking and germinating cereal grains, practiced for millennia, to change the composition of the caryopsis for a variety of end purposes (Hübner and Arendt, 2013). Several studies demonstrated that AVNs increased in concentration by steeping and germination processes, under controlled times and temperatures (Bryngelsson et al., 2002; Skoglund et al., 2008; Xu et al., 2009), due to the activation of the enzyme hydroxycinnamoyl-CoA:hydroxyanthranilate-N-hydroxycinnamoyltransferase, involved in their biosynthesis (Bryngelsson et al., 2003; Matsukawa et al., 2000; Skoglund et al., 2008). Moreover, Collins and Burrows (2012) developed a method termed “false malting” able to increase the AVN level of about 7.5-fold more than the starting level, by reducing the germination rate to less than 1%. In this way, after drying, malted oats can be used for most commercial food processing procedures.
Several authors studied the chemical stability of AVNs as a result of different technological processes or storage conditions. In particular, Dimberg et al. (1996) assessed that heating and drying oat grains did not significantly influence the 2c or 2f concentrations, while the AVN 2p was greatly reduced. The AVN 2p and 2f were stable at pH variations, from acid to alkaline condition, while 2c was sensitive to alkaline pH, especially in combination with thermal treatments (Dimberg et al., 2001).
AVN concentration was also studied before and after the processing of oat foods (bread, fresh pasta, muffins), demonstrating that the total content of the 3 most common forms (2c, 2p and 2f) increased in all tested products (Dimberg et al., 2001). This increase was tentatively explained by new synthesis, release of linked forms, increased extraction after processing or combination of all these factors (Dimberg et al., 2001).
Moreover, Bryngelsson et al. (2002) investigated the effect of commercial heat processing on AVN content. They found that the AVN 2p was reduced by steaming, the AVNs 2c and 2p decreased during autoclaving of oats and all three AVNs were reduced in drum-dried rolled oats (Bryngelsson et al., 2002).
Oat AVNs have been shown to be bio-available in humans, hamsters and rats (Chen et al., 2004; Chen et al., 2007; Koenig et al., 2011). In comparison to human and hamster, AVN bioavailability in rats is low, but the ranking order of plasma concentration by AVN type (2p >> 2f > 2c) is the same (Koenig et al., 2011).
Biological effects of AVNs have been studied for their antioxidant, anti-itching and anti-inflammatory effects, in vitro and in vivo, as well as for their anti-proliferative activity, in
vitro (Meydani, 2009).
Antioxidant activity. The AVN antioxidant activity is 10 to 30 times higher than that of other phenols present in oat kernel, such as caffeic and vanillic acids (Dimberg et al., 1993). In particular, AVNs 2c exhibits the highest in vitro antioxidant capacity (Peterson, 2001).
In vivo studies demonstrated that a supplementation of rat diet with AVNs increases the activity
of antioxidant enzymes, like superoxide dismutase in skeletal muscle, liver and kidney, as well as glutathione peroxidase in heart and skeletal muscles and attenuates the Reactive Oxygen Species (ROS) production (Ji et al., 2003). In addition, a synergistic action of AVNs with vitamin C was found in hamsters, in the protection of LDL oxidation (Chen et al., 2004).
Anti-itching activity. Oatmeal has been used for centuries as a soothing agent to relieve itch and irritation associated with various xerotic dermatoses (Sur et al., 2008). A low concentration of AVNs (1 ppb) would be able to inhibit the degradation of the Inhibitor of Nuclear Factor kappa B-alpha (IkB-α) in keratinocytes, which correlated with decreased phosphorylation of p65 subunit of Nuclear Factor kappa B (NF-kB) (Sur et al., 2008). Furthermore, cells treated with AVNs showed a significant inhibition of tumor necrosis factor-alpha (TNF-alpha) induced NF-kB luciferase activity and subsequent reduction of interleukin-8 (IL-8) release. Additionally, topical application of 1-3 ppm AVNs mitigated inflammation in murine models of contact hypersensitivity and neurogenic inflammation and reduced pruritogen-induced scratching in a murine itch model (Sur et al., 2008). Recently, Fowler (2014) showed that oat extract containing AVNs has antihistaminic and anti-irritant activities.
Finally, dihydroavenanthramide D, a synthetic analog of AVNs, acts as a Neurokinin-1 Receptor (NK1R) inhibitor, reduces the secretion of the cytokine IL-6 and could be a promising candidate for topical treatments of chronic pruritus (Heuschkel et al., 2008).
Anti-inflammatory activity. AVNs exert anti-inflammatory activity by inhibiting the proliferation of smooth muscle cells in humans and increasing the nitric oxide production, which are considered the two key factors in the prevention of atherosclerosis (Nie et al., 2006a). The mechanism underlying this protective effect is that AVNs may arrest the cell cycle at the G1 phase, by up-regulating the p53-p21cip1 pathway and inhibiting the phosphorylation of retinoblastoma protein (Loden et al., 1999). Moreover, the methyl esters of AVNs 2c was
shown to inhibit the proteasome activity and increase the overall levels of high mass, ubiquitin-conjugated protein in endothelial cells (Guo et al., 2008).
Furthermore, AVNs are structurally similar to TranilastTM (Fig. 3), a synthetic compound used like antihistaminic drug, which exerts also an anti-proliferative effect on smooth muscle cells, preventing restenosis after angioplasty (Nie et al., 2006b).
Figure 3. Structural formula of TranilastTM
Another study demonstrated that AVN 1f acts as an in vitro inhibitor of lipoxygenase, a key enzyme of leukotriene biosynthesis, which participates in allergic and inflammatory responses (Liu et al., 2004).
Anti-proliferative activity. Nie et al. (2007) and Guo et al. (2010) showed the anti-proliferative effect of the natural AVNs-enriched extract of oats (AvExO), isolated from oat bran, as well as the AVN 2c and the methylated form of AVN 2c (CH3-AVN 2c), synthetically prepared, on several colon cancer cell lines. These unique polyphenols significantly inhibited the proliferation of colonic cancer cell lines in the magnitude order of HCT116 > CaCo2 > LS174 > HT29. In addition, they had no cytotoxic effects on differentiated colon cancer cells, which represent the characteristics of normal colon epithelial cells (Guo et al., 2010). CH3-AVN 2c was the most potent AVN in the inhibition of colon cancer cell proliferation, probably due to the presence of a single methyl ester group in the chemical structure of AVNs, which might increase its lipid solubility and bioavailability, making it readily incorporated into the cell membrane and allowing it to hinder the molecular pathways that are involved in cell proliferation.
A plausible mechanism for AVNs’ inhibition of colon cancer cell proliferation may be the inhibition of proteasome activity, the subsequent stabilization of p53 protein and cell cycle arrest (Guo et al., 2010).
Objectives
Taken together, this information makes AVNs interesting candidates in the search for new oat-based food products, which may be significant contributors to the health benefits. As the AVN concentration in the final product is critical for their biological effects, the objectives of the present study were:
To describe the morphological structures of oat caryopsis, with particular attention to the presence of phenol compounds.
To check the effect of genetic and environmental factors on the modulation of the antioxidant and AVN levels, in order to take into consideration the retention of nutrients after storage or mechanical processing.
To standardize an oat malting method able to increase the AVN concentration, in order to realize functional oat-based bakery products able to exert healthy effects in humans. To evaluate the antioxidant, anti-proliferative and anti-inflammatory activities of AVNs
Materials and Methods
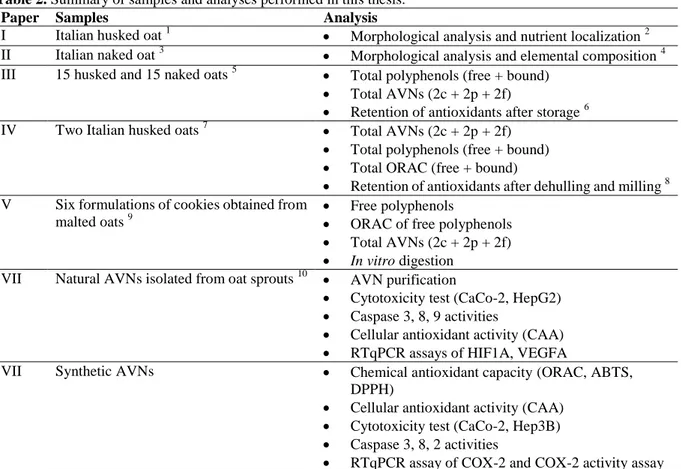
Table 2 gives a brief description of the samples and analyses performed in the studies.
Table 2. Summary of samples and analyses performed in this thesis.
Paper Samples Analysis
I Italian husked oat 1 Morphological analysis and nutrient localization 2
II Italian naked oat 3 Morphological analysis and elemental composition 4
III 15 husked and 15 naked oats 5 Total polyphenols (free + bound)
Total AVNs (2c + 2p + 2f)
Retention of antioxidants after storage 6
IV Two Italian husked oats 7 Total AVNs (2c + 2p + 2f)
Total polyphenols (free + bound)
Total ORAC (free + bound)
Retention of antioxidants after dehulling and milling 8 V Six formulations of cookies obtained from
malted oats 9
Free polyphenols
ORAC of free polyphenols
Total AVNs (2c + 2p + 2f)
In vitro digestion
VII Natural AVNs isolated from oat sprouts 10 AVN purification
Cytotoxicity test (CaCo-2, HepG2)
Caspase 3, 8, 9 activities
Cellular antioxidant activity (CAA)
RTqPCR assays of HIF1A, VEGFA
VII Synthetic AVNs Chemical antioxidant capacity (ORAC, ABTS,
DPPH)
Cellular antioxidant activity (CAA)
Cytotoxicity test (CaCo-2, Hep3B)
Caspase 3, 8, 2 activities
RTqPCR assay of COX-2 and COX-2 activity assay
1
Husked oat (cv. Flavia) was provided by Terra Bio Soc. Coop., Schieti di Urbino (PU, Italy) and dehulled by hand before cross-sections.
2 Oat sections (5µm) were stained with the Azan Trichrome kit according to Heidenhain and Periodic acid-Shiff
staining and examined using a a Nikon Coolscope Digital Microscope (Tokyo, Japan) to identify macronutrients. Unstained sections were examined using a fluorescence microscope (Axioskop 2 from Carl Zeiss, Oberkochen, Germany), with an excitation wavelength of 365 nm and an emission wavelength of 418 nm to identify the autofluorescence of phenol compounds.
3
Naked oat (cv. Leda) was provided by Terra Bio Soc. Coop., Schieti di Urbino (PU, Italy).
4 Oat was cut in perpendicular slices with a sharp stainless steel razor. The oat slices were deposited into the
aluminum specimen stubs, previously covered with a conductive carbon adhesive disk (TAAB Ltd, Berks, England) and analyzed by Environmental Scanning Electron Microscope (FEI, Hillsboro, Oregon, USA), equipped with an energy dispersive X-ray spectrometer (EDAX inc., Mahwah, NJ, USA).
5 Samples (15 husked and 15 naked oats) were provided by the Maize Research Unit of Bergamo (Italy) and sown
6 Samples (six husked and six naked) were selected among the 30 oat cultivars and analyzed for their antioxidant
content over 12 months of storage (T12), in a cold room at + 7°C and 55% rh. The former were stored with hulls and dehulled by hand before analysis.
7 Husked oats (cv. Donata and Flavia) were provided by Terra Bio Soc. Coop., Schieti di Urbino (PU, Italy) and
organically grown in two different soils: a loamy soil, located in Urbino (Italy, 43°43′34″ N; 12°38′10″ E) and a medium texture soil, located in Siena (Italy, 43°20′27″ N; 11°2′38″ E).
8 Conditioned oat grains were dehulled with an industrial dehuller operating at an appropriate speed to yield an
acceptable percentage of unbroken groats. The hulls accounted for 30 ± 2% of the groats. Milling was performed at 131 rpm, with a final flour yield of 75 ± 1%.
9 Naked oats (cv. Luna) were malted for five days (M0M5) by COBI, Consorzio Italiano di Produttori dell’Orzo
e della Birra (AN, Italy), using the procedure for brewing. In particular, oats were steeped at 20°C for 24 h, then drained and kept in the dark, at 15°C, for five days in the same containers used for barley malting.
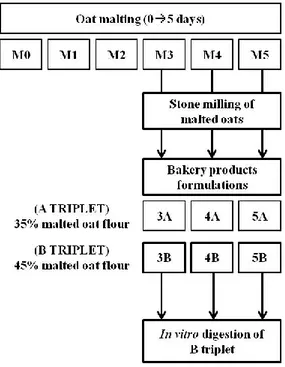
Six formulations of malted oat-based cookies were realized by « Il mulino di Nino », Azienda Agricola Roncarati (AN, Italy) and labeled as: 3A, 4A, 5A (A triplet); 3B, 4B, 5B (B triplet). Fig. 4 shows the flow-chart summarizing the main approach to obtain malted oat-based cookies.
A triplet (3A, 4A, 5A): cookies were realized with 35% of flour obtained from oat malted for 3, 4, 5 days, respectively.
B triplet (3B, 4B, 5B): cookies were realized with 45% of flour obtained from oat malted for 3, 4, 5 days, respectively.
The other ingredients were: wheat flour (65% in the A triplet, 55% in the B triplet); sugar (300 g); 4 eggs; baking powder (12 g). Cookies were cooked in ventilated oven for 30 min at 180°C.
Figure 4. Flow chart summarizing the main approach to obtain malted oat-based cookies.
10 Oat grains, provided by Terra Bio Soc. Coop. (Urbino, Italy), were steeped and germinated for 14 and 72 hours,
Extraction of free polyphenols (FPs)
FPs were extracted following the procedure of Wise (2011), with some modifications. Briefly, 1 g of flour was treated with 3 x 10 mL of 80% EtOH in a 10 mM H3PO4 buffer, pH 2.8, in a
water bath at 50°C, under shaking. After each extraction, the samples were centrifuged at 3000 rpm for 10 min. The three supernatants were collected and stored at -20°C until analysis.
Extraction of bound polyphenols (BPs)
BPs were extracted following the procedure of Verardo et al. (2011), with some modifications. Briefly, the solid residue of FP extraction was digested with 100 ml of 2 M sodium hydroxide at room temperature for 20 h by shaking under nitrogen gas. The mixture was acidified to pH 2-3 by adding 10 M HCl in a cooling ice bath. Five ml of the acidified mixture was taken and treated twice with 10 ml of hexane to remove lipids. The aqueous solution was extracted twice with 5 ml of ethyl acetate. The polar fractions were pooled and evaporated to dryness. The BPs were reconstituted with 1 ml of 1/1 acetone/water (v/v).
Determination of total phenols (TPs)
FPs and BPs were determined using the Folin-Ciocalteu method (Singleton et al., 1999). A calibration curve was made each time with the standard caffeic acid (from 50 to 400 μg/mL). Total content of polyphenols (TPs) is reported as the sum of FPs and BPs.
Isolation of AVNs from oat sprouts
AVNs were extracted from milled oat following the procedure reported in “Extraction of FPs”, with the exception that ethanol was acidified with 0.1% glacial acetic acid, instead of 10 mM H3PO4 buffer.
The raw extract was concentrated by rotary evaporation to 1/10 of the initial volume. To remove lipophilic components from the extract, we followed the procedure previously reported (Liu et al., 2004), with some modifications. Briefly, Octyl SepharoseTM CL 4-B (GE Healthcare Bio-Sciences AB, Uppsala, Sweden) was added to the extract (0.5 ml per g extracted). The mixture was completely dried, re-suspended in acidified 50% ethanol and transferred to a glass chromatography column containing Octyl SepharoseTM CL 4-B, previously pre-equilibrated in acidified 50% ethanol. The column was then eluted with 3 x bed volume (Vb) of acidified 50%
The defatted dried extract was dissolved in acidified 30% ethanol and purified on a Sephadex LH-20 column (50 x 150 mm; Sigma-Aldrich Inc., St. Louis, USA), equilibrated in acidified 30% ethanol, and controlled by the LC-Chromatograph AKTA Purifier 10 (GE Healthcare Bio-Sciences AB, Uppsala, Sweden). The mobile phase was changed as follows: 2 x Vb of acidified 30% ethanol in isocratic mode to remove amino acids, free sugars, proteins, etc. (Liu et al., 2004); 2 x Vb of acidified 50% ethanol in isocratic mode to remove the flavonoids and phenolic acids (Liu et al., 2004); 2 x Vb of acidified ethanol from 50 to 95% in gradient mode, to recover the absorbed AVNs. The flow rate was 5 ml/min and absorbance values were obtained at 330 nm.
Syntheses of AVNs
AVNs were synthesized according to previous synthetic strategies (Günther-Jordanland et al., 2016; Wise, 2011), with some modifications. Briefly, 2 ml of a 5 mM solution of the appropriate phenylpropanoid (p-coumaric, ferulic or caffeic acid) in pyridine were added to 10 ml of acetic anhydride. The mixture was then stirred for 5 h at room temperature. Cold water (50 mL) was added and the solution was left to stand at 5°C for one hour. The precipitate was collected by filtration and washed several times with cold water. The compound was dried overnight at 45°C under vacuum. The acetylated phenylpropanoid was then dissolved in 15 ml of dimethylformamide with 2.1 mL of triethylamine. The solution was stirred at 0°C and an equimolar amount of (Benzotriazol-1-yloxy) tripyrrolidinophosphonium hexafluorophosphate in solution in CH2Cl2 (36 mL) was added dropwise. Next, a solution of 5-hydroxyanthranilic
acid (equimolar to the protected phenylpropanoid) in 15 mL of dimethylformamide was added dropwise to the solution. The solution was stirred at 0°C for 30 min and then for 2 h at room temperature. Subsequently, 0.5 M HCl was added (80 mL) and the mixture was stored overnight at 4°C. The acetoxy avenantramides were extracted with ethyl acetate and the solvent was removed under reduced pressure. Finally, the protecting acetyl groups were removed by dissolving the avenanthramides in MeOH: Water (1:1) 80 mL with the addition of 4 equivalents of ammonium acetate, and stirred over night at room temperature. The mixture was then acidified with 2N HCl and extracted with ethyl acetate. The solvent was removed under reduced pressure and the final compounds were purified by crystallization in MeOH and water (2p and 2f) or CH2Cl2 and hexane (2c).
1
H NMR and 13C NMR spectra were recorded on a Bruker Avance 400 Ultrashield spectrometer, using CD3OD as a solvent. Chemical shifts (δ scale) were reported in parts per
million (ppm) relative to the central peak of the solvent. Coupling constants (J values) were given in hertz (Hz).
HPLC-PDA-MS analysis of AVNs
The ethanolic extract was filtered before analysis (Iso-Disc Filters, PFTE-4-4; 4 mm x 0.45 µm; Supelco Inc., Bellefonte, USA) and directly analyzed in a Waters instrument equipped with Alliance HT 2795 High Performance Liquid Chromatography (HPLC), 2996 Photo Diode Array (PDA) and Micromass LC/MS ZQ 2000 detector, following the known procedure (Jastrebova et al., 2006; Wise, 2011), with some modifications. A C18 column, LiChroCART® (250 x 4 mm), with a particle size of 5 µm, was used. The mobile phase used consisted of acetonitrile (solvent A) and 0.1 % aqueous formic acid (solvent B). The gradient was changed as follows: 0-5 min 2.4 % A (isocratic), 5-20 min to 24 % A, 20-38 min to 40 % A, 38-50 min to 75 % A. The total running time was 50 min. The injected sample volume was 50 µL and the flow rate was 0.8 mL/min. UV spectra were recorded from 220 to 420 nm, whereas the chromatograms were registered at 330 nm. Electrospray ionization (ESI) was operated in positive and negative ion mode in a range of 150-370 amu. Capillary voltage was set at 3 kV, source temperature at 100°C and desolvation temperature at 300°C. The cone and desolvation nitrogen gas flows were 50 and 500 L/h, respectively. Data were processed using MassLynx 4.1 (Waters, Milford, USA). To identity AVNs in the HPLC chromatograms, retention time, UV spectra, MS ESI(+) and ESI(-) spectra were compared with those of commercially available external standards (AVN 2p, 2f, 2c, Sigma-Aldrich, St. Louis, USA), and the peak areas were used for quantification.
Chemical antioxidant capacity of synthetic AVNs
DPPH assay
The 2,2-Diphenyl-1-picrylhydrazyl (DPPH) radical scavenging activity was performed following the method previously reported (Brand-Williams et al., 1995), with same modifications. Briefly, 150 µl of AVN solution (50 µM in methanol), was mixed with 850 µl of freshly made DPPH solution (100 µM methanol). The absorbance of the mixture was recorded at 515 nm after incubation for ten minutes in the dark, at room temperature. Initial absorbance readings for DPPH, used as control, were 0.95±0.05. Antioxidant activity was expressed as percentage of inhibition calculated by the following equation:
(1- ) 100.
ABTS assay
The 2,2'-azino-bis(3-ethylbenzothiazoline-6-sulphonic acid) (ABTS) radical scavenging activity was measured as previously reported (Ferri et al., 2013), with slight modifications. ABTS working solution was prepared by dissolving 7 mM ABTS in water, then treating with 140 mM potassium persulfate in water. The solution was allowed to stand for 12-16 hours in the dark, at room temperature, to produce the ABTS radical. Immediately before the analysis, the ABTSradical solution was diluted 1:90 in ethanol to reach the absorbance value of 0.70±0.02 at 734 nm (control). The assay was performed as follows: 1000 µl of diluted ABTS radical solution was mixed with 10 µl of AVN solution (10 µM in ethanol). After four minutes incubation, the absorbance was read at 734 nm. Antioxidant activity was expressed as percentage of inhibition calculated as reported for the DPPH method.
ORAC assay
The Oxigen Radical Absorbance Capacity (ORAC) assay was performed using a Fluostar Optima plate reader fluorimeter (BMG Labtech, Offenburgh, Germany), equipped with a temperature-controlled incubation chamber and automatic injection pump, as previously reported (Ninfali et al., 2009). Fluorescence was read at 485 nm ex. and 520 nm em. until complete extinction. A calibration curve was made each time with the standard Trolox (from 25 to 500 µM).
In vitro digestion of malted oat-based food products
Simulation of a complete digestion was studied according to procedure suggested by Oomen et al. (2003) and occured in three steps (Table 3): 1) 2 g of sample was mixed with 30 ml of artificial saliva, incubated at 37°C, and rotated for 5 min (oral phase); 2) 45 ml of a gastric juice was added at pH 1 and the solution rotated for 120 min (gastric phase); and 3) the suspension resulting from the second stage was mixed with 90 ml of a synthetic duodenal solution and with 30 ml bile (intestinal phase). The two suspensions obtained (gastric and intestinal) were centrifuged for 30 min at 12,000 g to separate digestive juice from digested sample.
An aliquot (50 ml) of the final solution (≈ 200 ml) was extracted with 300 ml ethyl acetate, dried under nitrogen, redisolved in 1.5 ml of 80% ethanol and analyzed for polyphenols, ORAC
and AVN concentration. A blank sample was also prepared, in order to take into account possible impurity of reagents and release from containers.
Relative bioaccessibility (%) was calculated as follows = phenols of digested fraction/phenols of cookies (d.w.) x100.
Absolute bioaccessibility (mg per serving) was calculated as follows = phenols of cookies (d.w.) x (relative bioaccessibility, %) x serving size (50 g).
Table 3. Three-stage in vitro digestion procedure.
Digestion Sample Extraction reagent Temperature
(°C)
Time (min)
Oral phase 2g 30 ml of salivary 37 5’
Gastric phase
The suspension resulting after the first phase
45ml of gastric solution 37 120’
Intestinal phase 90 ml of duodenal solution
and 30 ml of biliar solution 37 120’
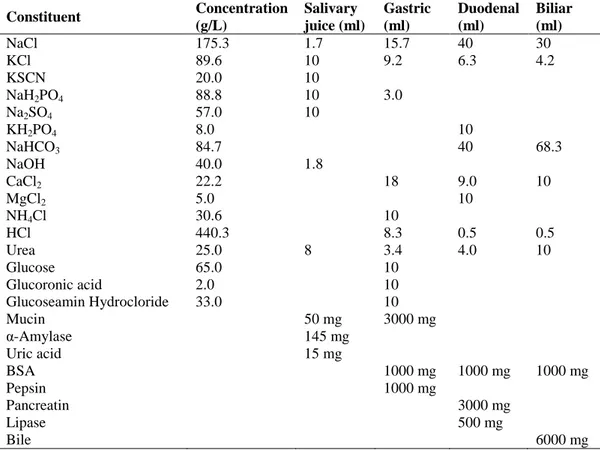
Table 4 shows the digestive juices and their relevant concentrations used to simulate a complete digestion (oral + gastric + intestinal).
Table 4. Composition of 1L of salivary, gastric, duodenal and biliar juices. Constituent Concentration (g/L) Salivary juice (ml) Gastric (ml) Duodenal (ml) Biliar (ml) NaCl 175.3 1.7 15.7 40 30 KCl 89.6 10 9.2 6.3 4.2 KSCN 20.0 10 NaH2PO4 88.8 10 3.0 Na2SO4 57.0 10 KH2PO4 8.0 10 NaHCO3 84.7 40 68.3 NaOH 40.0 1.8 CaCl2 22.2 18 9.0 10 MgCl2 5.0 10 NH4Cl 30.6 10 HCl 440.3 8.3 0.5 0.5 Urea 25.0 8 3.4 4.0 10 Glucose 65.0 10 Glucoronic acid 2.0 10 Glucoseamin Hydrocloride 33.0 10 Mucin 50 mg 3000 mg α-Amylase 145 mg Uric acid 15 mg BSA 1000 mg 1000 mg 1000 mg Pepsin 1000 mg Pancreatin 3000 mg Lipase 500 mg Bile 6000 mg
Cell cultures
HepG2 and Hep3B liver cancer cell lines and CaCo-2 colon cancer cell line were purchased from the American Type Culture Collection (ATCC, Rockville, USA).
CaCo-2 and HepG2 were maintained in DMEM supplemented with 10% FBS, 2 mM glutamine, 100 U/ml penicillin, 100 µg/ml streptomycin and 100 µM MEM non-essential amino acid solution. Hep3B cancer cells were kept in the same medium, but with the addition of 200 µM MEM non-essential amino acid solution. NCTC 2544 normal human keratinocytes were obtained from Interlab Cell Line Collection (ICLC, Genova, Italy) and maintained in DMEM supplemented with 10% FBS, 2 mM glutamine, 100 U/ml penicillin, 100 µg/ml streptomycin. Cell lines were grown at 37°C in a humidified atmosphere with 5% CO2.
Sulforhodamine B (SRB) assay
Cells (104/well for CaCo-2, Hep3B and NCTC 2544; 2x10⁴/well for HepG2) were plated in 96-well plates and treated with AVNs, for 24, 48 and 72 hours. At the end of treatment, cells were incubated with SRB as previously reported (Farabegoli et al., 2017). The results were expressed as the percentage of cell viability, compared to control untreated cells (100% viability).
Cellular Antioxidant Capacity (CAA)
Cells were seeded (2x10⁵ for CaCo-2 and 3x10⁵ for HepG2) in 6-well plates and treated for 24h with AVNs. After removing of cell medium, the H2O2-mediated production of ROS in CaCo-2
and HepG2 cells was monitored following the procedure previously reported (Farabegoli et al., 2017), with the substitution of PBS with HBSS-- only.
After the incubation with 10 μM 2’,7’-dichlorodihydrofluorescein diacetate (DCFH-DA) for 20 min in the dark, the cells were observed at microscope with a green FITC filter (OLYMPUS IX51). Cells showing a bright and intense green fluorescence were counted as positive, whereas cells with no or low fluorescence were counted as negative. Three fields per sample were analyzed and each time at least 100 cells were counted. Three independent experiments were performed for both CaCo-2 and HepG2 cells and results were expressed as % DCF fluorescent positive cells versus control. The images were obtained using the software OLYMPUS Ps-blm1.
Caspase 3, 9, 8 and 2 activities
CaCo-2, HepG2, Hep3B cells were untreated, or treated with AVNs for 24 or 48 h, then the Petri dishes were put in ice and the cytosols were extracted following the procedure previously reported (Scarpa et al., 2016).
Caspase 3, 9, 8 and 2 activities were assessed through the Caspase Colorimetric Assay Kit (BioVision, Milpitas, USA) according to the manufacturer’s instructions. First, 100 µg of cytosol from untreated or treated CaCo-2, HepG2 and Hep3B cells was incubated with the caspase reaction buffer (25 mM Hepes pH 7.4, 50 mM NaCl, 0.05% CHAPS, 0.5 mM EDTA, 5% glycerol, 5 mM DTT), then the substrate (200 µM final concentration) DMQD-pNA specific for caspase 3, or IETD-pNA specific for caspase 8, or LEHD-pNA specific for caspase 9, or VDVAD-pNA specific for caspase 2, was added. The samples were then transferred to a 96-well microplate and incubated at 37ºC for 2h. The absorbance was measured at λ=405 nm in a microplate reader (BioRad Laboratories, Hercules, USA).
RNA extraction, cDNA production and RTqPCR experiments
Total RNA was extracted from CaCo-2, HepG2 and Hep3B cells using the TriReagent (Invitrogen, Carlsbad, USA), following the manufacturer’s protocol. cDNA production and RTqPCR assays were performed as previously reported (Scarpa et al., 2016), using the KAPA SYBR Fast (2x) ABI PRISM qPCR Kit (KAPA Biosystems Inc., Cape Town, South Africa) and the ABI PRISM 7700 Sequence Detector (Applied Biosystems Inc., Foster City, USA). Thermal cycling conditions were as follows: 95ºC for 10’, followed by 40 cycles of 15’’ at 95ºC, 15’’ at 60ºC, 15’’ at 72ºC. The 2-ΔΔCt
method (Livak method) was used for relative quantification of gene expression. β-Actin was utilized as the housekeeping gene.
The following primers were used: β-Actin F: 5’-GCGAGAAGATGACCCAGATC-3’ , R: 5’-GGATAGCACAGCCTGGATAG-3’; COX-2 F: 5’-CACCCATGTCAAAACCGAGG-3’ ,
R: 5’-CCGGTGTTGAGCAGTTTTCTC-3’; HIF1A F:
5’-TCTGGGTTGAAACTCAAGCAACTG-3’, R:
5’-CAACCGGTTTAAGGACACATTCTG-3’ (150 bp); VEGFA F:
5’-TCACAGGTACAGGGATGAGGACAC-3’, R:
COX-2 activity assay
CaCo-2 and Hep3B cytosols were extracted as previously described (Guo et al., 2010), but using the COX lysis buffer (100 mM Tris/HCl pH 7.8, 1 mM EDTA). The protein concentration was assessed by the Bradford assay (Biorad Laboratories, Hercules, USA), measuring the absorbance values at λ=595 nm. COX-2 activity was assessed using the COX Activity Assay Kit (Cayman chemical, USA) according to the manufacturer’s instructions. Subsequently, 150 µg of proteins were incubated for 10 min at 25 ºC with either the COX assay buffer (100 mM Tris/HCl pH 8.0) (CTRL), COX-1 inhibitor SC-560, SC-560 and 110 µM AVNs. The samples were then incubated with 210 µM arachidonic acid and the colorimetric substrate TMPD. The absorbance of the samples was measured at λ=590 nm, using a spectrophotometer. The following formula was used to calculate the enzymatic activity: COX Activity = (ΔA590 nm/10 min/0.00826 µM-1) x 1.0 ml/ml of cell cytosol / 2.
Statistical analysis
Chemical analyses (FPs, BPs, AVNs, DPPH, ABTS assays) were performed in triplicate, and the results were reported as the mean value ± standard deviations (SD). ORAC assay was established by eight independent determinations for each sample; each value was the mean ± SD. Linear regression analysis and Pearson's correlation coefficient were performed using Microsoft Excel® software; statistical differences were calculated using the Student's t-test and one-way ANOVA with the SPSS® 17.0 software (SPSS Inc., IBM, Chicago, USA).
Results and discussion
Morphology of oat caryopsis
The caryopsis of cereals contains specific nutrients (Fardet, 2010; Liu, 2007; van der Kamp et al., 2014), unevenly distributed within its botanical fractions, i.e. the outer layers, including the aleurone, the starchy endosperm and the germ (Fardet, 2010; Zielinski and Kozlowska, 2000). Nutrient concentration in grains is generally assessed by analytical destructive techniques (i.e. spectrophotometer, HPLC). However, the knowledge of the specific localization of nutrients in the caryopsis is considered of importance for two main reasons: a) to understand the nutritional value of whole grain flour (WGF); b) to regulate the industrial processes of grain transformation into WGF, in order to save nutrients (Rosa-Sibakov et al., 2015).
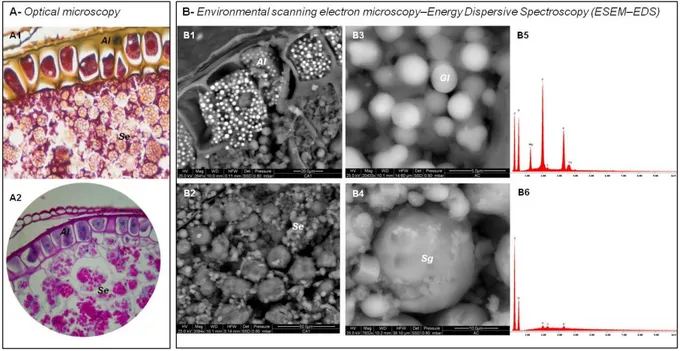
Regarding the localization on nutrients, we performed an imaging analysis of oat caryopsis based on light microscopy (Fig. 5A) and environmental scanning electron microscopy–energy dispersive spectroscopy (ESEM–EDS) (Fig. 5B), in order to characterize the main structural fraction.
Figure 5. Light microscopy (A) and ESEM-EDS (B) micrographs of oat caryopsis. Al, aleurone; Se,
Fig. 6 shows the aleurone (Al) and starch endosperm (Se) of oat caryopsis at higher magnification.
Examining the morphology, the aleurone is characterized by one line of cells divided by thick walls (Fig. 6 A1, B1). The ESEM-EDS technique revealed the presence of several globoids (Gl) within each aleurone cell, 1-2 µm in diameter (Fig. 6 B3), constituted by a remarkable concentration of P, related to the presence of phytic acid, as well as Mg, K and Ca (Fig. 6 B5). Depending on the refining level, part of the aleurone is discarded as bran during milling, along with phytic acid, which is interesting for its health protective functions (Abebe et al., 2007; Ockenden et al., 2004; Silva and Bracarense, 2016).
Oat starch endosperm was characterized by granules (Sg) of different shapes and sizes, appearing as if they had formed through the aggregation of several smaller granules (Fig. 6 A2, B2). According to the literature, the structure and properties of these granules are influenced by the amount of lipids associated with the starch (Gudmundsson and Eliasson, 1989; Morrison, 1988). The elemental composition of starch granules (Fig. 6 B4), detected by ESEM-EDS, revealed the presence of C and O, accounting for about 99.6% of starch polysaccharides. The chemical elements P, S, and K constituted the remaining 0.4% (Fig. 6 B6).
Figure 6. Higher magnification images of aleurone and starchy endosperm of oat caryopsis revealed by
light microscopy (A) and ESEM-EDS (B).
Sections were stained using the Azan Trichrome kit according to Heidenhain staining (A1, x20) and Periodic acid-Shiff staining (A2, x60). ESEM-EDS micrographs of aleurone (Al, B1), starch endosperm (Se, B2), globoids of aleurone (Gl, B3), starch granules of endosperm (Sg, B4). ESEM-EDS spectra of globoids of aleurone (B5) and starch granules of endosperm (B6).
Effect of genotype on antioxidant levels
The AVN content is strictly influenced by genetic and environmental factors (Redaelli et al., 2016; Yang et al., 2014). Among oats, naked oat, a variety where the hulls are genetically removed, has been receiving growing interest due to its higher protein and lipid levels than husked oat (Biel et al., 2014). In addition, naked oat allows food industries to reduce the production costs, as the dehulling step is avoided and moreover it is easily utilized for malting processes. As the hulls must be removed from husked oat because they are unpalatable (Singh et al., 2013), a comparison of the non-caloric nutrient content between naked and dehulled oat cultivars has been considered by us a point of interest for health professionals and technologists.
For these reasons, 15 naked and 15 dehulled oat cultivar samples (cvs.) were analyzed by us for their antioxidant molecules, including free (FPs) and bound (BPs) polyphenols and total AVNs (2c + 2p + 2f).
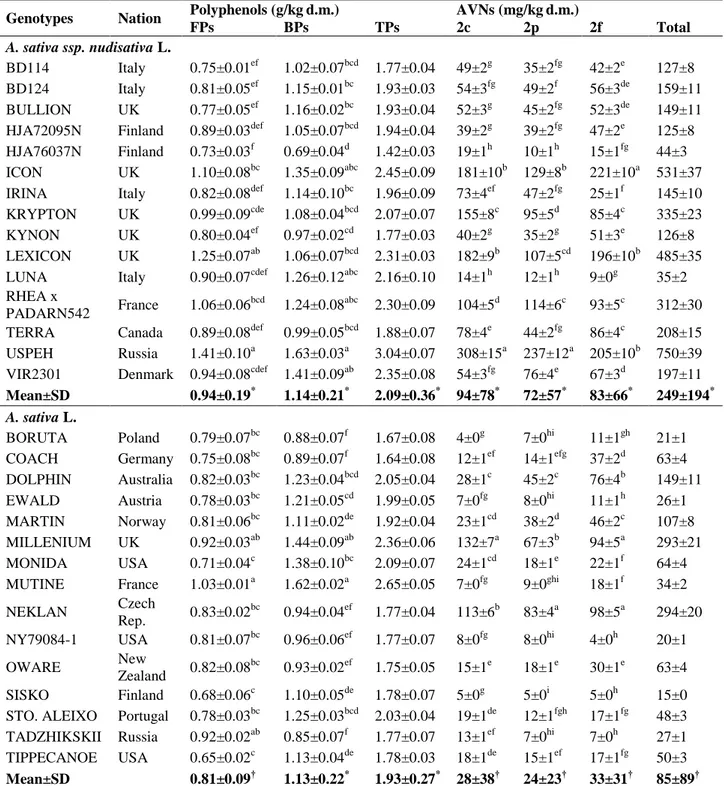
Data at harvest allowed us interesting comparative considerations among cvs. (Table 5). In fact, total polyphenols (TPs) of the 30 oat genotypes did not show any differences between the mean values of the two groups (naked and dehulled).
Despite this, when individual free (FPs) and bound (BPs) polyphenols were compared, it was observed that inside to each group, BP values were higher than FP values (Table 5), thus confirming data reported in literature (Adom and Liu, 2002; Verardo et al., 2011). Moreover, FPs were significantly higher in naked than in dehulled oats (Table 5).
The individual AVNs (2c, 2p, 2f) and their sum were found to be roughly three times higher in naked than in dehulled oats (Table 5), thus suggesting that genotype is the main determinant, as previously reported (Redaelli et al., 2016). In naked oats, the 2c form, containing caffeic acid, is the most important representative, whereas in dehulled oats, the 2f form, composed by ferulic acid, is the dominant. Our AVNs data, related to naked oats, agree with data from other authors (Tong et al., 2014).
Table 5. Content of polyphenols and AVNs in 30 oat cultivars.
Genotypes Nation Polyphenols (g/kgd.m.) AVNs (mg/kgd.m.)
FPs BPs TPs 2c 2p 2f Total
A. sativa ssp. nudisativa L.
BD114 Italy 0.75±0.01ef 1.02±0.07bcd 1.77±0.04 49±2g 35±2fg 42±2e 127±8
BD124 Italy 0.81±0.05ef 1.15±0.01bc 1.93±0.03 54±3fg 49±2f 56±3de 159±11
BULLION UK 0.77±0.05ef 1.16±0.02bc 1.93±0.04 52±3g 45±2fg 52±3de 149±11
HJA72095N Finland 0.89±0.03def 1.05±0.07bcd 1.94±0.04 39±2g 39±2fg 47±2e 125±8
HJA76037N Finland 0.73±0.03f 0.69±0.04d 1.42±0.03 19±1h 10±1h 15±1fg 44±3
ICON UK 1.10±0.08bc 1.35±0.09abc 2.45±0.09 181±10b 129±8b 221±10a 531±37
IRINA Italy 0.82±0.08def 1.14±0.10bc 1.96±0.09 73±4ef 47±2fg 25±1f 145±10
KRYPTON UK 0.99±0.09cde 1.08±0.04bcd 2.07±0.07 155±8c 95±5d 85±4c 335±23
KYNON UK 0.80±0.04ef 0.97±0.02cd 1.77±0.03 40±2g 35±2g 51±3e 126±8
LEXICON UK 1.25±0.07ab 1.06±0.07bcd 2.31±0.03 182±9b 107±5cd 196±10b 485±35
LUNA Italy 0.90±0.07cdef 1.26±0.12abc 2.16±0.10 14±1h 12±1h 9±0g 35±2
RHEA x
PADARN542 France 1.06±0.06
bcd 1.24±0.08abc 2.30±0.09 104±5d 114±6c 93±5c 312±30
TERRA Canada 0.89±0.08def 0.99±0.05bcd 1.88±0.07 78±4e 44±2fg 86±4c 208±15
USPEH Russia 1.41±0.10a 1.63±0.03a 3.04±0.07 308±15a 237±12a 205±10b 750±39
VIR2301 Denmark 0.94±0.08cdef 1.41±0.09ab 2.35±0.08 54±3fg 76±4e 67±3d 197±11
Mean±SD 0.94±0.19* 1.14±0.21* 2.09±0.36* 94±78* 72±57* 83±66* 249±194*
A. sativa L.
BORUTA Poland 0.79±0.07bc 0.88±0.07f 1.67±0.08 4±0g 7±0hi 11±1gh 21±1
COACH Germany 0.75±0.08bc 0.89±0.07f 1.64±0.08 12±1ef 14±1efg 37±2d 63±4
DOLPHIN Australia 0.82±0.03bc 1.23±0.04bcd 2.05±0.04 28±1c 45±2c 76±4b 149±11
EWALD Austria 0.78±0.03bc 1.21±0.05cd 1.99±0.05 7±0fg 8±0hi 11±1h 26±1
MARTIN Norway 0.81±0.06bc 1.11±0.02de 1.92±0.04 23±1cd 38±2d 46±2c 107±8
MILLENIUM UK 0.92±0.03ab 1.44±0.09ab 2.36±0.06 132±7a 67±3b 94±5a 293±21
MONIDA USA 0.71±0.04c 1.38±0.10bc 2.09±0.07 24±1cd 18±1e 22±1f 64±4
MUTINE France 1.03±0.01a 1.62±0.02a 2.65±0.05 7±0fg 9±0ghi 18±1f 34±2
NEKLAN Czech Rep. 0.83±0.02 bc 0.94±0.04ef 1.77±0.04 113±6b 83±4a 98±5a 294±20 NY79084-1 USA 0.81±0.07bc 0.96±0.06ef 1.77±0.07 8±0fg 8±0hi 4±0h 20±1 OWARE New Zealand 0.82±0.08 bc 0.93±0.02ef 1.75±0.05 15±1e 18±1e 30±1e 63±4 SISKO Finland 0.68±0.06c 1.10±0.05de 1.78±0.07 5±0g 5±0i 5±0h 15±0
STO. ALEIXO Portugal 0.78±0.03bc 1.25±0.03bcd 2.03±0.04 19±1de 12±1fgh 17±1fg 48±3
TADZHIKSKII Russia 0.92±0.02ab 0.85±0.07f 1.77±0.07 13±1ef 7±0hi 7±0h 27±1
TIPPECANOE USA 0.65±0.02c 1.13±0.04de 1.78±0.03 18±1de 15±1ef 17±1fg 50±3
Mean±SD 0.81±0.09† 1.13±0.22* 1.93±0.27* 28±38† 24±23† 33±31† 85±89†
FPs, free polyphenols; BPs, bound polyphenols; TPs, total polyphenol (TPs = FPs + BPs); AVNs, avenanthramides. Different letters (a,b) indicate a statistically significant difference among cvs. of each group (ANOVA test); different symbols (*,†) indicate a statistically significant difference between the mean values of each group (Student’s t test).
Effect of storage conditions of antioxidant levels
The caryopsis of cereals is constituted by living cells in the aleurone and germ, which slowly metabolize nutrients during storage. Although several reports analyzed the variability ranges of the health protective nutrients in naked and husked cultivars at harvest (Bratt et al., 2003; Bryngelsson et al., 2002; Emmons and Peterson, 2001; Mattila et al., 2005; Redaelli et al., 2016; Yang et al., 2014), the extent of their changes during storage have never been investigated, particularly those regarding the free and bound phenols and their antioxidant capacities.
For these reasons, we measured the stability of antioxidant molecules, over 12 months of storage, in a cold room at + 7°C and 55% relative humidity, in a group of six naked and six dehulled cvs., selected among the 30 oat genotypes described in the previous paragraph.
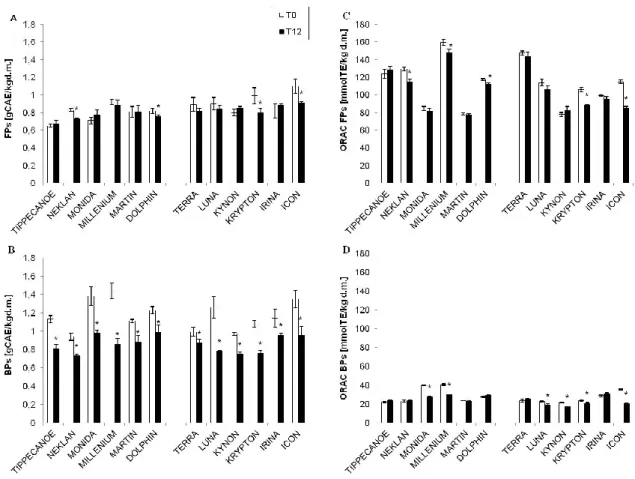
After 12 months of storage, BPs (Fig. 7B) were significantly reduced compared to FPs (Fig. 7A), which seemed to be more preserved.
Regarding the antioxidant capacity, the ORAC values of FPs showed a significant decay from T0 to T12, paralleling that observed in the Folin-Ciocalteu assay of polyphenols. Nevertheless, FPs (Fig. 7C) showed ORAC values about five fold higher than those of BPs (Fig. 7D), due to the relevant presence of soluble phenols, including AVNs, which better scavenge peroxyl radicals than BPs (Adom and Liu, 2002).
Considering the average values of naked and dehulled oats, in terms of antioxidant capacity, our data show that FPs contribute with 11,300 μmolTE/100 g of wholegrain flour (WGF), whereas the antioxidant activity of BPs was around 2,000 μmolTE/100 g, which brings the total ORAC (FPs+BPs) to 13,300 μmolTE/100 g of WGF.
Figure 7. Changes of free (FP, A) and bound (BP, B) phenol contents and their antioxidant capacities,
detected by the ORAC method (ORAC of FPs, C; ORAC of BPs, D), at time zero (T0) and after 12 months of storage (T12), in 12 oat cultivars (six dehulled and six naked).
* indicating the cultivar which showed a statistically significant reduction at T12, with respect to T0, by Student’s t-test with p < 0.05. FP and BP values are expressed as g of caffeic acid equivalents (CAE) kg-1 dry matter (d.m.). ORAC values are expressed as mmol of Trolox equivalents (TE) kg-1 d.m.
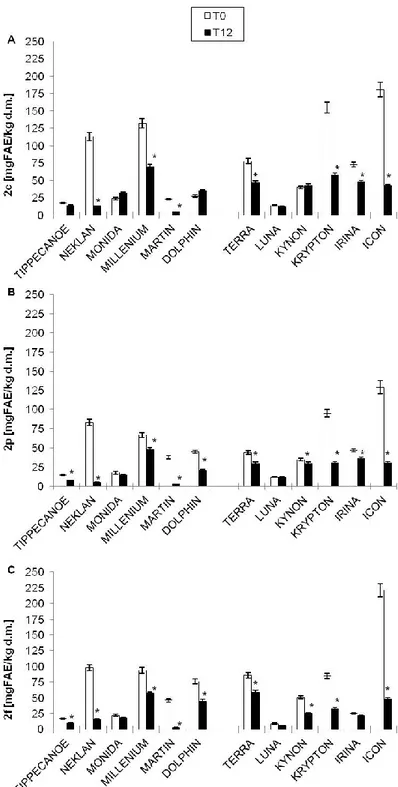
After 12 months of storage, individual AVNs (2c, 2p, 2f) showed a reduction in their concentration, ranging from 15 to 90 %, in most of the analyzed cultivars (Fig. 8). Only two samples, LUNA among naked and MONIDA among dehulled, showed no significant reduction in any AVN form (Fig. 8).
Among the three AVNs, the 2c (Fig. 8A) appeared to be the most preserved form after 12 months of storage, as compared to 2p (Fig. 8B) and 2f (Fig. 8C), though other authors found to be the most sensitive one when subjected to different treatments (Dimberg et al., 2001). Interestingly, it seemed that the AVN decrease was higher in those samples which showed the highest levels at T0. Indeed, those cultivars with lower AVN values at T0 showed a very small or no decay. This occurs very likely because the metabolite synthetic machinery is always balanced by a similar expression of the degradative machinery, in order to adapt the vegetable to different environmental conditions (Frati et al., 2016).
Figure 8. Changes of the three main avenanthramide (AVN 2c, 2p, 2f) contents, at time zero (T0) and
after 12 months of storage (T12), in 12 oat cultivars (six dehulled and six naked).
* indicating the cultivar which showed a statistically significant reduction at T12, with respect to T0, by Student’s t-test with p < 0.05. AVN values are expressed as mg of ferulic acid equivalent (FAE) kg-1 dry
Effect of mechanical processing of antioxidant levels
The two main processes involved in grain transformation are dehulling and milling, both influenced by the mechanical applied pressure and moisture of the grains (Kaur et al., 2014). When grains are processed into flours, nutrients inside the endosperm caryopsis are conserved, whereas those linked to the aleurone are partially lost in the bran fraction. In fact, the milling process breaks the outer layers of the caryopsis (Fig. 9A) into large plaques, covered by starch (Fig. 9B); whereas the oat flour is primarily constituted by disrupted starchy granules and traces of residual bran fractions (Fig. 9C).
Concerning the outer layers, they are rich of phenolic compounds. The fluorescent light (Fig. 9D) highlighted the polyhedral structures associated with ferulic acid (Fulcher, 1982), which was found to be abundant in the bran (Fig. 9E) and in traces in the flour (Fig. 9F). Although autofluorescence does not allow the identification of the nature of phenol compounds, it can be useful to understand that it is better to mill as mild and prolonged as possible, till when the bran is grounded into fine particles, to avoid excessive separation of the bran from the flour and loss of phenols.
Figure 9. Intact oat caryopsis (A), oat bran (B) and flour (C) observed by optical microscopy after
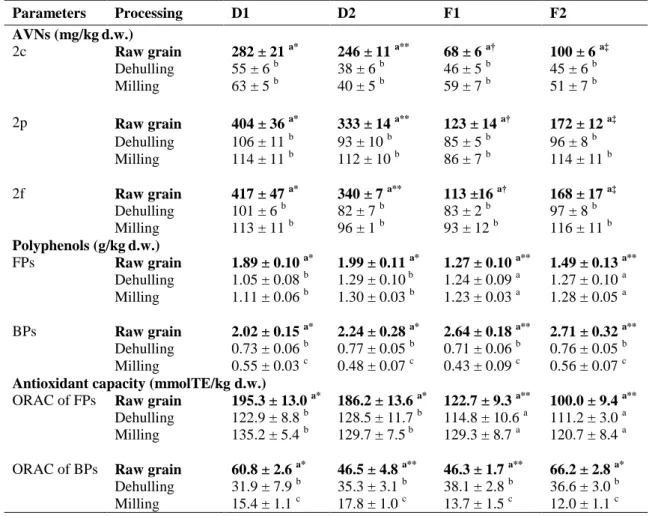
The effect of industrial dehulling and milling on AVNs, total polyphenols, and their antioxidant capacities, was observed by us in two husked oat cultivars, grown in two different soils, labeled as: D1, cv. Donata in loamy soil; D2, cv. Donata in a medium texture soil; F1, cv. Flavia in loamy soil; F2, cv. Flavia in a medium texture soil.
Both mechanical processes reduced AVNs, polyphenols and ORAC values, excluding the original differences stemming from genotype or soil, which were evident in the raw grains (Table 6). The genotype played an important role on AVN content, as cv. Donata showed about three fold higher AVN values than cv. Flavia, as well as the interaction soil x genotype, with D1>D2 and F2>F1 (Table 6). Moreover, in the raw Donata grains, free (FPs) and bound (BPs) polyphenols were in equal concentration (Table 6), whereas in the raw Flavia grains, BPs were significantly higher than FPs. Nevertheless, the ORAC values of FPs were significantly higher than those of BPs, in all samples (Table 6), due to the relevant presence of AVNs, which provide a higher number of hydroxyl groups able to better scavenge peroxyl radicals than BPs, in the ORAC test (Prior, 2015).
Dehulling markedly decreased the three AVN forms (2c, 2p, 2f), bound polyphenols (BPs) and their corresponding ORAC values, in all samples (Table 6). Free polyphenols (FPs) remained stable in both Flavia groats, whereas they were reduced in both Donata groats (Table 6). The reduction of AVNs after dehulling can be explained by the fact that they are primarily located in hulls and in the outer layers of the caryopsis, including the aleurone (Yang et al., 2014).
Milling did not affect AVNs, FPs and their antioxidant capacities in any of the samples (Table 6). However, it further reduced BPs in both cvs. with a consequent drop in the ORAC values of BPs to one half of the values found in the dehulled groats (Table 6), due to the removal of the fiber to which BPs are covalently bound (Verardo et al., 2011).
Table 6. Effect of mechanical processing on antioxidant levels.
Parameters Processing D1 D2 F1 F2
AVNs (mg/kgd.w.)
2c Raw grain 282 ± 21 a* 246 ± 11 a** 68 ± 6 a† 100 ± 6 a‡
Dehulling 55 ± 6 b 38 ± 6 b 46 ± 5 b 45 ± 6 b
Milling 63 ± 5 b 40 ± 5 b 59 ± 7 b 51 ± 7 b
2p Raw grain 404 ± 36 a* 333 ± 14 a** 123 ± 14 a† 172 ± 12 a‡
Dehulling 106 ± 11 b 93 ± 10 b 85 ± 5 b 96 ± 8 b
Milling 114 ± 11 b 112 ± 10 b 86 ± 7 b 114 ± 11 b
2f Raw grain 417 ± 47 a* 340 ± 7 a** 113 ±16 a† 168 ± 17 a‡
Dehulling 101 ± 6 b 82 ± 7 b 83 ± 2 b 97 ± 8 b
Milling 113 ± 11 b 96 ± 1 b 93 ± 12 b 116 ± 11 b
Polyphenols (g/kgd.w.)
FPs Raw grain 1.89 ± 0.10 a* 1.99 ± 0.11 a* 1.27 ± 0.10 a** 1.49 ± 0.13 a**
Dehulling 1.05 ± 0.08 b 1.29 ± 0.10 b 1.24 ± 0.09 a 1.27 ± 0.10 a
Milling 1.11 ± 0.06 b 1.30 ± 0.03 b 1.23 ± 0.03 a 1.28 ± 0.05 a
BPs Raw grain 2.02 ± 0.15 a* 2.24 ± 0.28 a* 2.64 ± 0.18 a** 2.71 ± 0.32 a**
Dehulling 0.73 ± 0.06 b 0.77 ± 0.05 b 0.71 ± 0.06 b 0.76 ± 0.05 b
Milling 0.55 ± 0.03 c 0.48 ± 0.07 c 0.43 ± 0.09 c 0.56 ± 0.07 c
Antioxidant capacity (mmolTE/kg d.w.)
ORAC of FPs Raw grain 195.3 ± 13.0 a* 186.2 ± 13.6 a* 122.7 ± 9.3 a** 100.0 ± 9.4 a**
Dehulling 122.9 ± 8.8 b 128.5 ± 11.7 b 114.8 ± 10.6 a 111.2 ± 3.0 a
Milling 135.2 ± 5.4 b 129.7 ± 7.5 b 129.3 ± 8.7 a 120.7 ± 8.4 a
ORAC of BPs Raw grain 60.8 ± 2.6 a* 46.5 ± 4.8 a** 46.3 ± 1.7 a** 66.2 ± 2.8 a*
Dehulling 31.9 ± 7.9 b 35.3 ± 3.1 b 38.1 ± 2.8 b 36.6 ± 3.0 b
Milling 15.4 ± 1.1 c 17.8 ± 1.0 c 13.7 ± 1.5 c 12.0 ± 1.1 c
Each value is shown as mean ± standard deviation and is expressed on dry weight (d.w.).
AVNs, avenanthramides; D1, cv. Donata in loamy soil; D2, cv. Donata in medium texture soil; F1, cv. Flavia in loamy soil; F2, cv. Flavia in medium texture soil; FPs, free phenols; BPs, bound phenols; ORAC, Oxygen Radical Absorbance Capacity. a-c Values with different lower case letters in the same column, for each parameter, indicate significant differences (p < 0.05) along the processing chain, from raw grain to flour. *,† Different symbol in the same row indicate significant differences (p < 0.05) stemming from genotype or soil type.
Overall, these studies highlight that: (a) biodiversity in oats is mainly expressed by their content of micronutrients, and in particular by AVNs, whose levels are strictly related to genotype; (b) mechanical processing and storage conditions also have an impact on AVN content. Therefore, the choice of the cultivar, storage conditions and the technology of transformation are important tools to guarantee the maintenance of the highest AVN levels, which are the major healthy molecules considered in this thesis.
Effect of malting and cooking on antioxidant levels
Steeping and germination are the most common physiological ways to increase polyphenol and AVN concentrations (Bryngelsson et al., 2002; Skoglund et al., 2008; Xu et al., 2009). Nevertheless, a malting method able to prevent the seeds from germinating has been studied, in order to make the malted oats suitable for most commercial food processing procedures (Collins and Burrows, 2012).
In this study, we used the procedure which is generally performed in the brewing industry, in order to keep low the germination percentage of oats and to increase the AVN concentration for the formulation of cookies fortified with AVNs to be used for breakfast or snack.
First, we evaluate the change of free polyphenol (FP), antioxidant capacity and AVN levels in the Italian naked oat genotype (cv. Luna), during five days of malting (M0M5).
Interestingly, FP values tripled from M0 to M5, as well as their antioxidant capacities, measured by the ORAC method, thus confirming the link between the two parameters (Fig. 10).
Figure 10. Free polyphenols (FPs) and ORAC after five days of malting (M0-M5).
Regarding AVNs, we measured the concentration of the three main forms (2c, 2p, 2f) as well as other minor forms (2s, 2pd, 2fd) and their total, during five days of malting (Fig. 11). Total
AVNs showed about 10-fold higher values at M5 with respect to M0, although they seemed to level off in the range M3-M5.
Concerning the concentration of specific AVN forms, the 2c was the most representative, reaching values of 12 mg/100g d.w. at M5 (Fig. 11). Nevertheless, Lp and Lf showed the greatest increases during 5 days of malting, i.e. about 20-fold and 40-fold more than the starting levels, respectively.
Figure 11. Individual and total avenanthramides (AVNs) after five days of malting.
Second, we focused on the optimal ratios between the two main ingredients which constituted the food matrix of malted oat-based cookies: the wheat flour and the flour obtained from malted oat. As the total AVN concentration showed a leveling in the last three days of malting (Fig. 11), we decided to use the malted oat flour, obtained from M3, M4 and M5, in two different percentages, i.e. 35 % in the A triplet of cookies (3A, 4A, 5A), 45% in the B triplet of cookies (3B, 4B, 5B). For more details see note n. 9 of Material & Methods section.
Fig. 12 shows the FP and ORAC values of the six malted-oat based cookies. The best performances in terms of FPs and ORAC values were obtained in the 5A and 5B formulations (Fig. 12).
Figure 12. Free polyphenols (FPs, A) and antioxidant capacity (ORAC, B) in malted oat-based cookies.
FPs, values are expressed as mg per serving; ORAC, values are expressed as µmolTE per serving. Per
serving = 50 g of malted oat-based cookies, on dry weight. a,b Different letters indicate statistically significant differences (p<0.05 one-way ANOVA) among each triplet of cookies (3A, 4A, 5A; 3B, 4B, 5B). *p<0.05 (Student’s t test) compared to the corresponding ORAC value of 3A or 4A formulation.
Table 7 shows the individual and total AVN forms in malted oat-based cookies. In the A triplet of cookies, 2c, 2f and total AVN concentrations increased, with 5A > 4A > 3A, whereas all other forms showed a remarkable increase in the 5A formulation only (Table 7). In the B triplet, only the AVN 2f showed a gradual increase from 3B to 5B formulation, whereas all other forms remained rather stable. Comparing the same malting day, the differences were more evident, with 3B>3A, 4B>4A in all individual and total AVN forms (Table 7).
Table 7. Individual and total AVNs in malted oat-based cookies.
Cookies AVNs 2c 2p 2f 2s 2pd 2fd Total 3A 0.53±0.03a 0.45±0.02a 0.63±0.03a 0.21±0.03a 0.75±0.05a 0.29±0.02a 2.88±0.14a 4A 0.99±0.05b 0.47±0.03a 0.72±0.04b 0.25±0.01a 0.75±0.02a 0.30±0.05a 3.48±0.17b 5A 1.16±0.05c 0.62±0.03b 1.08±0.05c 0.55±0.05b 1.07±0.03b 0.47±0.02b 4.93±0.25c 3B 1.08±0.05a* 0.57±0.03a* 0.82±0.04a* 0.29±0.01a* 1.00±0.05a* 0.36±0.02a* 4.12±0.20a* 4B 1.43±0.08b* 0.65±0.05a* 1.01±0.05b* 0.35±0.05a* 1.05±0.05a* 0.43±0.02b* 4.92±0.25b* 5B 1.15±0.06a 0.59±0.02a 1.11±0.06c 0.47±0.03b 1.04±0.05a 0.44±0.02b 4.80±0.24b
AVNs, avenanthramides, values are expressed as mg per serving. Per serving = 50 g of cookies, on dry weight.
a,b
Different letters indicate, in each column, statistically significant differences (p<0.05 one-way ANOVA) among each triplet of cookies (3A, 4A, 5A; 3B, 4B, 5B). *p<0.05 (Student’s t test) compared to the corresponding AVN value of 3A or 4A or 5A.
Recovery of antioxidants after in vitro digestion
Taking into account the formulations which showed the best performance in terms of AVNs, i.e. 3B, 4B and 5B cookies, we carried out the in vitro gastrointestinal digestion, according to the procedure suggested by Oomen et al. (2003), in order to evaluate the bioaccessibility of polyphenols (FPs and AVNs) and their antioxidant capacity (ORAC). Bioaccessibility, i.e. the fraction of elements that is released from food matrix by the digestive juice (Versantvoort et al., 2005), allows to assess the fraction of elements that arrives into systemic circulation (bioavailability), which exerts a biological effect. The application of this in vitro digestion model, based on oral and gastric digestions followed by bile–pancreas solution, provides a useful alternative to animal and human models by screening food ingredients in a short time (Hur et al., 2011).
Fig. 13 shows the relative bioaccessibility (Fig. 13A), as well as the absolute bioaccessibility of FPs (Fig. 13B) and ORAC (Fig. 13C). Surprisingly, the recovery of FPs and ORAC, decreased in the following order: 3B > 4B > 5B. These results suggest that some phenol compounds, developed in the last days of malting, are lost during the transfer from the food matrix (starting formulation) to the bioaccessible fraction of the final digestion product, probably due to their instability under neutral or alkaline conditions applied in the in vitro digestion (Friedman and Jürgens, 2000).
Figure 13. Absolute and relative bioaccessibility of free polyphenols (A) and their antioxidant capacity
(B) from malted oat-based cookies.
Per serving = 50 g of malted oat-based cookies. a,b Different letters indicate, for absolute bioaccessibility, statistically significant differences among cookies (p<0.05 one-way ANOVA). *,† Different symbols indicate, for relative bioaccessibility, statistically significant differences among cookies (p<0.05 one-way ANOVA).