Received: 08 March 2019 Accepted: 25 June 2019 Published: 07 August 2019 http://www.aimspress.com/journal/agriculture
Research article
Comparative study of some fruit quality characteristics of two
of Annona cherimola Mill. grown in southern Italy
Gullo Gregorio*, Dattola Antonio and Zappia Rocco
Dept. AG.R.A.R.I.A., Mediterranean University of Reggio Calabria, Loc. Feo di Vit o, 89124 Reggio Calabria, Italy, UE.
* Correspondence: Email: [email protected]; Tel: +3909651694248; Fax: +3909651694248.
Abstract: This work aimed to analyse the differences between fruits obtained by different harvest
dates in two cultivars Annona cherimola (Fino de Jete and Campas) planted in Southern Italy. The fruits selected at the fruit-set time were harvested when 1500 Degree Day were accumulated. Fruits were sampled from October to December when 1500 Growing Degree Days (DD) were accumulated from fruit-set. Fruit fresh weight and skin colour were measured at harvest and after storage. The following parameters were also measured: Fruit shape, pulp colour, pulp firmness, number of seeds, total soluble solids, titratable acidity, ascorbic acid, total polyphenol content, total antioxidant capacity and fruit dry weight. An MFA was carried out. In the first phase of the MFA, a PCA was performed for each group of quantitative variables (PPCA). Then, the variables were divided into five groups: Carpological (CR), colourimetric (CL), maturation index (MI), nutraceutical (NU), and Environmental (Env). All relations between the variables and the formation of the factors were affected. The multifactorial factor analysis has allowed evaluating the role that the different groups of variables, taken into consideration, have in defining the time harvest. In order to have fruits of regular shape and size, the harvest must be carried out within the last ten days of October, involving the pollinated flower within the third week of June. About the size and regularity of the fruit, from the third week of June, it appears to be borderline, as the fruits are smaller in size, with fewer seeds, but still, guarantee size and shape that falls within the quality standards of the Annona cherimola. Between the two cultivars, Fino de Jete cultivar is more sensitive to temperature increases during the pollination period than the Campas cultivar.
1. Introduction
The genus Annona belongs to the family of the Annonaceae, a botanical family that includes more than 129 genera and 2000 species, many of which are cultivated in tropical and subtropical America [1]. The Annona cherimola Mill. species is originated in the valleys of the Andes, between Perù and Ecuador, and is known and used as food already from 1200 BC from the Inca tribe [2]. The name seems to derive from the Peruvian word chirimuya, whose meaning is cold seeds [3].
This species arrived in Europe in 1714 and Italy in 1827 in the city of Palermo [4]. From here, it reached the coasts of the province of Reggio Calabria in 1827 by G. Teneo, director of the Botanical Garden of Palermo [5]. Here, it is still cultivated for specific and favourable pedoclimatic conditions of this province [6] although on the limited extent (about 30 ha) [7] and often as subsidiary cultivation. The good production capacity in the coastal area of Calabria is due to somefundamental factors: the presence of the small-sized pollutants, optimal atmospheric humidity (70–80%), and optimal temperature (20–30 ℃) during flowering and pollination [8–12].
The phenological phase of flowering generally extends from the first ten days of April to the third decade of August.
The fruit, botanically a syncarp, is climacteric and the harvesting period is established by the colour of the peel, which turns from dark green to light -yellowish green, near physiological maturity [13–15]. The best quality characteristics the fruit reaches after having accumulated 1470 DD (Growing Degree Days) [16]. The ripening process takes place during the climacteric respiration and the ripening proceeds very quickly after harvesting [17,18]. It is reported that peak climacteric respiration is reached after 4–5 days of collection [19], while a second peak ten days after harvesting during which the fruit softens and develops the characteristic aromatic profiles [20]. When ripe, the fruits can reach high concentrations of soluble sugars (14–15%) and moderate levels of titratable acidity (0.4–0.7%). Good are the concentrations of both ascorbic acid (45–60 mg/100 g) and potassium (250–500 mg/100 g of edible portion).
This work aimed to compare the quality of two cultivars of Annona cherimola (Cherimoya) cultivated in Calabria, Southern Italy, and also evaluate the harvest period to which it corresponds the better quality fruit.
2. Materials and methods
2.1. The orchard
The orchard of Annona cherimola cv Fino de Jete and Campas, respectively ‘impressa’ and ‘umbonate’ type [21,22], grafted on seedling rootstocks, was planted in Reggio Calabria, Italy, (latitude, 38°11’12’’ N; longitude, 15°41’23’’ E), in 1994 with a North-South plant orientation in a deep sandy soil [sand 60.55%, clay 19.32%), pH = 6.86 ± 0.14, medium organic matter content 1.18% ± 0.08, electrical conductivity 0.17 ± 0.01 mS/cm, bulk density 1.29 g/cm3 ± 0.02, Cation Exchange Capacity 13.88 meq/100 g ± 0.72].
Trees were spaced 5 × 5m apart, and the orchard was managed using the standard integrated pest management system and stable drip irrigation and fertilisation system.
2.2. The experiment layout
The experiment was carried out during two years (2017 and 2018). Flowers were hand pollinated from the first decade of April to the end of August when the stigma was receptive, and the flower was fully open. Fruit-set ranged from 95% to 100% of pollinated flowers.
2.3. Fruit samples
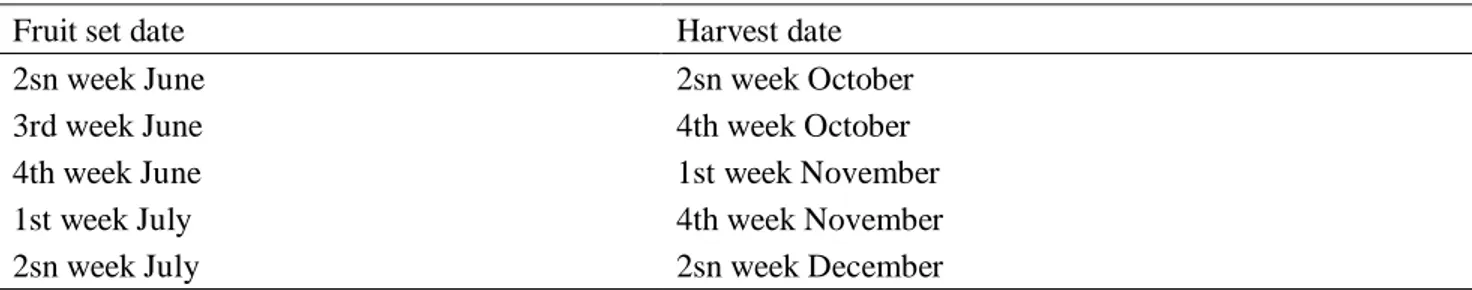
Six fruit-set dates were weekly selected from the first week of June to the second week of July. The fruit was harvested when 1500 Degree Days (DD) were accumulated from the fruit-set date at harvest time [16]. The DD parameter was calculated according to [23] using a base temperature of 12 ℃. According to this, fruit sampling started in the second week of October until the second week of December (Table 1). Each year, fruits were selected at fruit set time, and their development was measured from fruit-set to harvest. For each fruit-set date and each cultivar, 108 fruits were selected [6 replicates (fruits) × 6 treatment (fruit-set date) × 3 blocks (each tree was considered a single block)]. For each sampling, the fruits were used for measurements and analysis both harvest time (50%) and after storage (the remained 50%).
Table 1. Harvest time effected when the fruit had accumulated 1500 Degree Days from fruit-set date.
Fruit set date Harvest date
2sn week June 2sn week October
3rd week June 4th week October
4th week June 1st week November
1st week July 4th week November
2sn week July 2sn week December
2.4. Fruit measurements
Fresh weight (FW) was determined immediately after harvest at each sampling date and after storage for 4 d at 20 ℃, using an electronic balance (Mettler-Toledo MgbH, Grelfensee, Switzerland). At the end of the storage period, fruit weight loss (FWL) was calculated as the difference between fresh weight measured after and before storage and expressed as a percentage on a fresh weight basis. The polar and equatorial diameter at the maximum width was measured (in millimetres). At each harvest time, fruit shape was determined as fruit height to diameter (H/D) ratio and as symmetry: Percentage distribution on longitudinal face of the fruit of two parts separated by ideal and perpendicular central plane to the longitudinal section. Therefore a digital image processing software (Adobe Photoshop CS6 Extended, 2012) and the analysis tool allowed determining the area of the cross-section, which has been expressed in cm2 [24]. The scale adopted by ranging from 1 (irregular) to 5 (regular), was used to measure fruit symmetry index [25].
2.5. Colour determination
Skin and pulp colour were also measured at harvest and ripening, for each sampling, in terms of CIELAB (L*, a*, b*) and HSL (L*, Chroma, °Hue). To evaluate CIELab coordinates, we used a
portable spectrophotometer (CM 700d, Konica Minolta, Tokyo, Japan) with a D65 illuminant, previously calibrated with a white ceramic tile. Chroma value was calculated as [(a*2 + b*2)1/2] and represents the hypotenuse of a right triangle created by joining points (0,0), (a*, b*) and (a*, 0); °Hue value was calculated as [(arctan (b*/a*)]; it is defined as the angle between the hypotenuse and 0° on the* axis [26].
2.6 Fruit analysis
At harvest and after storage, fruits were analysed to determine firmness (kg·cm−2) using an 8-mm-diameter penetrometer with a metal point (PCE 100, Padova, Italy), total soluble solids (TSS), using a handheld digital refractometer (PR-1, Atago, Japan) and titratable acidity, using 10 mL Annona juice diluted with distilled water (1:1) and titrated to pH 8.2 with 0.1 N NaOH (mEq. NaOH/100 g. fresh fruit). The determined values were expressed in mg of malic acid/100 mL of juice. After these evaluations, the number of seeds counted, and the seed index was calculated as the number of seeds per 100 g of fresh weight of the fruit [27]. Ascorbic acid (AA) content in Annona juices was estimated by the volumetric method, using the procedure based on the reduction of the dye 2.6-dichlorophenol-indophenol (DIP) by the AA. Annona fresh tissue (3 g) was mixed with 20 mL (3%) metaphosphoric acid and homogenized. Ascorbic acid was determined by titration of 15 mL filtrated juices by DIP containing bicarbonate sodium. The measures were expressed as mg of ascorbic acid/100 g FW.
2.7. Experimental layout and statistical analysis
The experiment was set up in a randomised block design, with three randomised blocks made of 3 single tree replicates per treatments (six fruit-set dates) in each block. All the data were analysed using ANOVA to determine the significance of differences between cultivar which consisted of harvest time. Differences were calculated according to the Tukey’s test being considered significant at p ≤ 0.05.
Successively, MFA was performed in two stages, and all parameters to observation were aggregated in five groups: Carpological (CR), colourimetric (CL), maturation index (MI), nutraceutical (NU), and Environmental (ENV). Initially, partial principal components analysis (PPCA) for the groups of variables, ending with the MFA global analysis [28]. Finally, the Agglomerative Hierarchical Clustering (AHC) was added.
3. Results and discussion
The first objective was to verify the differences in the fruit of the two cultivars. Leavin g aside morphological differences that lead to classify the two cultivars as impressa or umbonata type [17], the other biometric and chemical parameters of fruits of the Campas and Fino De Jete were compared at harvest and the end of shelf-life.
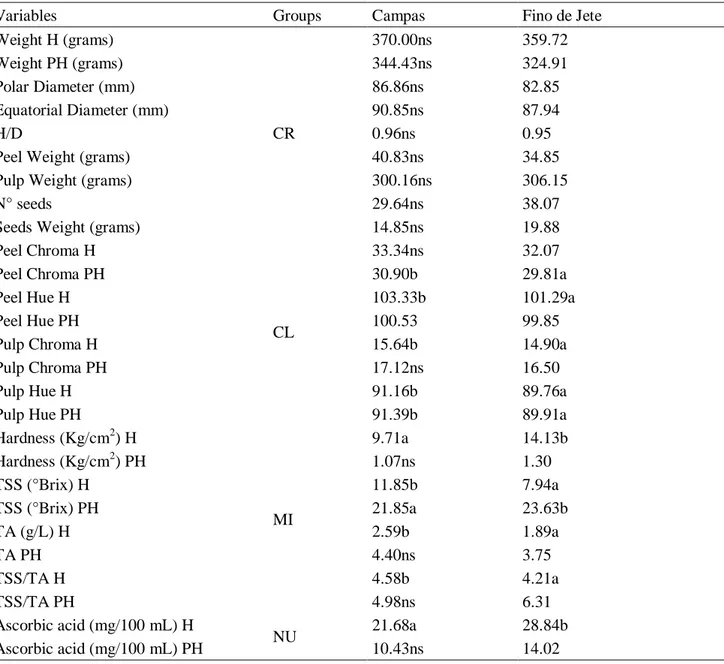
No significant differences were observed among the two cultivars for many parameters of CR group as polar and transversal diameter, fresh weight of whole fruit, weight peel and pulp, H/D ratio, seeds number and shape fruit (Table 2). A loss weight of 7% for the fruit of Fino De Jete and 10 % for Campas was recorded after storage (Table 2).
Table 2. ANOVA of individual variables in the variable groups.
Variables Groups Campas Fino de Jete
Weight H (grams) CR 370.00ns 359.72 Weight PH (grams) 344.43ns 324.91 Polar Diameter (mm) 86.86ns 82.85 Equatorial Diameter (mm) 90.85ns 87.94 H/D 0.96ns 0.95
Peel Weight (grams) 40.83ns 34.85
Pulp Weight (grams) 300.16ns 306.15
N° seeds 29.64ns 38.07
Seeds Weight (grams) 14.85ns 19.88
Peel Chroma H
CL
33.34ns 32.07
Peel Chroma PH 30.90b 29.81a
Peel Hue H 103.33b 101.29a
Peel Hue PH 100.53 99.85
Pulp Chroma H 15.64b 14.90a
Pulp Chroma PH 17.12ns 16.50
Pulp Hue H 91.16b 89.76a
Pulp Hue PH 91.39b 89.91a
Hardness (Kg/cm2) H MI 9.71a 14.13b Hardness (Kg/cm2) PH 1.07ns 1.30 TSS (°Brix) H 11.85b 7.94a TSS (°Brix) PH 21.85a 23.63b TA (g/L) H 2.59b 1.89a TA PH 4.40ns 3.75 TSS/TA H 4.58b 4.21a TSS/TA PH 4.98ns 6.31 Ascorbic acid (mg/100 mL) H NU 21.68a 28.84b Ascorbic acid (mg/100 mL) PH 10.43ns 14.02
Note: Mean values followed by the same letter in the same line do not differ in the Tukey test at p < 0.05.
The pulp of the Fino de Jete fruit was 45% harder than Campas at harvest (Table 2). Many authors have pointed out that cherimoya softening during postharvest is related to the increase of the activities of PG, PME, endoglucanases and genes related to endotransglycosylases and expansins [29–31]. Therefore, the cell walls were degraded [32] more speed in Fino de Jete fruit compared, and no difference was observed between the firmness of the pulp of two cultivars in the comparison, after shelf-life (Table 2). Concerning colour parameters, the hue angle of peel and pulp was higher in Campas in comparison to the other cultivar, but the differences were not significant after storage. The Chroma was also significantly higher in peel (at harvest) and pulp (after storage) in the fruit of Campas in comparison to Fino De Jete.
About the parameters of the MI group, the pulp of the fruit of Fino de Jete was 45% harder than Campas before storage, but this difference both two cultivars disappeared at the end of shelf-life.
Titratable acidity (TA) also varied significantly among the cultivars (Table 2). It was 40% higher in the fruit of Campas in comparison to Fino de Jete. After storage, the TA increased by 44%
and 123% higher in the fruit of Campas and Fino de Jete, respectively, in comparison to immature fruit. The increase in acidity can be ascribed to the production of organic acids during ripening of cherimoya [33].
Finally, no differences between Campas and Fino the Jete were observed at the end of storage (Table 2).
In our experiment, Total Soluble Solids (TSS) ranged from 7.94 to 23.63 °Brix (Table 2). It was 32% higher in Campas fruit than in Fino de Jete, at the harvest time. From harvest to the end of shelf life, the increase of TSS was higher in the fruit of Fino de Jete than that Campas (Table 2). This increase is a consequence of starch degradation [32,34]. At the end of the shelf-life, the final TSS was significantly lower in Campas than in Fino de Jete. [35] reported that the increase of TA and TSS during shelf-life occurs around the first peak of CO2 respiration as a result of glycolysis induced
by the fruit detached from the tree [36]. The SST/TA ratio was 14% lower in Fino de Jete than Campas at harvest, whereas no significant difference was observed after storage (Table 2).
About the parameters of NU group (Total Polyphenols Content, Ascorbic Acid, and Total Antioxidant Capacity), their content in the fruit, decreased from the harvested time to the end of storage, for both cultivars. All NU values were significantly higher in Campas in comparison to Fino de Jete fruit at the harvested time, but the differences disappeared during shelf life (Table 2).
After, the MFA was carried to reach the second object of this research: evaluate, for each cultivar, when the fruit reaches the better quality in the long harvesting period of cherimo ya.
In the first phase of the MFA, a PCA was performed for each group of quantitative variables (PPCA). Furthermore, the variables were divided into five groups: Carpological (CR), colourimetric (CL), maturation index (MI), nutraceutical (NU), and Environmental (ENV).
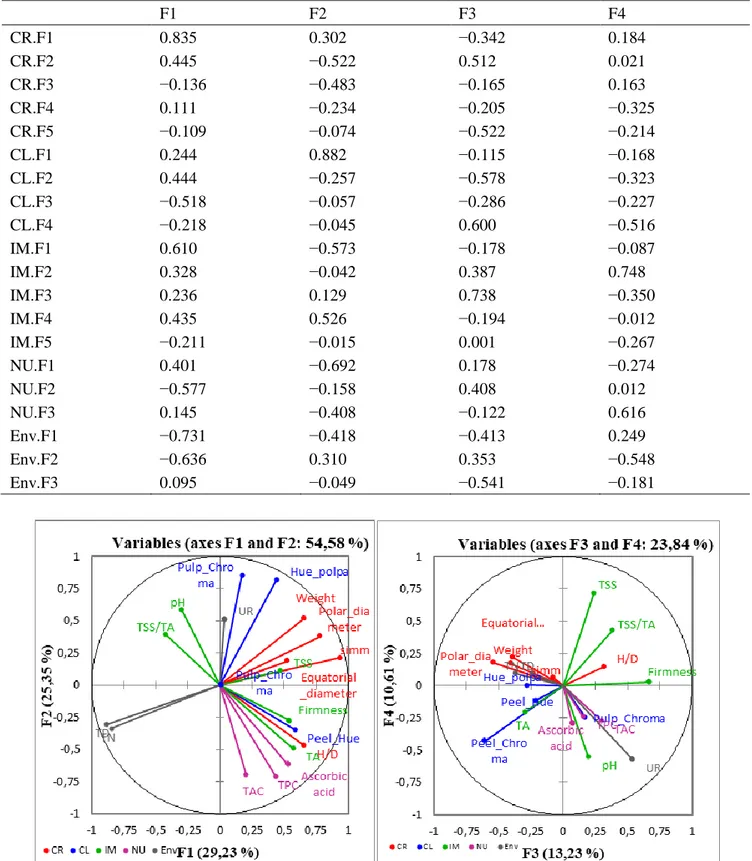
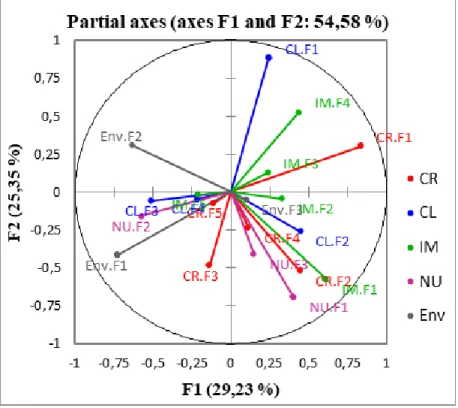
All variables of the MFA are projected in the plane of F1 and F2 (Figure 1a) and F3 and F4 (Figure 1b). In this way, we can analyse the relationships between variables and the formation of factors.
Factors F1 and F2 of the MFA accumulated 29.23% and 25.53% of the variance, respectively, (Figure 1a), whereas F3 and F4 factors represented 13.23% and 10.61% of the variability, respectively (Figure 1b). All four factors had totalled 78.42% of the initial variability.
In particular, all CR variables, one CL variable (Hue epicarp), one IM variable (TA), and two Env variables (TD, TM) participate in the formation of F1 factor. Whereas the other two CL variables (Hue pulp and Chroma pulp), one IM variable (PH), and all NU variables contributed to the formation of F2 factor. The last variable of IM group participates to the construction of F3, whereas the last variables of CL (Chroma epicarp), and Env (UR) to the formation of F4 factor (Table 3).
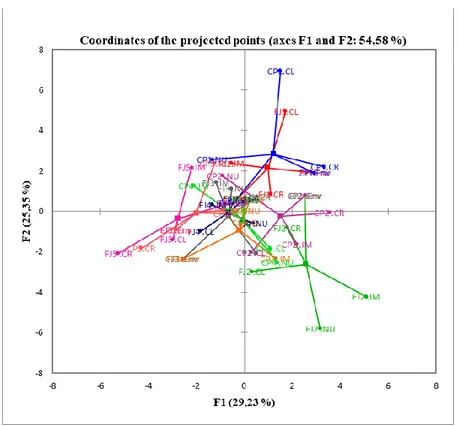
The results of the MFA can be explained by the positioning of the relative parameters concerning the centroid (Figure 2). The centroid represents the resulting coordinates of the MFA. The points connected to the centroid represent the coordinates of the projections formed by the PPCA (Figure 2). The closer these PPCA projections are to the centroid, the greater the affinity between the descriptions obtained from the PPCA and the MFA [28].
The squared cosines and contribution of the groups of variables of the PPCA in the formation of the MFA factors are reported in Tables 4 and 5. With regard to F1 and F2 Factors, the CR had the highest contribution to the formation of F1 (31.89%), followed by IM (20.64%), and ENV (27.10%), whereas CL (39.41%), and NU (23.11%) had the greatest contribution to the formation of F2 (Table 5; Figure 3).
The map of the partial axes (Figure 4), shows the relationship among the factors generated during PPCA and the MFA factors (Figure 4; Table 6).
Table 3. Correlations between variables and factors. Variable F1 F2 F3 F4 Weight 0.653 0.516 −0.388 0.219 Polar diameter 0.779 0.381 −0.405 0.171 Equatorial diameter 0.525 0.186 −0.538 0.177 H/D 0.654 −0.466 0.318 0.149 Simmetry 0.937 0.212 −0.075 0.063 Peel_Chroma 0.012 0.005 −0.609 −0.430 Peel_Hue 0.588 −0.347 −0.216 −0.115 Pulp_Chroma 0.171 0.855 0.169 −0.245 Pulp_Hue 0.439 0.819 −0.283 0.004 Firmness 0.541 −0.275 0.669 0.027 TSS 0.470 0.113 0.237 0.720 pH −0.301 0.585 0.194 −0.548 TA 0.571 −0.492 −0.296 −0.202 SST/TA −0.423 0.394 0.379 0.430 Ascorbic acid 0.531 −0.612 0.071 −0.291 TAC 0.202 −0.697 0.297 −0.272 TPC 0.434 −0.707 0.153 −0.238 UR 0.033 0.511 0.536 −0.572 TD −0.888 −0.305 −0.243 0.097 TN −0.847 −0.337 −0.368 0.096
Table 4. Cosine (Cos2) values of the groups for the formation of F1, F2, F3 and F4 of the MFA.
F1 F2 F3 F4 CR 0.842 0.062 0.062 0.002 CL 0.096 0.691 0.082 0.020 IM 0.300 0.167 0.145 0.266 NU 0.100 0.714 0.005 0.018 Env 0.794 0.077 0.081 0.042
Table 5. Contribution (%) of the groups for the formation of F1, F2, F3 and F4 of the MFA.
F1 F2 F3 F4 CR 31.89 9.97 19.18 4.52 CL 12.75 39.41 26.07 15.94 IM 20.64 17.77 31.72 53.57 NU 7.51 23.11 3.80 8.74 Env 27.21 9.74 19.23 17.23
Indeed, CR-F1, IM-F1, and ENV-F1 participated in the formation of F1, whereas CR-F2, CL-F2, and NU-1 contributed to the construction of F2 (Figure 4; Table 6). Finally, CL-F2 and IM-F2 participated in the construction of F3 and F4 factors, respectively (Figure 4; Table 6).
Table 6. Correlations (partial axes). F1 F2 F3 F4 CR.F1 0.835 0.302 −0.342 0.184 CR.F2 0.445 −0.522 0.512 0.021 CR.F3 −0.136 −0.483 −0.165 0.163 CR.F4 0.111 −0.234 −0.205 −0.325 CR.F5 −0.109 −0.074 −0.522 −0.214 CL.F1 0.244 0.882 −0.115 −0.168 CL.F2 0.444 −0.257 −0.578 −0.323 CL.F3 −0.518 −0.057 −0.286 −0.227 CL.F4 −0.218 −0.045 0.600 −0.516 IM.F1 0.610 −0.573 −0.178 −0.087 IM.F2 0.328 −0.042 0.387 0.748 IM.F3 0.236 0.129 0.738 −0.350 IM.F4 0.435 0.526 −0.194 −0.012 IM.F5 −0.211 −0.015 0.001 −0.267 NU.F1 0.401 −0.692 0.178 −0.274 NU.F2 −0.577 −0.158 0.408 0.012 NU.F3 0.145 −0.408 −0.122 0.616 Env.F1 −0.731 −0.418 −0.413 0.249 Env.F2 −0.636 0.310 0.353 −0.548 Env.F3 0.095 −0.049 −0.541 −0.181
Figure 1. Representation of the projections of the variables for the MFA in the F1/F2 (a)
Figure 2. Coordinates of the projected points of the groups of variables in the F1 and F2
axes of the MFA.
Figure 3. Projection of the groups of variables on the factorial plane formed by F1 and
Figure 4. Representation of the projections of the partial axes in the F1 and F2 axes.
CR-F1 is positively correlated both with CL-F2 that with IM-F1, and is negatively correlated with NU-F2 and ENV-F2 (min and max temperature during pollination). The CF-R2 is correlated with IM-F1 and IM-F3(Figure 4; Table 6).
There is a significant correlation between CL-F1 and IM-F4. Therefore, to an increase o f the Hue angle of the epicarp (CL-F1), corresponds an increase of the RSR (IM-F4) and a decrease of the nutraceutical parameters ascorbic acid, Polyphenol Content, Total Antioxidant Capacity (NU-F1) (Figure 4; Table 6).
IM-F1 is positively correlated with CR-F1 and CR-F2 and negatively correlated with ENV-F2 (Figure 4; Table 6).
Therefore, to an increase of the temperatures, maximum and minimum, during the period of the pollination (Env-F2) corresponds a reduction of the fresh weight, of the size, of the shape regularity and the ratio H/D of the fruit. The partial axis NU-F2 (CAT, TPC, AA) was also negatively correlated with IM-F4 (TSS). Finally, a negative correlation was found between IM-F1 (titratable acidity), NU-F2 (nutraceutical parameters) and temperature at the time of pollination (Table 5; Figure 4).
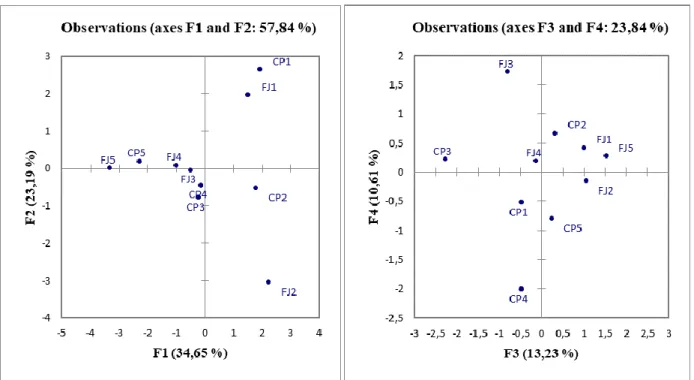
Analysing Figure 5, it is possible to observe how the fruits of the ‘Campas’ and ‘Fino De Jete’ cv, harvested in mid-October (CP1; FJ1), contribute, mainly, to the factor F2 (Table 7).
It is possible to see that centroids are placed in the upper quadrant, the fruits will be characterized by a higher Hue value of the epicarp, lower nutraceutical values, a higher °Brix; however, these parameters ranged in the quality standard for cherimoya. In the next harvested dates, the fruit becomes more irregular. The cause must be sought in the fact that for these fruits, pollination took place in thermal conditions less favourable to pollination with increasing of summer hot. Then, fewer ovules were fertilised [37].
Figure 5. Projection of the data post-harvest on the factorial plane formed by F1/F2 (a)
and F3/F4 (b) of the MFA.
Table 7. Contributions (%) of the observations.
Observation F1 F2 F3 F4 FJ1 1.4264 24.6519 10.6608 1.6947 CP1 3.5847 37.4664 4.0173 6.37 FJ2 20.9764 28.881 4.317 6.1572 CP2 9.3077 3.4193 5.3668 0.9351 FJ3 1.0722 0.3778 3.8035 20.2226 CP3 3.8025 0.0965 16.6973 12.9468 FJ4 3.4633 0.4797 1.474 22.9039 CP4 2.4528 2.7639 35.4191 3.239 FJ5 34.6039 0.3275 17.9023 1.2543 CP5 19.31 1.536 0.342 24.2763
The fruits of the Campas of the third and fourth harvest dates (CP3 and CP4) and those of the Fino De Jete of the third harvest date (FJ3) were almost close together, grouped around to the origin of the four axes.
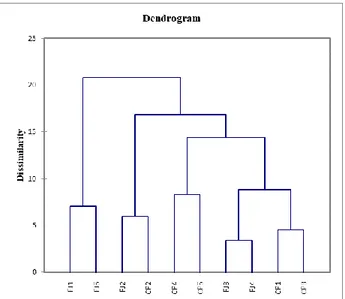
However, the fruits of the Campas to have a better size and nutraceutical parameters than those of the Fino de Jete. This last was smaller, more irregular and less rich in nutraceuticals (but with a tendency to increase the RSR), as confirmed by their coordinate. This situation becomes more accentuated in the last harvest date (Figures 5 and 6).
Figure 6. Cluster analysis: Dendrogram from agglomerative hierarchical clustering (AHC)
between two annona fruit cultivars and five harvest dates.
4. Conclusions
This experiment gives useful indications on the behaviour of this two cultivar of Annona cherimola, one of the impressa type (Fino de Jete) and one of the umbonate type (Campas), for a southern Italy environment. These results are very important for this environment where the traditional niche cultivation must be replaced by competitive industrial cultivation to meet an ever-increasing demand from the Annona market.
Overall, the fruits of the two cultivars, different morphological, showed very similar quality characteristics. Indeed, it has not been possible to find differences for quality parameters considering the average value of the fruit of the five samplings.
Therefore, this experiment has shown as the MFA is optimal to define the harvest time to which it corresponds the better quality of fruit.
In order to have fruits of regular shape and size, the harvest must be carried out within the third ten days of October, involving the pollinated fruits within the third week of June.
The fruit appears to be borderline about the size and her regular shape, from the first week of November. Successively, the fruit appears more irregular, smaller and with fewer seeds. This aspect is attributable to less favourable pollinated conditions. Between the two cultivars, Fino de Jete cultivar seems more sensitive to temperature increases during the pollination period than the Campas cultivar.
The fruit of the second harvesting period is more acidic and less sweet, and, therefore, organoleptic more pleasant, than those of the first harvesting period (second week of October). Furthermore, it has the highest nutraceutical properties. Therefore, it can be confirmed that the fruits that can reconcile well the carpological, organoleptic and nutraceutical aspects are those harvested during the third decade of October, for both cultivars.
Conflict of interest
References
1. Cautìn R, Agustì M (2005) Phenological growth stages of the cherimoya tree (Annona
cherimola Mill.). Sci Hortic 105: 491–497.
2. Bonavia D, Ochoa C, Tovar O, et al. (2004) Archaeological evidence of cherimoya (Annona
cherimola Mill.) and guanabana (Annona muricata L.) in ancient Perù. Econ Bot 58: 509–522.
3. Popenoe W (1920) Manual of tropical and subtropical fruits. The Macmillan Company, New York. 4. Ciferri R (1955) Sulle pretese raffigurazioni di ananas, mango ed annona, in pitture pompeiane.
Rivista di ortoflorofrutticoltura italiana 39: 489–502.
5. Morettini A (1963) Frutticoltura generale e speciale. R.E.D.A., Roma.
6. Loizzo MR, Di Lecce G, Boselli E, et al. (2012) Radical scavenging, total antioxidant capacity, and antiproliferative activity of phenolic extracts from extra virgin olive oil by cultivar ‘Frantoio’. Int J Food Prop 15: 1345–1357.
7. Monastra F (1997) Current Status of Annonaceae in Italy. Mesfin Newsletter 3: 11–12.
8. Calabrese F (1990) Incontro di studi sull’annona “Annona cherimola (Mill)”. Edizione Laruffa, 31–42.
9. Caleca V, La Verde G, Ragusa S, et al. (2002) Insect and hand pollination of Annona spp. in Sicily. Phytophaga XII: 117–127.
10. Gazit S, Galon I, Podoler H (1982) The role of nitidulid beetles in natural pollination of Annona in Israel. J Am Soc Hortic Sci 107: 849–852.
11. Gottsberger G (1989) Comments on flower evolution and beetle pollination in the genera Annona and Rollinia. Plant Syst Evol 167: 189–194.
12. Lora J, Herrero M, Hormaza JI (2012) Pollen performance, cell number, and physiological state in the early-divergent angiosperm Annona cherimola Mill. (Annonaceae) are related to environmental conditions during the final stages of pollen development. Sex Plant Reprod 25:157–167.
13. Pal DK, Kumar PS (1995) Changes in the physicochemical and biochemical composition of custard apple (Annona squamosa L.) fruits during growth, development, and ripening. J Hortic
Sci 70: 569–572.
14. Pinto ACQ, Cordeiro MCR, de Andrade SRM, et al. (1994) Changes in sugar and organic acids in cherimoya (Annona cherimola Mill.) fruit under controlled-atmosphere storage. J Agric Food
Chem 42: 799–803.
15. Jyothi A, Venkatesh K, Chakrapani P, et al. (2011) Phytochemical and pharmacological potential of Annona cherimola—A review. Int J Phytomed 3: 439–447.
16. Pinillos V, Peinado S, González M (2013) Fruit development and maturation phenology of ‘Fino de Jete’ cherimoya. Acta Hortic 975: 335–342.
17. Torres WE, Sanchez LA (1992) Fruticultura Colombiana, Guanabano. (Spanish). ICA, Manual de Asistencia 57. Instituto Colombiano Agropecuario, Bogota.
18. Prasanna V, Prabba TN, Tharanathan RN (2007) Fruit ripening phenomena—An overview,
Critical Rev Food Sci Nutr 47: 1–19.
19. Biale JB, Young RE, Olmstead AJ (1954) Fruit respiration and ethylene production. Plant
Physiol 29: 168–174.
20. Brown BI, Wong LS, George AP, et al. (1988) Comparative studies on the postharvest physiology of fruit from different species of Annona (custard apple). J Hortic Sci 63: 521–528. 21. Vanhove W, Van Damme P (2013) Value chains of cherimoya (Annona cherimola Mill.) in a
22. Andrés-Agustín J, González-Andrés F, Nieto-Ángel R, et al. (2006) Morphometry of the organs of cherimoya (Annona cherimola Mill.) and analysis of fruit parameters for the characterization of cultivars, and Mexican germplasm selections. Sci Hort 107: 337–346.
23. Zalom FG, Goodell PB, Wilson LT, et al. (1983) Degree-Days: The calculation and use of heat units in pest management. University of California, Division of Agriculture and Natural Resources, Leaflet, 10: 21373.
24. Stanley DW, Baker KW (2002) A simple laboratory exercise in food structure/texture relationships using a flatbed scanner. J Food Sci Educ 1: 6–9.
25. George AP, Nissen RJ, Ko HL (1986) Productivity of custard apple (Annona atemoya Hort.). Factors affecting yield and fruit size. Acta Hortic 175: 37–41.
26. McGuire RG (1992) Reporting of objective colour measurements. HortScience 27: 1254–1255. 27. Richardson AC, Anderson PA (1996) Hand pollination effects on the set and development of
cherimoya (Annona cherimola) fruit in a humid climate. Sci Hortic 65: 273–281.
28. Pagès J (2005) Collection and analysis of perceived product inter-distances using multiple factor analysis: Application to the study of 10 white wines from the Loire Valley. Food Qual
Prefer 16: 642–649.
29. Escribano MI, Del Cura B, Muñoz T, et al. (1997) The effect of high carbon dioxide at low temperature on ribulose 1,5-biphosphate carboxylase and polygalacturonase protein levels in cherimoya fruit. J Am Soc Hortic Sci 122: 258–262.
30. Sanchez JA, Zamorano JP, Alique R (1998) Polygalacturonase, cellulose and invertase activities during cherimoya fruit ripening. J Hortic Sci 73: 87–92.
31. Li C, Shen W, Lu W, et al. (2009) 1-MCP delayed softening and affected expression of XET and EXP genes in harvested cherimoya fruit. Postharvest Biol Technol 52: 254–259.
32. Gutierrez M, Sola MM, Pascual L, et al. (1992) Ultrastructural changes in cherimoya fruit injured by chilling. Food Struct 11: 323–332.
33. Gutierrez M, Lahoz JM, Sola MM, et al. (1994) Postharvest changes in total soluble solids and tissue pH of cherimoya fruit stored at chilling and non-chilling temperatures. J Ortic Sci 69: 459–463.
34. Lahoz JM, Gutierrez M, Sola MM (1993) Ethylene in cherimoya fruit (Annona cherimola Mill.) under different storage conditions. J Agr Food Chem 41: 721–723.
35. Manrìquez DA, Munoz-Robredo P, Gudenschwager O, et al. (2014) Development of flavor-related metabolites in cherimoya (Annona cherimola Mill.) fruit and their relationship with ripening physiology. Postharvest Biol Technol 94: 58–65.
36. Bruinsma J, Paull RE (1984) Respiration during postharvest development of soursop fruit,
Annona muricata L. Plant Physiol 76: 131–138.
37. Gullo G, Dattola A, Sortino G, et al. (2019) Effect of fruit-set time on the quality performance of Annona cherimola mill. fruit in south Italy. Sci Hortic 246: 272–278.
© 2019 the Author(s), licensee AIMS Press. This is an open access article distributed under the terms of the Creative Commons Attribution License (http://creativecommons.org/licenses/by/4.0)