ContentslistsavailableatScienceDirect
NeuroImage
journalhomepage:www.elsevier.com/locate/neuroimage
Review
Multi-dimensional
connectivity:
a
conceptual
and
mathematical
review
Alessio Basti
a,b,1, Hamed Nili
c,1,∗, Olaf Hauk
d, Laura Marzetti
a,b, Richard N. Henson
d,e a Department of Neuroscience, Imaging and Clinical Sciences, University of Chieti-Pescara, Italyb Institute for Advanced Biomedical Technologies, University of Chieti-Pescara, Italy c Wellcome Centre for Integrative Neuroimaging, University of Oxford, United Kingdom
d Medical Research Council Cognition and Brain Sciences Unit, University of Cambridge, United Kingdom e Department of Psychiatry, University of Cambridge, United Kingdom
a
b
s
t
r
a
c
t
Theestimationoffunctionalconnectivitybetweenregionsofthebrain,forexamplebasedonstatisticaldependenciesbetweenthetimeseriesofactivityineach region,hasbecomeincreasinglyimportantinneuroimaging.Typically,multipletimeseries(e.g.fromeachvoxelinfMRIdata)arefirstreducedtoasingletimeseries thatsummarisestheactivityinaregionofinterest,e.g.byaveragingacrossvoxelsorbytakingthefirstprincipalcomponent;anapproachwecallone-dimensional connectivity.However,thissummaryapproachignorespotentialmulti-dimensionalconnectivitybetweentworegions,andanumberofrecentmethodshavebeen proposedtocapturesuchcomplexdependencies.Herewereviewthemostcommonmulti-dimensionalconnectivitymethods,fromanintuitiveperspective,froma formal(mathematical)pointofview,andthroughanumberofsimulatedandreal(fMRIandMEG)dataexamplesthatillustratethestrengthsandweaknessesof eachmethod.Thepaperisaccompaniedwithbothfunctionsandscripts,whichimplementeachmethodandreproducealltheexamples.
1. Introduction
Neuroimagingresearchhasdemonstratedthatthecharacterisation offunctionalinteractionsamongregionsofthebrainisvitalforadeeper comprehensionofthebrain’sfunctioning.Indeed,somehaveclaimed thatcognitivefunctionsaremorecloselyrelatedtothesynergic coop-erationamongbrainregionsthantoresponsesinindividualbrain re-gions(BresslerandMenon2010).Functionalconnectivityisnormally inferredby analysing thestatistical dependencybetween timeseries (e.g. fMRI, EEG or MEG signals) associated with regions of interest (ROIs).Therearemany differentmethods forestimatingthis depen-dency(e.g.Hippetal.,2012;BresslerandSeth,2011;VanDenHeuvel et al. 2010; Stam et al., 2007; Nolte et al., 2004; Lachaux et al., 1999;Biswaletal.,1995).However,oneaspectisignoredinmostof thesemethods:thefactROIsaretypicallycomposedofmultiple vox-elswhoseassociatedtimeseriescontainimportantinformationabout thecomplex dependenciesamongtheregions themselves. Aconcern isthatthisinformationispotentiallylostwhenreducingtheoriginal multi-dimensionaldatatoarepresentativeone-dimensionaltimeseries (Bastietal.,2018).Thisconcernhasledtothedevelopmentof vari-ous“multi-dimensionalconnectivity” methods.Notethatthesemethods havealsobeencalled“multivariateconnectivity” (e.g.Anzellottiand Coutanche2018;Geerligsetal.,2016),butthelattertermmayalsorefer totheestimationofmultiple(one-dimensional)connectionsbetweenall pairsofROIswithinanetwork,e.g.exploitingmultivariate autoregres-sivemodelling(BaccalaandSameshima,2001;Harrisonetal.,2003);so
∗ Correspondingauthor.
E-mail address: [email protected](H.Nili).
1 Jointfirstandcorrespondingauthors
toavoidconfusion,weuse“multi-dimensionalconnectivity” hereto re-fertotheestimationofasingle,pairwiseconnectionbetweentwoROIs, butwherethoseROIsconsistofmultiplemeasurements(e.g.voxels).
WhileAnzellottiandCoutanche(2018) provided aninformal and historical reviewof variousmulti-dimensionalconnectivity methods, ourapproachhereismorepedagogical,inproviding1)sometoy(2D) examplesthathelpinillustratingsomeofthemainconcepts,suchas mappingfromvoxel-spacetopattern-distancespace,2)aformal(i.e. mathematical)definitionofthemainmethods,3)anumberof simula-tionsthatillustratethestrengthsandweaknessesofeach method,4) empiricalexamples(onbothfMRIandMEGdata)and5)atraditional summarywith“tenrules” forconductingmulti-dimensional connectiv-ityanalysis.AlloftheexamplesareaccompaniedbyMATLABfunctions, includingimplementationofeachmetricused,whichareavailablehere: https://github.com/RikHenson/MultivarCon/.
2. Simple2Dillustration
Thepurposeofthissectionistoprovideanintuitiveunderstanding ofsomeofthemethodsandconcepts,beforetheirformaldescription inthenextsection.TheMATLABscriptthatcanbeusedtoreproduce theseresultsisExample2D.m.
ConsiderasimplecasewithtwoROIswith𝑁𝑋=𝑁𝑌 =2voxelsand
𝑁𝑡=4timepoints.Fig.1A–CshowsthedataplottedforeachROI,where
eachaxis(x,y)representsonevoxel,andthefourtimepointsare num-bered.InFig.1A,thedominantvariance(betweenpoints1or2and3or 4)inbothROIsisalongthedirection𝑦=𝑥.Sinceaveragingacrossthe twovoxelsisequivalenttoprojectingontotheline𝑦=𝑥,simple
averag-https://doi.org/10.1016/j.neuroimage.2020.117179
Received6February2020;Receivedinrevisedform13July2020;Accepted14July2020 Availableonline17July2020
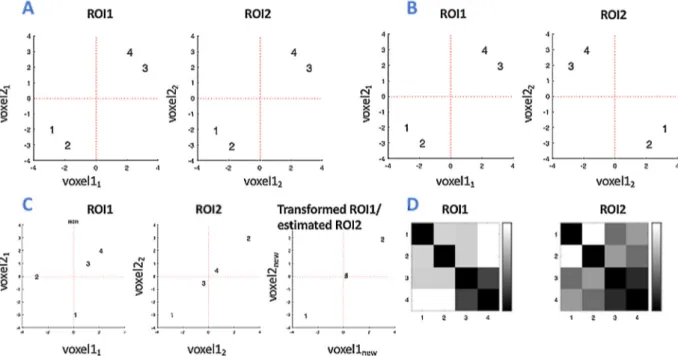
Fig.1. Toyexamplewith2voxelsineachof2ROIs,witheachvoxelprovidingdatafor4timepoints.PanelsA-Cshowthreedifferentpatternsof(actualand transformed)data,whilePanelDshowsthesimilarityacrossvoxelsbetweeneverypairoftimepointsinpanelC(aso-called“RDM”;seeSection2.1.4).InPanelA thedominantvariancebetweenpoints1or2and3or4inbothROIsisalong𝑦 =𝑥 ,whileinPanelBthedominantdirectioninROI2isorthogonaltothatinthefirst ROI.Unlikeintheprevioustwopanels,inPanelCthereisaconsiderablevariancealongmorethanonedirection,causingtheone-dimensionalconnectivitymethods toperformworsethanmulti-dimensionalconnectivityones.
ingwithineachROIfollowedbycorrelationacrossROIsrevealsa Pear-son’scorrelationcoefficientof𝑅=1.Thus,thisisasituationwherethe currently-dominantapproachofone-dimensionalconnectivity,basedon themeanROIresponse,workswell.Bycontrast,considerthecasein Fig.1B,wherethedatainROI2arereflectedacrossthey-axiswith re-specttothoseinROI1,i.e.thedominantdirectionofvarianceinROI2 isnoworthogonaltothatinROI1.Whenthedataareaveragedacross voxels,theprojectionofthedatainROI2ontotheline𝑦=𝑥produces adifferentorderoftimepointvaluesthanwhenthesameprojectionis doneinROI1,suchthattheresultingPearsoncorrelationis𝑅=0.
OnecommonsolutiontothisproblemistosummarisetheROI’stime seriesbytheirfirsttemporalmode(or“eigenvector”),ratherthantheir average.Thetemporalmodecanbecalculatedusingasingular-value decomposition(SVD)oftheROI’smatrixofvoxels-by-timepoints(SVD isalsothebasisofprincipalcomponentanalysis).ASVDisdefined for-mallyinthenextsection,butitbasicallyprovidesthedirection(invoxel space)thatcapturesthedominantvarianceinthedata,andthe tempo-ralmodeistheprojectionofthedataontothatdirection.Inthecurrent example,thedataareprojectedonto𝑦=𝑥forROI1(i.e.thefirst tem-poralmodeisidenticaltotheaverageforthisROI),butforROI2,the dataareprojectedonto𝑦=−𝑥instead.Now,therelativeorderingof timepointsonthesetwoprincipalaxesthenbecomesthesame,sothe Pearsoncorrelationisnow𝑅=1again(ifthedirectionoftheprincipal axisistowardstheupperleft2).
Fig.1Cshowsthemostimportantcasewherenoone-dimensional connectivity method works, and a multi-dimensional connectivity methodisneeded.Thisisbecausereducingthedatatoonedimension (evenusingSVD)doesnotcaptureimportantdependenciesbetweenthe twoROIs.Inparticular,thefirstprincipaldirectionforROI1isagain alongtheline𝑦=𝑥, eventhough thereisalsoconsiderablevariance
2 ThesignofthesingularvectorsfollowingSVDissomewhatarbitrary,so canbeflippedtoproducecorrelationsofeitherR =1or R =−1.Thus,theSVD approachnormallymeansonedoesnotcareaboutthesignoftheconnectivity; justitsmagnitude.
alongtheorthogonaldirection𝑦=−𝑥(betweenpoints1and2).This meansthat,whenprojectingbothROIsonto𝑦=𝑥,theorderofthefour timepointsdoesnotmatch,suchthatthePearsoncorrelationfollowing SVDis𝑅=0.04.However,ifyoulookmoreclosely,youcanstillsee somedependencybetweentheROIsintermsoftheEuclideandistances (dissimilarities)betweenpairsoftimepoints.Forexample,points1and 2arefarapartinbothROIs,whereaspoints3and4areclosetogether. Thisbecomesapparentwhenyoucalculatethedistance(invoxel-space) betweenallpairsoftimepointstoproducethe4×4“representational dissimilaritymatrices” (RDMs)showninFig.1D.Althoughnotidentical, these(symmetric)matricessharepropertieslikesmall(dark)values be-tweentimepoints3and4,andrelativelylarger(lighter)valuesbetween timepoints1and2.ThismeansthatwhenyoucalculatethePearson correlationbetweenthesematrices(orjusttheirupperrighttriangular elements),thecoefficientisreasonablyhigh,𝑅=0.48.Thisprojection fromvoxelspaceto“pattern-distancespace” (asexpandedinthenext Section)isessentiallythewaythatmanymulti-dimensionalconnectivity methodswork,suchthatthecorrelationinpatternspacecanbehigher thanintheoriginalvoxelspace.Inotherwords,eventhoughthe pat-ternsacrossvoxelsforeachtimepointcandifferdramaticallybetween ROIs,thesimilaritiesbetweenthosepatternscanbesimilaracrossROIs. Finally,thewaythatotherconnectivitymeasuresidentifythe multi-dimensionalstatisticaldependencyinFig.1Cisbyexplicitlyestimating the(linear)transformationofthetwoaxesthatmaximisesthe depen-dencybetweenthetwoROIs,e.g.byconsideringbothdirections𝑦=𝑥 and𝑦=−𝑥inROI1,inordertomapthefourpointsascloselyas possi-bleontothesamefourpointsonthe(dominantaxis)of𝑦=𝑥inROI2. Withthisbasicintroductioninmind,wenowintroducethemain MD-connectivitymeasuresmoreformally.
3. Formalisationofone-andmulti-dimensionalconnectivity methods
Inthis section,wedescribearangeof one-dimensional (1D)and multi-dimensional(MD)connectivitymethods,usingbothtime-domain andfrequency-domainmeasures.Forthetime-domain,westartwiththe
Fig.2. EstimatingMD-connectivityviarelationshipsbetweenvoxelpatternsacrosstimepoints(A)oracrossruns/trial(B).PanelAalsoillustratesexplicitestimation ofthemulti-dimensionalmappingbetweenROIsX andY bytrainingononesetofrunsandtestingonanother(cross-validation),whilePanelBillustratesanalternative ofcorrelatingpatternsimilaritykernels(e.g.representationaldissimilaritymatrices,RDMs;seetext).Thesuperscriptsandsubscriptsforeachtimeseriesdenote runs/trialsandvoxels,respectively.
two1D-connectivitymethodsdescribedintheprevioussection,namely atemporalcorrelationbetweenthesingletimeseriesresultingafter ei-thertakingtheaverageorfirsttemporalmodeacrossvoxels.Wethen considerfivedifferent,time-domainMD-connectivitymethods: “canon-icalcorrelation” (Hotelling1936),“multivariatepattern dependence” (Anzellottietal.,2017b),“distancecorrelation” (Geerligsetal.2016), “representationalconnectivityanalysis” (Kriegeskorteetal.,2008)and “linearlypredictedrepresentationaldissimilarity” (Bastietal.,2019). These represent the prototypical cases of all themajor methods, of whichweareaware,that havebeenproposedandcurrentlyusedin fMRI.Forthefrequency-domain,wefocusonphase-couplingmethods. Inparticular,wedefinetwo1D phase-couplingmethods, i.e. “imagi-narycoherency” (Nolteetal.,2004)and“laggedcoherence” ( Pascual-Marqui,2007a),andtheirMD-generalisationstermed“multivariate in-teractionmeasure” (Ewaldetal.,2012)and“multivariatelagged coher-ence” (Pascual-Marqui,2007b).ThesearethemainMDphase-coupling methodsofwhichweareaware.Nonethelessitwouldalsobepossibleto consideramplitude-basedmethodsorinformation-theoreticapproaches thatdonotdisentanglebetweenphase-andpureamplitudecoupling (Barrettetal.,2010).
AsshowninFig.2,letthetwoROIsbecalledXandY,associated withtwomultipletimeseriescomposedofNXandNYspatially-distinct signals,respectively.ThesignalswithineachROImightcorrespond,for example,tovoxelsinanfMRIexperiment,orsource-reconstructed cor-ticalverticesinaMEGexperiment,ordiscreteelectrodesinan extracra-nialorintracranialEEGexperiment;thoughwecallthem“voxels” be-lowforsimplicity.Thetimepointsmightbereal-timesamples,orthey couldalsobeestimatesofevent-relatedresponsestosuccessivetrials inanfMRIexperiment,orthesamepre-stimulustimeacrosssuccessive trialsinanMEG/EEGexperiment(later,wedistinguishbetween
anal-ysesbasedon continuoustimeseriesversusthosebased onmultiple trials,butforsimplicity,weusetheterm“timepoints” below).Thus, themultipletimeseriesassociatedwithXandYcanberepresentedas twomatriceswhoserowsandcolumnsdenotetimepointsandvoxels, respectively.Below,werefertothevectorofvaluesovervoxels(ata singletimepoint)asapattern.Thepresenceofmultiplerunsis impor-tantforsomeoftheMD-connectivitymetricsbelow,inwhichpatterns inonerunareusedtopredictthoseinanotherrun.
3.1. Time-domainmethods
Westartwiththecaseofasingletimeseriesforeachvoxel,asin Fig.2A.
3.1.1. Pearsoncorrelationbetweentwosingletimeseries
Toreducethemultipletimeseriesacrossvoxelstoasingletime se-ries, thesimplest summaryis totake themeanacrossvoxels. Thisis themostcommonapproachinthefMRIconnectivityliterature,andit assumesfunctionalhomogeneitywithineachROI.Ifthisassumptionis true,theaveragingenhancesthesignal-to-noiseratio(SNR).
Analternativeistoperformasingularvaluedecomposition(SVD3) of the matricesXandY, anduse thefirst singularvector along the time dimension(first temporalmode)as a summary timeseriesfor each ROI (as is default for example in the SPM software package, www.fil.ion.ucl.ac.uk/spm;seeFristonetal.,2006).ASVDofthe ma-3 Inprinciple,SVDisawayofprovidinganalternative(orthogonalised) rep-resentationofthedata,butinfunctionalconnectivityitisusuallyappliedfor thepurposeofdimensionalityreduction.
trix Xis defined as: 𝑠𝑣𝑑(𝑋)=𝑈𝑆𝑉′,where, inthis case,Uis a ma-trixwhosecolumnsaretimeseries(temporalmodes)andVisamatrix whosecolumnsareweightsacrossvoxels(spatialmodes).Thematrix
Sisadiagonalmatrixof“singularvalues”,inwhichthesquareofthe diagonalelementsrelatestohowmuchvarianceisexplainedbyeach pairoftemporalandspatialmodes,orderedfrommosttoleast.Thus, thenormalisedvalueofthefirstsingularvalue(normalisedbythesum ofallsingularvalues)indicatestheportionofvariancecapturedbythe firsttemporalandspatialmodes,i.e.how“successful” thedimension reductionhasbeen.(PrincipalComponentAnalysis,PCA,issimplythe SVDofthecovariancematrixX′X.)Intheexamplecodeprovided,SVD isimplementedinthefunctiondimreduction.m.
IftheROIsarefunctionallyhomogeneous(i.e.containidentical sig-naltimeseriesforeachvoxel,plusnoisethatisindependentacross vox-els),thenthefirstspatialmodeshouldgiveequalweighttoeachvoxel, suchthatthefirsttemporalmodeisequivalenttothemeanacross vox-els.However,theadvantageofSVDarisesiftheROIsarenot function-allyhomogeneous(asdemonstratedinSection2,wherethespatialmode cangivedifferentweights(evendifferentsigns)tovoxels,andthusthe firsttemporalmodecanbeverydifferentfromthemeantimeseries. Ofcourse,onecoulduseSVDtodefineROIsinthefirstplace,i.e.select contiguousvoxelssuchthattheydohaveacommontimeseries(i.e.high normalisedfirstsingularvalue).WhileSVDmightbeappropriate(for di-rectlydefiningor)incaseofROIsdefinedthroughfunctional/adaptive approaches(seee.g.Farahibozorgetal.,2018 foradaptiveapproaches inMEG),itmaynotbeappropriateifROIsaredefinedapriori(e.g.based onstandardanatomicalparcellations).Moreover,thisSVDapproachis particularlyvaluablewithsigneddatalikeinEEG/MEG,wherethesign ofthedatadependsonthesensororsourceorientation,whichisoften notofinterest,andsuchthatstraightaveragingcanproducevaluesclose tozero.
WhicheverwaythedimensionalityoftheROIdataisreducedtoone dimension,withtimeseriesrepresentedbythevectors̄𝑥and̄𝑦,the sim-plestmeasureofconnectivityisthePearsoncorrelation:
𝑅=corr(̄𝑥,̄𝑦)= cov(̄𝑥,̄𝑦)
σ̄𝑥σ̄𝑦 , (1)
wherecovand𝜎 denotethecovarianceandthestandarddeviation, re-spectively(nonparametricmeasuresalsoexist,suchtheSpearmanrank correlation).
Anothermethodthatcanbeexploitedinordertoselectthe direc-tionin thetwoROIsalongwhichtoevaluatethePearsoncorrelation is”canonicalcorrelationanalysis” (CCA,Hotelling1936).Evenifthis methodappliesadimensionalityreduction,itcanbestillconsideredas aMD-connectivitymethod.Indeed,ratherthanaveragingacross vox-elsortoapplyingawithin-ROISVD,CCAfindsthetwo,singletime series(termed“canonicalvariates”), ̄𝑥and ̄𝑦,thathavethemaximal 1DPearsoncorrelation(even ifthose timeseriesdo notcapturethe majorityofvariancewithineachROI).Thatis,CCAevaluates ̄𝑥=𝑋𝑢 and̄𝑦=𝑌𝑣,wherethetwodirections(termed“canonicalvectors”)are (𝑢,𝑣) =argmax(̃𝑢,̃𝑣){corr(𝑋̃𝑢,𝑌̃𝑣)}.ThiscanbeachievedbytakingaSVD ofthecovariancematrixbetweenXandY(Uurtioetal.,2017).Here weusethecorrelationvaluebetweenthefirstpairofcanonical vari-ablesasameasureofthelinearstatisticaldependencybetweenXandY, butitisworthnotingthatotherpairsofcanonicalvariables(whichare allorthogonal)couldalsobeselectedandconsidered(seeWangetal., 2020forabroaderapplicationofCCAinneuroscience).
Bycontrast,alltheother(MD)connectivitymethodsbelowaimto reduceanydimension-reductionofthedata,thusminimisingthelossof potentialinformation.
3.1.2. Multivariatepatterndependence
Multivariate pattern dependence (MVPD), as proposed by
Anzellotti et al. (2017b), estimates the statistical dependency be-tweenthetwomatricesof timeseries,e.g.howwell thetimeseries in Y can be predicted using X. Forlinear dependence, the simplest
waytodothis istouseordinary leastsquares (OLS)estimation,i.e. multi-dimensional regression, estimating (training) the regression weightsfromonesetofrunsandtestingtheseweightsontheremaining setofruns(i.e.cross-validation).
SinceOLSestimationentailsmatrixinversion,theproductX′Xneeds tobeinvertible,onerequirementforwhichisthatXhasfewer (indepen-dent)columnsthanrows,i.e.inthiscase,fewervoxelsthantimepoints. Ifthisisnotthecase,onecanperformaSVDandretainonlythefirstp
modes,wherepislessthanorequaltothenumberoftimepoints(and hopefullywherethepmodescapturethemajorityofvarianceinXand
Y).
Forleave-one-run-outcross-validation,thefirststep isto concate-natethemultipletimeseriesacrossalltherunsexceptone.Forthesake ofsimplicity,assumewehaveonlytworuns,andusethefirstfor train-ingandsecondfortesting.IfaSVDisappliedto𝑋r=1and𝑌r=1(the superscript“r=1″denotesthefirstrun),thenassumethe dimension-alityoftheROIsis reducedfromNXtoKX (andfromNYtoKY).The
transformationmatrixTbetween𝑋r=1and𝑌r=1 (orbetweentheir di-mensionalityreducedversion)isthenestimatedviaOLS,i.e.by solv-ingtheminimizationproblem𝑇=argmin𝐵{||Xr=1B−Yr=1||2
𝐹},where
‖ · ‖FdenotestheFrobeniusnorm,definedasthesquare-rootofthesum ofallthesquaredentriesofthematrix.Forthisminimizationproblem (ifitiswelldefined)thereisauniquesolutionthatcanbewrittenas
𝑇=(𝑌r=1)′𝑋r=1((𝑋r=1)′𝑋r=1)−1,where(⋅)−1denotestheinverse opera-tion.TheideabehindMVPDistoapplythetransformationTinorderto estimatethemultipletimeseries𝑌r=2=(𝑦r=2
1 ,…,𝑦 r=2
𝐾𝑌 )associatedwith theleft-outrunvia ̂𝑌r=2=𝑋r=2𝑇.MVPDisthendefinedasthe weighted-averageacrossvoxelsandrunsofthecorrelationcoefficientbetweenthe actualsingletimeseries𝑦r=2
𝑖 andtheestimatedone, ̂𝑦r=2𝑖 ,i.e.
⎧ ⎪ ⎪ ⎨ ⎪ ⎪ ⎩ MVPD=1 2 ∑ 𝑖,𝑗corr ( 𝑦𝑟=𝑗 𝑖 ,̂𝑦𝑟𝑖=𝑗 ) 𝑤𝑟=𝑗 𝑖 𝑤𝑟=𝑗 𝑖 = ( σ𝑦 𝑟 = 𝑗 𝑖 )2 ∑ 𝑘 ( σ 𝑦 𝑟 𝑘 = 𝑗 )2 (2) Theweights𝑤𝑟=𝑗
𝑖 aregivenbytheportionoftheoverallvariance
explainedbythei-thsingletimeseries.OneadvantageofMVPDisthat thetransformationbetweenROIsisexplicitlyrepresentedaspartof es-timatingconnectivity.Whilealineartransformationhasbeenassumed above,adifferentestimator(ornonlinearprojectionoftheROIdata) couldbeusedtoestimatenonlineartransformations(Anzellottietal., 2017a).
Moregenerally,onedoesnotneedtoperformdimensionality reduc-tionofeachROIfirstinordertoapplyOLS,butinsteadusearegularised solutiontotheaboveminimizationproblem,suchasridgeregression4 forexample(seetheLinearlyPredictedRepresentationalDissimilarity methodbelow,Bastietal.,2019).Thishasthepotentialadvantageof detectingtemporalcomponentsthatcovarystronglybetweenXandY, eveniftheyonlyexplainasmallpercentageofvariancewithinXandY separately(andthereforemightberemovedbythepriordimensionality reduction).BothSVDandregularisedapproachesareimplementedin theassociatedfunctiondata2mvpd_lprd_fc.m.
3.1.3. Distancecorrelation
DistanceCorrelation,dCor(Székelyetal.,2007;Geerligsetal.2016), isaMD-connectivitymethodthatmeasuresbothlinearandnon-linear dependenciesbetweenROIs.Conceptually,ifeachtimepointisviewed asapointintheNX-andNY-dimensionalvoxelspaces,dCorwillindicate
4 OLSandridgeregressionarejusttwoofmanylinearmethodstocapturea statisticaldependencybetweentwomatrices,e.g.voxel-by-timepointmatrices inthecaseofMD-connectivity.Otherclassicalapproachesarecanonical cor-relationanalysis(CCA),partialleastsquares(PLS)andleastabsoluteshrinkage andselectionoperators(Kherifetal.2002,Tibshirani1996);however,theseare beyondthepresentremit.
highconnectivitywhenalargedistancebetweentwotimepointswithin onespace(ROI)ismirroredbyalargedistancebetweenthesametime pointsintheotherspace(ROI),andconverselywhensmalldistancesin onespacearemirroredbysmalldistancesintheother(asinFig.1D).
The first step is to compute the Euclidean distances between each pair of time points s and t in voxel-space, for each ROI, i.e.
𝐴𝑋(𝑡,𝑠)=||𝑋(𝑡)−𝑋(𝑠)||2 and𝐵𝑋(𝑡,𝑠)=||𝑌(𝑡)−𝑌(𝑠)||2.Second,a cor-rection,calledU-centring,isappliedtothetime-by-timedistance matri-cesAXandBYinordertoensurethatthecorrelationestimatesarenot
biasedbythedifferentdimensionsofthetwoROIs.Finally,thedistance correlationisdefinedas:
dCor= √
max{corr(𝐴𝑋,𝐵𝑌),0} (3)
wherecorr(AX,BY)iscomputedbetweenthevectorisedU-centred
ma-tricesAXandBY;thetermmax{corr(AX,BY),0}includedintheabove
equationensurespositiveestimates.Thisisimplementedinthefunction
data2dcor.m.
3.1.4. Representationalconnectivityanalysis(RCA)
U-centringaside,dCorcanbeseenasaspecialcaseof representa-tionalconnectivityanalysis(RCA,Kriegeskorteetal.,2008).InRCA,a (dis)similaritymetricisestimatedbetweeneverypairofpatterns(i.e. betweeneverypairoftimepoints/trials),andthendissimilarityvalues forallpairwisecomparisonsarecomparedacrossROIs.Thisresembles the“kernelmethod” (TheodoridisandKoutroumbas,1999)in machine-learning,inwhichtheoriginal(voxel)dataaretransformedintoa fea-ture(pattern)spaceviaadissimilarityfunction(kernel).Indeed,dCor isaspecialcaseofRCAwhenthedissimilaritymeasureisEuclidean dis-tance.However,othermeasuresofdissimilarityarealsopossible,such as1minusthePearsoncorrelation(whichiswhatweusehere),ormore generally,theMahalanobisdistance(Mahalanobis1936).
Thetimepointbytimepointmatriceswhoseentriesdescribethe dissimilarity(ofvoxelpatterns)betweeneach pairof timepointsare calledRepresentationalDissimilarity Matrices(RDMs),asinFig.1D. TheRCAbetweentheRDMsforROIXandY,givenbyMXandMY,is
simplythecorrelationbetweenthem:
RCA=corr(𝑀𝑋,𝑀𝑌) (4)
wherethe correlationis computed between thevectorised upper(or lower) matrices MX and MY. This is implemented in the function
data2rc.m.5
Arelatedidea istotrain aclassifier todiscriminatebetween the patternsassociatedwith,say,twoclassesofstimuli,ineachROI sepa-rately(e.g.ononesubsetofruns),thencomputeeachROI’sclassifier performanceateachtimepoint(intheremainingruns).The correla-tionbetweentheresultingclassificationperformancesofthetwoROIs acrosstimepointscanthenbeusedtoindicatewhethertheinformation inthetwoROIsiscoupled(“informationalconnectivity”,Coutancheand Thompson-Schill2013).Thoughthisprovidesanarrowperspectiveon sharedinformationbetweenthetworegions(inthatonlyoneparticular distinctionisbeingtested),itispotentiallymorepowerfulwhenasingle hypothesisisunderconsideration.
OnelimitationwiththeRCAapproaches(andhencewithdCoras well)isthattheydonotexplicitlyestimatethetransformationbetween thepatternspacesrepresentedwithintheROIs.Thisleadstoourlast time-domainmeasure,thelinearly predictedrepresentational dissimi-larity(Bastietal.,2019).
3.1.5. Linearlypredictedrepresentationaldissimilarity
Finally,atime-domainmeasurethatcombinestheestimationofthe transformationbetweenthemultipletimeseriesandtheconceptof rep-5 NotethatRCAcouldalsobeperformedacrossruns,i.e. M X and M Y could correspondtoRDMsfromtwoseparatescanningruns.Thisisalsoimplemented inthescript,however,oursimulationsgeneratedataindependentlyindifferent runsandthereforearenotsuitedforexploringbetween-runRCA.
resentationalconnectivityisthelinearlypredictedrepresentational dis-similarity(LPRD),definedinBastietal.(2019).SimilartoMVPD,an estimateofthematrixtransformationTbetweenthe(Z-scored,i.e. de-meanedandscaledbystandarddeviation)multipletimeseriesXand
Ycanbeobtainedforeachrunbyusingregularisedleast-squares es-timation, i.e.𝑇=argmin𝐵
{
||XB−𝑌||22+𝜆||𝐵||FF }
, where𝜆 denotesa regularisationparameter.WhenthenormFcorrespondstothe (Frobe-nius)2-normofthematrix(ridgeregression),thereisauniquesolution totheestimationofthetransformation𝑇=(𝑌)′𝑋(𝑋′𝑋+𝜆𝐼𝑑
𝑋)−1.The
regularizationparameter𝜆 canbeobtainedinseveralways,including (nested)leave-one-outcross-validation.Inthiscase,theoptimalvalueis
𝜆 =argmin𝛼{∑𝑡||𝑋(𝑡)𝐵𝛼,𝑡−𝑌(𝑡)||2 2 }
,whereB𝛼,tisthetransformation
obtainedfromridgeregressionofthemultipletimeseriesXandY,but inwhichthet-thtimepointhasbeenremoved,andwitharegularisation parameterequalto𝛼 (Bastietal.,2019;Golubetal.,1979).
Finally,LPRDisdefinedastheaverage(overruns)ofthe correla-tionbetweentheRDMMYassociatedwiththeactualYandtheRDM
𝑀̂𝑌 oftheestimated ̂𝑌(whosepatterns ̂𝑌(𝑡),foreveryt,aredefinedas
X(t)Ttwiththesubscriptdenotingtheremovalofthetimepointtinthe
estimationofthetransformation),i.e.
LPRD=corr(𝑀𝑌,𝑀̂𝑌) (5)
(anacrossrunapproachsimilartoMVPDcanbealsoperformed).The latterisimplementedinthefunctiondata2mvpd_lprd_fc.m.
3.2. Frequency-domainmethods
ContinuingwiththesingletimeseriespervoxelinFig.2A,wecan alsocalculateconnectivityinthefrequency-domaininstead.
3.2.1. Imaginarypartofcoherency
Thefrequency-domainversionoftemporalcorrelationiscoherence. Inparticular,coherencecanbethoughtasthemagnitudeofa normal-izedversionof theFouriertransformofthecross-covariance,i.e. the covariancebetweenonetimeseriesandasecondoneshiftedbyl,over allthetime-lagsl(Brillinger,1981).Thecomplexversionofthe coher-ence,i.e.theoneobtainedwithoutcomputingthemagnitude,issimply calledcoherency(Nolteetal.,2004).
InthecontextofMEG/EEGdata,thezero-lagcomponentbetween two sensors orestimated sources can be artifactual, causedby field spread from the same true source (Marzetti et al., 2019). In the frequency-domain,thiscorrespondstophasedifferencesof0or𝜋,which intermsofcomplexnumberrepresentationcorrespondstosituationsin whichtheimaginarycomponentofcoherencyis0.Toexcludesuch pos-siblyartifactualconnections,acommonproposalistouseonlythe imag-inarypartofcoherency(ImCoh,Nolteetal.,2004),insteadofrelyingon itsmagnitude,thusreducingthezero-lagcontributionsassociatedwith itsrealpart.Usingthetwosingletimeseries̄𝑥and̄𝑦abovetorefertoa dimensionality-reducedversionofthemultipletimeseriesXandY,the ImCohatafrequencyofinterestfisdefinedas:
ImCoh=ℑ ( 𝑐̄𝑥,̄𝑦(𝑓) √ 𝑐̄𝑥,̄𝑥(𝑓)𝑐̄𝑦,̄𝑦(𝑓) ) , (6)
whereℑ(· )istheimaginarypartofacomplexnumberande.g.𝑐̄𝑥,̄𝑦(𝑓)
denotestheFouriertransform(atfrequencyf)ofthecross-covariance between ̄𝑥and ̄𝑦(thesocalledcross-spectrum). NoteImCohisstilla 1D-connectivitymeasure(andcanbecombinedwithaSVDtoreduce eachROItimeseriestoonedimension).
3.2.2. Multivariateinteractionmeasure
ThegeneralisationofImCohtoMD-connectivityhasbeencalleda multivariateinteractionmeasure(MIM,Ewaldetal.,2012).MIMcan beapplieddirectlytoXandYwithouttheneedofdimensionality re-duction.LetCXY(f)be thecross-spectralmatrixbetweenXandY,i.e.
cross-spectrum,𝑐𝑥𝑖 𝑦𝑗 (𝑓),betweenthesingletimeseriesxi andyj.MIM
isthusdefinedas:
MIM=𝑇𝑟((𝐶𝑋𝑋ℜ (𝑓))−1𝐶𝑋𝑌ℑ (𝑓)(𝐶𝑌ℜ𝑌(𝑓))−1(𝐶𝑋𝑌ℑ (𝑓))′ )
(7) where(⋅)ℜand(⋅)ℑaretherealandtheimaginarypartsofthe cross-spectralmatrices,andTr(· )isthetraceofamatrix,i.e.thesumof thediagonalentries.SimilartoImCoh,MIMalsoavoidsinflationofthe estimatedvaluescausedbyartificialzero-lagconnectivity. Moreover, itsvalueisinvariantunderrotationofthedataXandY,makingMIM independentfromthechoiceofthephysicalreferenceframe(e.g.for source-localisedMEG/EEGdata).6
3.2.3. Laggedcoherence
Similartoimaginarycoherency,Pascual-Marqui,2007aintroduced thelaggedcoherence(LagCoh)asamethodthat,bycompletely remov-ingthezero-lagcontributionsfromthesignals,isonlysensitivetolagged coupling.LagCohisdefinedas:
LagCoh=
[
ℑ(𝑐̄𝑥,̄𝑦(𝑓))]2
𝑐̄𝑥,̄𝑥(𝑓)𝑐̄𝑦,̄𝑦(𝑓)−[ℜ(𝑐̄𝑥,̄𝑦(𝑓))]2
, (8)
whereℜ(· )istherealpartofacomplexnumber.Indeed,this formula-tionisequivalenttothecorrectedimaginarycoherence(Ewaldetal., 2012). Note that there are yet other phase-coupling methods, such asimaginarypartofthephaselockingvalue(PalvaandPalva2012; Lachaux etal., 1999) or weightedand unweighted phase lag index (Vincketal.,2011;Stametal.,2007),buttheydonotyethave multi-dimensionalgeneralisations.
3.2.2. Multivariatelaggedcoherence
Wecallthemulti-dimensionalgeneralisationofLagCoh “multivari-atelaggedcoherence” (MVLagCoh,Pascual-Marqui,2007b),definedas:
MVLagCoh = ln det ( ℜ [ 𝐶 𝑌 𝑌 ( 𝑓 ) 𝐶 𝑌 𝑋 ( 𝑓 ) 𝐶 𝑋𝑌 ( 𝑓 ) 𝐶 𝑋𝑋 ( 𝑓 ) ] ) ∕ det ( ℜ [ 𝐶 𝑌 𝑌 ( 𝑓 ) 0 0 T 𝐶 𝑋𝑋 ( 𝑓 ) ] ) det ( [ 𝐶 𝑌 𝑌 ( 𝑓 ) 𝐶 𝑌 𝑋 ( 𝑓 ) 𝐶 𝑋𝑌 ( 𝑓 ) 𝐶 𝑋𝑋 ( 𝑓 ) ] ) ∕ det ( [ 𝐶 𝑌 𝑌 ( 𝑓 ) 0 0 T 𝐶 𝑋𝑋 ( 𝑓 ) ] ) (9)
where0isamatrixofzerosanddet(· )indicatesthedeterminantofa matrix.Similartoits1D-version,itissensitiveto(linear)lagged interac-tionsbutinsensitivetoinstantaneouscoupling;infact,thedenominator oftheaboveequationcharacterisesthatinstantaneouscoupling.Like MIM,MVLagCohisinvariantunderrotationofXandY.Since MVLag-Cohisnotbounded(unliketheotherconnectivitymeasuresabove),we useaboundedversionhere,i.e.1−1∕exp(MVLagCoh).
3.3. Similarityofpatternsbetweenruns/trialsforeachtimepoint
Thusfar,wehaveestimatedasinglemeasureofconnectivityby us-ingmultipletimepoints(replications)– whatmightbecalledstatic con-nectivity(Fig.2A).Ofcourse,onecouldusemovingtimewindowsto estimateconnectivitychangesovertime.However,anothercommon ap-proachistoleveragethefactthat,particularlyintrial-basedEEG/MEG experimentsandsingle-cellrecordings,therecanbemultipletrials,each containingthe sametimepoints with respect totheonsetof a trial (e.g.epochsof−100msto+500mslockedtostimulipresentedevery 1000ms).Inthiscase,onecantakeasingletimepoint,andconstructa RDMofsimilaritiesbetweenallpairsoftrials/stimuliforthattimepoint 6 Interestingly,thereisastrongmathematicalrelationbetweenMIMandCCA (Kherifetal.2002,Hotelling1936).Indeed,mostofthelinearalgebrastepsused inEwaldetal.(2012)tointroduceMIMmatrix(i.e.thematrixpriorthe appli-cationofthetraceoperator)fromtherealpartofcross-spectrumcanbedirectly appliedtothecovariancefordefiningthecanonicalcorrelationmatrixbetween theso-calledcanonicalvectors.Thus,theapplicationofthetraceoperatorto thiscanonicalcorrelationmatrixdefinesafurthertime-domainmeasureofthe totalmulti-dimensional(linear)statisticaldependencybetweentwosetsoftime series(i.e.atime-domainversionofMIM).
(Fig.2B).Inotherwords,onecancalculatetheRCAbetweentheRDMs forasingletimepointandrepeatacrosstimepointsin orderto con-structatimeseriesofdynamicconnectivitybetweenROIs.Indeed,once onehasasingletimeseriesofMD-connectivity,onecanevenuse tech-niqueslikeGrangercausalityonthetwoRCAtimeseries,toinferwhich ROIis“driving” theotherROI(Goddardetal.,2016;Kietzmannetal., 2019).Alternatively,onecancorrelateeachROI’sRDMatagiventime pointwithanindependent(model-based)RDM– basedon,for exam-ple,atheoreticaldivisionofstimuliintotwoclasses,akintothe “infor-mationalconnectivity” (CoutancheandThompson-Schill,2013) men-tionedearlier– therebyproducingasingletimeseriesforeachROIthat capturesthesimilarityofthatROI’spatternwiththetheoreticalRDM, e.g.tracksoutthedynamicsofwhenatheoretically-relevantdistinction emerges.
More generally, the above examples illustrate the flexibility of pattern-basedapproaches.Thus,whilemeasureslikedCorandRCA con-sideredintheprevioussectionsquantifytheextenttowhichtworegions havesimilartemporaldynamics,intermsofthegeometriesofthetime pointsineachROI’svoxelspace,thesamelogicofcorrelatingpattern similaritykernels(RDMs)canbeappliedtocomparethegeometryof pointsineachROI’svoxelspacewheneachpointnowreflectsarun, trialorstimulus,ratherthantimepoint.
Inthenextsection,wewillfocusonsomesimulationcases,showing somepossiblepitfallsandcaveatsassociatedwithalltheabove connec-tivitymethods.
4. Simulationexamples
Thepurposeofthissectionistoillustratesomeoftheadvantages anddisadvantagesassociatedwiththeMD-connectivitymetricsdefined above.TheMATLABscriptforallexamplesisdemo.minhttps://github. com/RikHenson/MultivarCon.
Forthefirstsevenexamples,thetimeseriesintheROI2forther-th run,Yr,isafunctionofthoseintheROI1,Xr,i.e.foreachtimepoint
t: 𝑌𝑟(𝑡)=𝑓(𝑋𝑟(𝑡),𝑇𝑟),whereTristhefunctionalmappingthatmay,or
maynot,changeacrossruns.Forlinearmappings,fisamultiplication andTrisaN
X ×NYmatrix,leadingto𝑌𝑟(𝑡)=𝑋𝑟(𝑡)𝑇𝑟.Finally,to
simu-latemeasurementnoise,independentGaussiannoise(Er)withmeanof
0andstandarddeviationequalto𝜎 isaddedtobothXr(t)andYr(t).
AnimportantpropertyofthevoxelsinROI1(thatinourexamples arebeingmappedtoROI2)isthecovariancematrixoftheirtime se-ries,Cr.Ifthismatrixissuchthatthetimeseriesarehighlypositively
correlatedbetweenallpairsofvoxels,i.e.theROIisfunctionally homo-geneous(orthedataarespatiallysmooth),thenthemeantimeseries overvoxelscanbeasufficientsummaryofactivityinthatROI.Indeed, ifthereisadditionalindependentnoiseoneachtimeseriesinaROI, thenaveragingisaneffectivewayofattenuatingthatnoise.Ifthevoxel timeseriesintheROI2arealsopositivelycorrelated(whichhere de-pendsonthepropertiesofthefunctionalmapping,Tr,e.g.whethera
uniformmapping),thenconnectivitycanbecapturedbya1Dmetric, asshowninExample1.However,ifROI1isnotfunctionally homoge-neous,orifthefunctionalmappingisnotuniform,thentheremaining examplesillustratethemeritsofusingmulti-dimensionalconnectivity metricsinstead.
Forthefirstsixexamplesbelow,weassume50voxelsforROI1and 60fortheROI2,eachwith400timepoints,generatedfortwo indepen-dentruns(weneedmorethanoneruninordertoestimateMVPD).In thelastexample,weassume12voxelsforROI1and10fortheROI2, eachwith2runsof15,360timepoints.Wesimulateddatafrom20 par-ticipantswiththemeasurementnoiseinbothROIshavingastandard deviationof1,i.e.𝜎 =1.
4.1. PositivelycorrelatedactivitiesinROI1andone-to-onevoxelmapping
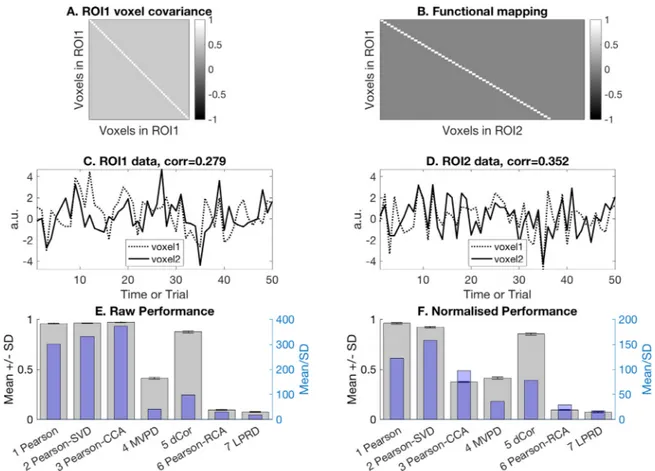
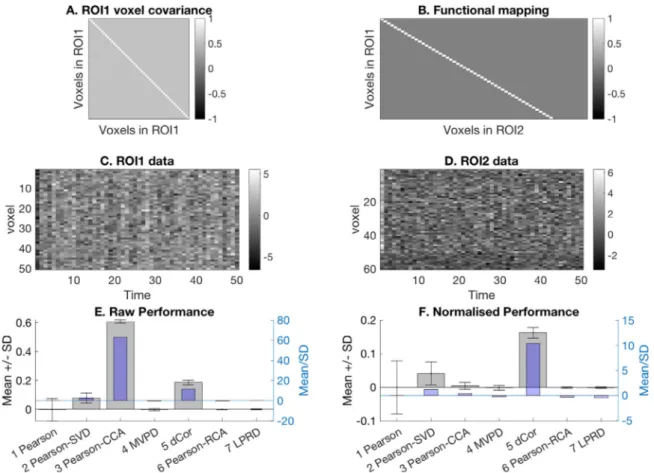
Fig.3AshowsacovariancematrixforROI1thatproducespositively correlatedtimeseries,whileFig.3Bshowsamappingmatrixthat
pro-Fig.3. Wesimulatedaone-to-onevoxelmappinginwhicheveryvoxelinROI1hasaclone(exceptforanadditivenoisecomponent)inROI2.PanelAshowsthe covariancematrixofROI1.PanelBshowsthefunctionalmappingbetweenthetworegions.PanelCandDshowthefirst50timepointsoftwovoxelsineachROI andtheircorrelation.PanelEandFrespectivelyshowtheunnormalisedandnormalisedmean(andstandarddeviation)valuesfortheconnectivitymethodsacross the20simulatedsubjects.ThehighcovarianceamongstthevoxelsofROI1leadstointrinsiclowdimensionaltimeseries,andthustohigherperformanceofthe one-dimensionalconnectivitymethodsthanthemulti-dimensionalconnectivityones.
ducesalinearone-to-onemappingbetweentheNXvoxelsinROI1and
thefirstNXoftheNYvoxelsinROI2(withtheremainingvoxelsinROI2
thereforebeingjustrandomnoise).Fig.3Cand3Dshowthefirst50time pointsoftwovoxelsineachROIandtheirpositivecorrelation.Fig.3E showsthemeanvaluesfortheconnectivitymethodsdescribedinthe previoussection,togetherwitherrorbarsfortheirstandarddeviation, across20simulatedsubjects(greybars);thetransparentbluebarsshow themeanscaledbythestandarddeviation,analogoustoaZ-statistic. Fig.3Fshowstheirnormalisedvalues,whichariseaftersubtractingthe meanvalueofeachmetricwhenthereisnotrueconnectivityandthen normalisingbythestandarddeviationofthenullestimates.Removing thispotentialbiasisimportantbecausesomeofthemetricsdonothave anexpectedvalueof0whenthereisnoconnectivity(e.g.dCorisalways positive)andalsodifferentmeasuresdonotnecessarilyhavethesame scale,therebyallowingeffectsizestobecomparedacrossthedifferent metrics.Similartopanel3E,thetransparentbluebarsgivetheZ-statistic forthenormalisedvalueswhichcanbeusedtoinferreliabilityof con-nectivityacrosssubjects(versuszero).Foreachsimulatedsubject,this null-connectivitywasestimatedbycomputingthemeasuresfromnull dataobtainedbypermutingthetimepointsrandomlyforeveryvoxel (20times).7
Intermsofthebasic(unnormalised)values(Fig.3E),Pearson-CCA andboth the two 1D metricsare best,achieving values close to 1. 7 Differenttimepointswereindependentfromeachotherinoursimulations, however,inrealdatathereisoftentemporalautocorrelation.Random permut-ingofthetimepointsdoesnotpreservethetemporalautocorrelationand there-forepermutingforrealdatashouldpreservethisautocorrelation,e.g.byusing Fourierphasescramblinginstead.
Pearson-CCA alwaysselectsthedirectionsinthetwoROIsthat max-imisethecorrelationand,intermsofrawperformance,itdoesbetter thantheothertwometricsbydefinition.Instead,theadvantageofthe two1D-connectivitymethodswithrespecttotheotherMD-connectivity onesarisesfromtheintrinsiclowdimensionalityofthesignals gener-atedbythehighcovarianceamongthevoxelsinROI1,thusallowing anenhancementoftheSNRwhenusingadimensionalityreduction ap-proach.TheSVDapproachactuallydoesbetterthansimplytakingthe average:thoughthevoxelweightsofthefirstspatialmodeinROI1are fairlyuniform(analogoustotakingtheaverage),theycanvary suffi-cientlytocapturesmalldifferencesintherandomly-drawntimepoints thatmakesometimeseriesmoreorlesssimilartoothers.Thisdifference islessevidentwhenconsideringthenormalisedvalues(Fig.3F). No-tably,Pearson-CCAproduceslowerperformancethan1D-connectivity methods,owingtoanoverestimationofthecorrelationincaseofno connectivity.Thisbehaviourwillreoccurinsomeofthenextexamples. ThoughtheremainingMD-connectivitymethodsarenotassensitiveas thetwo1D-connectivitymethodsinthislow-dimensionalcase,theydo nonethelessproducesignificant(non-zero)Z-statistics,i.e.alsoablein principletodetectthepresenceofconnectivity.
4.2. AnticorrelatedactivitieswithinROI1andone-to-onevoxelmapping
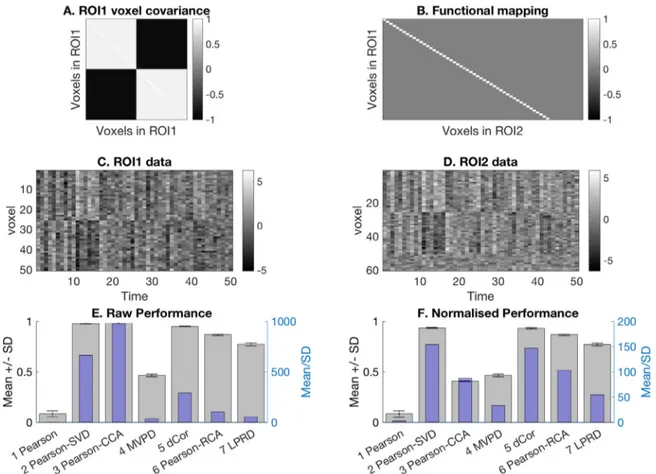
Thoughthefunctionalmappingisthesameastheoneusedinthe previousexample(Fig.4B),thissecondexampleillustratesthepresence oftwofunctionalsubdivisionswithinROI1,whicharenegatively corre-latedtooneanother,asindicatedinFig.4A.Thispatternhasbeenseen in realfMRIdataforexample (Geerligsetal.2016),arisingperhaps whenthechosenROIsdonotrespectthetruefunctionalanatomyofthe
Fig.4. Wesimulatedaone-to-onevoxelmappinginwhicheveryvoxelinROI1hasaclone(exceptforanadditivenoisecomponent)inROI2.PanelAshowsthe covariancematrixofROI1.PanelBshowsthefunctionalmappingbetweenthetworegions.PanelCandDshowthefirst50timepointsofallthetimeseriesineach ROI.PanelEandFrespectivelyshowtheunnormalisedandnormalisedmean(andstandarddeviation)valuesfortheconnectivitymethodsacrossthe20simulated subjects.Inthiscase,ROI1iscomposedoftwoanti-correlatedsubpopulationstimeseries,suchthatsimpleaveragingovervoxelsdestroysthesignal.However,by takingthefirsttemporalmodefromaSVDinstead,connectivitycanstillbedetectedbya1DPearson’scorrelation.
brain.This“structure” canbeseeninFig.4C-D,whichshowthetime se-ries(forthefirst50timepoints)forallvoxels,nowinan“image” format, ratherthanthelineplotsinFig.3C-D.Inthiscase,dueto anticorrela-tions,averagingovervoxelsinROI1(andROI2)destroysmostofthe signal,leavingjustnoise,andsoPearsoncorrelationbetweenthemean valuesacrossvoxelsisclosetozero(Fig.4E-F).Takingthefirst tem-poralmodefromaSVD,however,recoverssensitivity.Thisisbecause somevoxelweightsofthedominantspatialmodearepositivewhereas theothervoxelweightsarenegative,suchthatthecombinedsignalis notcancelledout.Nonetheless,thesignalisstillonedimensional (indi-catedbythedominanceofthefirstsingularvalueoftheSVD),meaning thatthe1D-correlationisstillmoresensitivethantheMD-connectivity methods.
4.3. Uncorrelatedactivitiesandmulti-dimensionalmapping
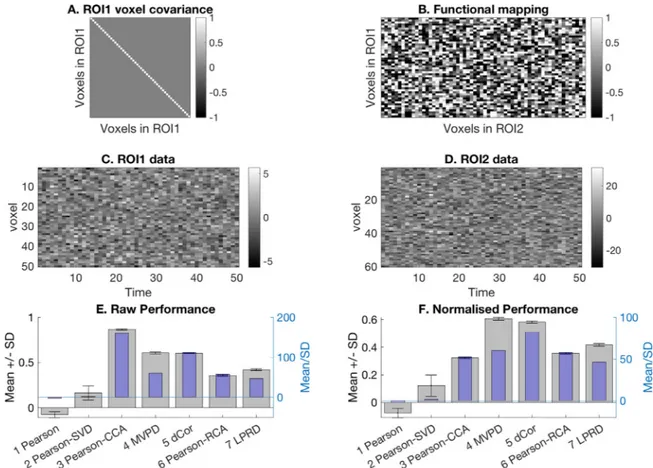
Fig.5Ashowsacovariancematrixthatproducesuncorrelatedtime seriesinROI1,whileFig.5Bshowsafunctionalmappingwhoseentries aredrawnrandomlyfromaGaussiandistribution.Theindependenttime seriesgeneratedinROI1(Fig.5C)andthetimeseriesinROI2(Fig.5D) obtainedthroughtheapplicationofthecomplexMD-mappingcanno longerbeoptimallyreducedtoasingletimeseriesbytakingtheaverage orfirst temporalmodes(betterperformanceis obtainedby Pearson-CCA,sincethetwosingletimeseriesarenotseparatelyselectedforeach ROI,butratherchosentogetherbytakingintoaccountthecovariance betweenROIs).Thus,both1D-connectivitymethodsperformedpoorly comparedtoallMD-connectivitymethods(Fig.5Eand5F).
Wecan usethis exampletocomparethevariousmetricsin their sensitivitytonoise(thenumberoftimepointsis400andthesizeof
thetwoROIs,XandY,is50and60,respectively).Fig.6Ashowshow eachmetricperformsasthesignal-to-noiseratio(SNR)increases(i.e. noisedecreasesfromlefttoright).They-axisplotsthenormalized per-formance,suchthatthelinesandshadedareasshowthemeanand stan-darderrorofthedifferencebetweentrueandnull(permuted)values. Asexpected,the1D-connectivitymethodsperformpoorly,thoughfor highSNRs,theyperformabovechance,mostlikelybecausesome de-pendencybetweentheROIscanstillbecapturedbyprojectingontoa singledimension.Inthiscase,selectingonlyonesingledirectionper ROIbasedonCCAisnotsufficienttoreachtheperformanceobtained byotherMD-connectivitymethods,whichcanusemultipledimensions. Interestingly,dCorseemsleastsensitivetonoise,andRCAismost sen-sitivetonoise,whileLPRDandMVPDshowmaximalperformanceat highSNRs.However,asapparentinsubsequentexamplesbelow,there aresituationsotherthanthecurrentcaseofuncorrelatedactivitiesand MD-mapping(i.e.afixed,linearmappingTplusrandomnoise)where someMD-connectivitymetricsarebetterthanothers,regardlessofthe SNR.
Fig.6Bshowsthesamenormalizedperformanceplottednowagainst thenumberoftimepoints(relativetothetotalnumberofvoxelsacross thetwoROIs).Thus,forthesamelevelofnoiseusedinexample3(i.e. aSNRapproximatelyequalto1),thisplotshowshowthemetrics per-form astheamountof data(durationof recording)increases.Again, MVPDdoesbestwhentherearelotsofdata,butdCorcandobetterwhen thereislittledata(atleastrelativetothesizeoftheROIs).Interestingly, RCAandLPRDseemrelativelyrobusttotheamountofdata,whileCCA showsthegreatestdependenceondataduration,onlyapproaching per-formanceoftheothermetricswhentheratiooftimepointstovoxelsis high.
Fig.5. Inthisexample,thecovariancematrixistheidentitymatrixthatgeneratesuncorrelatedtimeseriesinROI1.ThefunctionalmappingfromROI1toROI2is generatedsuchthatitsentriesfollowedstandardGaussiandistribution.Thecombinationofthesetwofeaturesleadstolowperformanceofboththe1D-connectivity methods,whiletheMD-connectivitymethodsobtainedhighperformance.
Fig.6. PanelAshowsnormalisedperformance(trueminusnull)ofeachmetricforExample3(uncorrelatedactivitiesandmulti-dimensionalmapping)as signal-to-noiseratio(SNR)increaseslefttoright.SNRisdefinedasthevarianceofsignaloverthevarianceofnoise.0correspondstonosignalandpurenoiseandvery largeSNRmeansthatthereisverylittlenoisevariancecomparedtosignalvariance.PanelBshowsnormalisedperformanceastherationbetweenthenumberof timepointsandthetotalnumberofvoxelsinthetwoROIsincreaseslefttoright.
4.4. Multi-dimensionalmappingthatchangesacrossruns
Thisexample is identicaltotheprevious one– inthatthe voxel timeseriesareuncorrelated(Fig.7A)andthefunctionalmappingis ran-dom(Fig.7B)– exceptthatthefunctionalmappingnowchangesacross runs(Fig.7Bisanexamplefromonlyonerun).Thismighthappenif thevoxel-wisesamplingoftheunderlyingneuronschangesacrossruns, e.g.duetouncorrectableheadmotion,orifthereareeffectsof learn-ingacrossrunsthatchangethefunctionalconnectivity.Alternatively,it
mighthappenifdifferentrunscontaindifferentstimuli(whereeachtime pointrepresentsonetrialwithonestimulus,andtherearecomplex in-teractionsbetweenneuronsinthetwoROIsthatdependonthespecific stimuli).Forexample,inanexperimentwithbothauditoryandvisual stimuli,itmightwellbethecasethatregionshavedifferentconnectivity forvisualandforauditorystimuli.Inanycase,changesinTacrossruns detrimentallyaffectMVPD,becausetheMD-mappingistrainedonone runandtestedonothers.However,thewithin-runmeasuresof Pearson-CCA,dCor,RCAandLPRDremainsensitive(Fig.7F).
Fig.7. Inconsistent linear MD-mappings between the two regions cannot be detected by MVPD. In this example, like the previous one, the activity of each voxel in ROI2 is a
weighted combination of activities of all voxels in ROI1 with some additive noise (destroying 1D-connectivity). Importantly the weights change for independent measurements,
i.e. runs. Panel B shows the weights for one of the runs only (it would be different for any other run). This severely affects MVPD. However, distance correlation, RCA and
LPRD can detect these types of interactions.
4.5. Nonlinearmapping
InFig.8,wereturntothepositivevoxelcovarianceinROI1(Fig.8A) andtheone-to-onefunctionalmappingmatrixTr (Fig.8B)thatwere
usedinExample1.However,thetimeseriesinROI2arenowa non-linearfunctionofthoseinROI1andTr,hereillustratedbytakingthe
absolutevalueofXr(t)Tr.Thus,whereasthetimeseriesinROI1(Fig.8C)
arecentredaroundzero,thetimeseriesinROI2(Fig.7D)aregenerally abovezero(exceptfortheadditiveGaussiannoise).Thisnowabolishes connectivityaccordingtoallmeasuresbutdCor,whichcanhandlesuch nonlinearity(Fig.8F).NotehoweverthatthisisbecausedCorusesa Eu-clideanmetricofsimilarityofvoxel-patternsbetweentimepoints(trials) – ifwechangethesimilaritymeasureinRCAfrom(Pearson)correlation toEuclidean,thenRCAcanalsoproducesignificantconnectivityjust likedCor.
4.6. StructurednoiseinROI2
InFig.9,thefunctionalmappingmatrix(Fig.9B)isidenticaltothat inExample2.However,additionalstructurednoisehasbeenaddedto ROI2,whichisidenticalacrossvoxels(producingthecoherent, vertical-bar patternin Fig.9D). This reducesperformanceof dCor(Fig.9F), whichusesaEuclideanmeasureofsimilaritybetweentimepoints (tri-als),bute.g.not(thecurrentversionof)RCA,whichusesacorrelational measurethatisinvarianttoanyconstantoffsetsinthevoxel-patterns. Structurednoise(thataffectsallvoxels)canbepresentinrealdatadue tovariousreasons,suchassubjectmovementorchangeinthesubject’s alertness/vigilanceacrosstimepoints.Anotherwaytoeliminatethis wouldbetonormalize(z-score)theactivitypatternsineachtimepoint (acrossvoxels)beforecomputingconnectivitymeasures.
4.7. Multi-dimensionallaggedinteraction
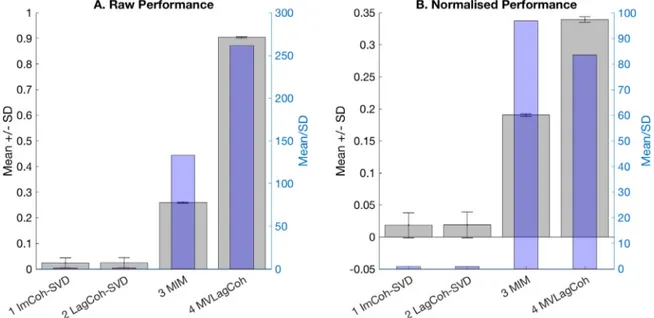
Whereastheprevioussixexamplesshowedsomeadvantagesand dis-advantagesofconnectivitymethodsincapturingthepresenceof instan-taneousinteractionbetween multidimensionalsignals,herewe focus onlaggedinteractions(e.g.whentimepointNinROI2dependsontime pointN-1inROI1).AsexplainedinSection2.2,coherencycancapture suchlaggedinteractions,of whichimaginarycoherency(ImCoh)and laggedcoherence(LagCoh)aretwofrequency-dependentmeasuresthat do notleadtoartifactualphase-couplingduetozero-laginteractions (ormoreprecisely,signalsinphaseoranti-phase)betweensensorsor sourcesinMEG/EEGdata.However,thesetwomethodswereoriginally definedforpairsofsingletimeseries;themultivariateinteraction mea-sure(MIM)andmultivariatelaggedcoherence(MVLagCoh)aretheir extensionsthatcancapturemulti-dimensionaldependencies.
Forthisexample,thetimeseriesinROI2isalaggedfunctionofROI1, i.e.foreachtimepointt,wehavethat𝑌𝑟(𝑡)=𝑋𝑟(𝑡−𝜏)𝑇𝑟.Here,𝜏
de-notesthetimedelayintheinteraction,whichwesetto𝜏 =10(which e.g.corresponds to ≈ 40mswhen thesamplingfrequencyis setto 256Hz).Toreducecomputationtime,weassume12voxelsforROI1 and10voxelsforROI2,eachwith2runsof15,360timepoints (typ-icalforMEG/EEG).TheelementsofthetransformationmatrixTwere againdrawnrandomlyfromaGaussiandistribution(likeinexamples3– 4above).Finally,thezero-meanGaussianadditivemeasurementnoise
Er(t)wasassumedindependentacrossvoxelswithastandarddeviation
equalto0.1(notethatresultssimilartothosedescribedbelowcanalso beobtainedbyusingspatially-correlatednoise,suchastheoneinduced byfieldspread/volumeconductioninMEG/EEG).
WecomparedMIMandMVLagCohmeasureswithImCohand Lag-Coh, withthelatterapplied tothefirsttemporalmodesof eachROI
Fig.8. Inthisexample,thecovariancematrixofROI1andthefunctionalmappingisexactlythesameasinExample1.TheonlydifferencetoExample1isthatthe mappinghasanextranonlinearitythatisappliedafterthelineartransformation(takingtheabsolutevalue).OnlydCorcandetectMD-relationshipsinthiscase.
Fig.9. ThepresenceofstructurednoiseinROI2(identicalacrossvoxelsbutchangingacrosstimepoints)causes1D-connectivitymeasuresanddCorandMVPDto performpoorly,thoughPearson-RCAandLPRDcanstillsuccessfullydetecttheconnectivityofthetwoROIs.
Fig.10. Thesimulatedmulti-dimensionallaggedinteractionbetweenROIsmeansthatthe1D-connectivitymethodsperformpoorly.Onthecontrary,both MD-connectivitymethodsshowgoodperformance.
(labelled ImCoh-SVD and LagCoh-SVD in Fig. 10). Unlike the MD-connectivitymethods,both1D-connectivitymethodsperformcloseto chance.Thisisbecauseprojectingthetimeseriesontoasingle dimen-sionresultsinsmaller,andthuslessdetectable,phasedifferences. Con-versely,MIMandMVLagCohdonotrequiretheapplicationofthe di-mensionalityreductionandconsiderallthedimensions,thusresulting inhigherperformance.Inthisspecificexample,MVLagCohperformance overcomestheoneobtainedbyMIM.However,itispossiblethatthis differenceisduetothespecificsimulationsettings(e.g.typeofnoise anddelayinthecoupling).
5. Empiricalexamples
Wecompared 1DandMDmeasuresof connectivityonreal fMRI andMEGresting-statedata.Thesedatacamefromthe20youngest par-ticipants(aged18–21)intheCamCANcohort(www.cam-can.org)and from100randomly-chosensubjectsintheHumanConnectomeProject (HCP)dataset(http://www.humanconnectome.org).TheCamCAN par-ticipantsonlyhave1run(offMRIandofMEGdata),soareonlyused belowformetricsthatdonotrequirecross-validation;theHCP partici-pantshave4runs(offMRIdata),soareusedtotestthecross-validated metrics.
The raw and preprocessed CamCan data are available on re-quest here: (https://camcan-archive.mrc-cbu.cam.ac.uk/dataaccess/), whilethefinalROI-basedtimeseriesareavailablehere ftp://ftp.mrc-cbu.cam.ac.uk/personal/rik.henson/MDcon/CamCAN. The fMRI data andMEGdatawererecorded(inseparatesessions)whilesubjectsrested withtheireyesclosedforapproximately 8.5mins. WeusedthefMRI datatotestthenon-lagged(time-domain)connectivitymetrics,andthe MEGdatatotestthelagged(frequency-domain)metrics.Sincewedonot knowthegroundtruthwhendealingwithrealdata,wechoseameasure ofqualityasthedifferencebetweenconnectivityestimatesfor homol-ogousversusnon-homologousconnectionsbetweencorticalROIs:one generallyexpectshigherconnectivitybetweenhomologousROIs.More precisely,foreachROIinthelefthemisphere,wecomparedits connec-tivitytoitshomologousROIintherighthemisphere,withtheaverage ofconnectivityestimatestoallotherright-hemisphereROIs(notethat, becauseallourmetricsaresymmetrical,thisisequivalentto compar-ingeachright-hemisphereROIwithallcorrespondinglefthemisphere ROIs).Werefertothisasthe“homologyscore”,withhigherscores as-sumedtobebetter.Moreprecisely,fortheCamCANdata,weusedthis
approach forthe48 cortical,anatomicalROIsin theHarvard-Oxford Atlas(HOAatlas,https://fsl.fmrib.ox.ac.uk/fsl/fslwiki/Atlases).Forthe HCPdata,giventheirmuchlargersize,wefocused(forcomputational reasons)ontheconnectivitybetweentwo,sub-corticalROIs:leftand righthippocampus,giventhatfunctionalheterogeneityhasbeen pro-posedwithinthehippocampus(particularlyalongitsanterior-posterior extent,RanganathandRitchey,2012).
5.1. fMRI(zero-lag,time-domain)analyses
5.1.1. Non-cross-validated(singlerun)CamCANresults
TheCamCANfMRIdataconsistedof261scans(timepoints)every 1.97s.Theoriginalimageswerecorrectedformotionandslice-timing, warpedtoastandardMNIspaceandwaveletde-spiked(seeTayloretal., 2017, forfuller descriptionofacquisitiondetailsandpreprocessing). Timeserieswerethenextractedforeach3×3×3mmvoxelwithin eachofthe96corticalROIsintheHOA,whichtypicallyvariedfrom 25to1643voxels(median=230).ThescriptforestimatingthefMRI connectivitymetricsiscalled“test_fmri.m” intheGitHubdirectory.
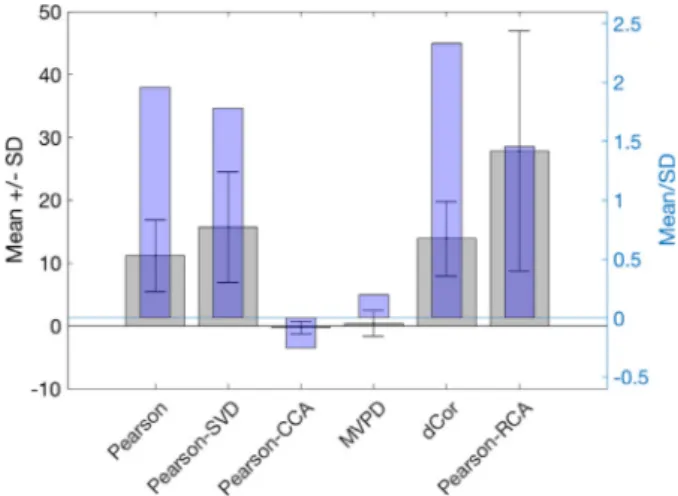
Inordertocompareacrossmetrics,eachmetricwasnormalisedby 20 phase-scrambled versions of thedata, producing aZ-score (simi-lartowhatwasdoneforsimulations,thoughunliketherandom per-mutingoftimepointsdonethere,herethescramblingofphases pre-servedthepowerspectrum,usingthephase_rand.mfunctionavailable intheGitHubdirectory).Thedifferencebetween(noise-normalised) ho-mologousversusnon-homologousconnectivityestimateswascalculated foreachparticipant.Thesehomologyscoreswereaveragedoverall48 connections,anddividedbythestandarddeviationacrosssubjects,as showninFig.11A.Ascanbeseen,allthemetricsshowapositive ho-mologyeffect,aspredicted,thoughthe1DPearsoncorrelationdidbest, withtheMDdCormetricdoingnextbest.Pearson-CCAdidworst,which is likelytoreflecttherelativelylownumberof timepoints,ormore specifically,thelowmeanratioacrossROIs(0.57)oftimepoints(261) tovoxels(2×230);seeFig.6B.
Fig.11AonlyshowsaverageperformanceacrossROIs.Tofurther ex-plorethesefindings,insteadofaveragingoverconnections,weaveraged oversubjects,andcalculatedtheconnectivitymetricthatproducedthe best(normalised)homologyscoreforeachofthe48connections.The resultsareshowninFig.11B,whichrevealasomewhatdifferent pat-tern.TheleftaxisshowsthecountofthenumberofROIsforwhich thatmetricshowedthehighestnormalisedhomologyeffect.Ascanbe
Fig.11. Performanceofthenon-cross-validated,zero-lag(time-domain)metricsonthesinglerunoffMRIdatafrom20subjectsintheCamCANdataset.PanelA showsmeanandstandarddeviationacrosssubjectsofthenoise-normalizedconnectivityvalues(leftaxis)andcorrespondingZ-scoreacrosssubjects(rightaxis).The leftaxisofPanelBshowsthenumberofconnections(outof48)forwhicheachmetricproducedthehighestnoise-normalisedvalue(onaverageacrosssubjects), whiletherightaxisshowstheaveragenumberofdimensionsneededtocapture95%ofthevarianceinthelefthemisphereROIassociatedwitheachconnection.
seen,Pearson-RCAhadthehighestscoreforthelargestnumberofROIs, suggestingthat, eveniftheydonotdo muchbetteronaverage over connections,MDmethodsarebetterforanappreciableproportionof ROIsinthis fMRIdataset.Therightaxisshowsthemeannumberof dimensionsrequiredbyaSVDtoexplain95%ofthevarianceinthe (left-hemisphere)ROIsassociatedwiththesetofconnectionsforwhich thatmetricdoesbest.Asexpected,theROIsforwhichtheMD Pearson-RCA(anddCor)metricdidbesttendedtohavehigherdimensionality thanthoseforwhich1DPearsondidbest.
5.1.2. Cross-validated(multipleruns)HCPresults
TheHCPfMRIdataconsistedof1200scansacquiredevery0.72s (Glasser etal., 2016,for moredetailsof acquisitionand preprocess-ing).Thedatawereextractedfromleftandrighthippocampusparcels (Glasseretal.,2016).Voxelsizeswere2mmisotropicandtherewereon average230(left)and213(right)voxelswithinthehippocampalROIs. ThesedatawereusedtotesttheMVPDmetricthatrequires between-runcross-validation (which wasdonefour-fold across thefourruns, i.e. leave-one-out),though non-cross-validated metricswere also in-cluded,andtheirwithin-runresultsjustaveragedoverruns.Notethat theLPRD metricwasnot includedbecauseourimplementation addi-tionallyrequiresleave-one(stimulus/timepoint)-out cross-validation within-runs,whichisdifficultwhentimepointswithinarunarehighly auto-correlated(in this case it is preferableto use otherwithin-run cross-validationapproachesthattakeintoaccountthetemporal auto-correlation).WhilewedonotknowtherelativeSNRoftheCamCAN andHCP datasets,itisworth noting(inrelationtoFig.6B)thatthe ratiooftimepointstovoxelsintheHCPdataset(1200/443=2.71)is higherthanintheCamCANdataset(medianvalueof0.57acrossROIs). TheHCP results areshown in Fig. 12, normalizedby 20 phase-scrambled versions and averaged across subjects, as described for Fig.11AintheCamCANdataabove.Theresultsaresimilar tothose Fig.11A,thoughinthiscase,theMDmethoddCoractuallydidbetter than1DPearson.Pearson-RCA(MD)andPearson-SVD(1D)did reason-ablywell,butMVPDandPearson-CCAdidnotdobetterthanchance. Thechance-performanceofMVPDissimilartowhatwasshownin sim-ulationExample3,wherethemappingTvariesbetweenruns.Itis pos-siblethattheHCPdataalsoentailamappingthatchangesacrossruns (e.g.owingtoresidualmotion-relateddifferences).Pearson-CCAdoes notperformwell,perhapsbecausetheratiooftimepointstototal num-berofvoxelsisstillrelativelysmall,evenintheHCPdataset(Fig.6B).
5.2. MEG(lagged,frequency-domain)analyses
TheMEGdatawereacquiredfrom102magnetometersand204 pla-nargradiometers,sampledat1kHz.Detailsofthepreprocessingcan againbefoundinTayloretal.(2017),butinbrief,environmentalnoise
Fig.12. Performance of the time-domain metrics across 4 runs of fMRI data from
100 subjects in the HCP dataset. See Fig.11A legend for more details.
wasremovedusingsignal-spaceseparation,bad(outlying)2sepochs wereexcluded,andthedatabandpass-filteredfrom1to48Hz.A single-shellheadmodelwasconstructedfromeachsubject’sstructuralMRIand ascalarbeamformerusedtoprojectthesensordatatoapproximately 8000pointsona6mmgridwithin thebrain.Timeseries(scaledby beamformerweightstoadjustfordepth)werethenextractedforeach gridpointwithineachofthe96corticalHOAROIs,whichtypically var-iedfrom 2to339“voxels” (median=41;note these6×6×6mm voxelsareconsiderablylargerthanthefMRIonesabove).Tomakethe datasizemoremanageable(e.g.,keepthefilesizebelow2MB),data werethendownsampledto100Hz,andonlythemiddlehalf(260s)of thedataextracted.Theresultingtimeseriesthereforecontained26,000 timepointsevery10ms(100Hz).ThescriptforestimatingthefMRI connectivitymetricsiscalled“test_meg.m” intheGitHubdirectory.
Thefrequency-domainmethodswereappliedtoabroadfrequency range(4–48Hz),whichencompassesthedominantbrainoscillations andbecausecross-hemispherecouplinghasbeenobservedacrossmany suchfrequencies(Vidaurreetal.,2018).Whennormalisingby20 phase-scrambled versions, none of the MEG laggedmeasures (1D or MD) showed a homologyeffect that wassignificantly above 0. This may reflect thelowerSNRof MEGdatathanfMRIdata.Whilethismight beresolvedbyrunningmanymorephase-scrambledversions,this be-comescomputationallyprohibitive.Therefore,weexaminedthe non-normalised results. Although these do not allow direct comparison acrossmetrics,becausewearesubtractingnon-homologousconnections fromhomologousones,theexpectedchancevalueofthehomologyscore foreachmetricisstillzero.Thesenon-normalisedresults,averagedover
Fig.13. Performance of the non-cross-validated, lagged frequency-domain metrics
on the single run of source-reconstructed MEG data from 20 subjects in the CamCAN
dataset. See Fig.11A legend for more details.
the48connections,areshowninFig.13.Importantly,thetwoMD met-rics(MIMandMVLagCoh)bothdidbetter thantheir 1Dequivalents (ImCohandLagCohrespectively).Inaddition,theLaggedCoherence metricsdidbetterthantheImaginaryCoherencemetrics(possiblydue tothefactthatLagCohandMVLagCoharebetteratpartiallingoutthe zero-lagcontributions,whichmightincreasethenumberoffalse nega-tives,thanareImCohandMIM).
6. Discussion
Neuroscienceresearchbenefitsfromconstantadvancesinbrain mea-surementandanalysistechniques. Forexample,recentdevelopments inmachinelearningandpatternanalysisinparticularhavehelped re-searchersgaininsightintotheinformationthatiscarriedbypopulations ofneurons,orthatisdistributedacrossmanyresponsechannels(e.g. EEGelectrodes,fMRIvoxels,etc.).Whilepatternanalysisisnow com-monlyusedforinformationmappingforindividualROIsinthebrain, researchonfunctionalconnectivitybetweenROIshasnotbenefittedto thesameextent.Themainpremiseofpatterninformationanalysisisthat aregion’sresponsecannotbecharacterizedbyaone-dimensional(1D) response(e.g.averageresponse)butcanbethoughtofaspointsin high-dimensionalresponsespaces.Recently,anumberofmethodshavebeen proposedthatbridgefromclassical1D-functionalconnectivityanalysis tomulti-dimensional(MD)patternanalysis,whichcapturetheshared informationintworegions.Inthispaper,wereviewedanumberof MD-connectivitymethods,inamannerthatwehopeishelpfultoboththose whowantanintuitiveintroductionandthosewhowantaformal charac-terisation.Wealsosimulatedspecialcasesthatwereconstructedinorder toillustratethemainstrengthsandweaknessesofeachapproach.The takehomemessagesfromoursimulationsaresummarisedinTable1.
ThemainmessagesinTable1includethefactthatmultivariate pat-terndependence(MVPD,Anzellottietal.,2017b)andlinearlypredicted representationaldissimilarity(LPRD,Bastietal.,2019)havethe advan-tagethattheyprovideagenerativemodelofregionalinteractions(also atthelevelofsubspacescorrespondingtothedominantprincipal com-ponents),whereasdistancecorrelation(Geerligsetal.2016)and rep-resentationalconnectivityanalysis(Kriegeskorteetal.,2008)quantify sharedinformationwithoutprovidingamodel(i.e.aMD-mappingfrom oneregiontoanother).However,estimatingthismappingrequiresthat MVPDisgivenmultipledatasets(runs)withwhichtocross-validatethe mapping.ThisisproblematicforMVPDifthemappingchangesacross runs(e.g. duetoheadmotionin fMRI).LPRD(as itis implemented here)overcomesthisissuebyestimatingthetransformationina within-runcross-validatedframework,attheexpenseofpotentialbiased esti-matesofthemappingifthenoiseiscorrelated.Also,thesemappingsare
normallyassumedtobelinear,andwhilenonlinearmappingscouldbe Table
1 Summary of characteristics of different functional connectivity measures tested here. Method 1D/MD Provide a model of transformation Require more than one run Handle run-specific MD-mapping (see example 4) Able to detect nonlinear coupling (see example 5) Sensitive to structured noise (see example 6) Dim. reduction Time or frequency domain (sensitive to lagged coupling) P e arson 1D No No No No Ye s Ye s Ti m e (N o) P e arson-S V D 1D No No No No Ye s Ye s Ti m e (N o) P e arson-CC A MD No No Ye s No Ye s Ye s Ti m e (N o) MVPD MD Ye s Ye s No No Ye s Ye s/ N o Ti m e (N o) dCor MD No No Ye s Ye s Ye s No Ti m e (N o) P e arson-R C A MD No No Ye s No No No Ti m e (N o) LPRD MD Ye s Ye s/ N o Ye s/ N o No No Ye s/ N o Ti m e (N o) ImCoh-S V D 1D No No No No Ye s Ye s Fr eq uency (Y es) LagCoh-S VD 1D No No No No Ye s Ye s Fr eq uency (Y es) MIM MD No No Ye s No Ye s No Fr eq uency (Y es) MVLagCoh MD No No Ye s No Ye s No Fr eq uency (Y es)
trained(e.g.usingneuralnetworks,Anzellottietal.,2017a),thiswould generallyrequiremoredata.
Bycontrast,distance-basedapproacheslikedCorandRCAcanmore easilyhandlenonlinearmappings,e.g.throughusingEuclideanorother metricsofdissimilaritybetweenpatterns(indeed,dCorcanbeseenasa specialcaseofRCAthatusesaEuclideanmetric).However,adownside ofmetricslikeEuclideandistance(andhencedCor)isthattheycanbe moresensitivetostructurednoise(e.g.betweenruns)thanare corre-lationalmetrics(likePearson-CCA)thatnormalisebythevariancein eachtimeseries.AnalternativesolutionistoZ-transformthetime se-riespriortoestimatingconnectivity,thoughthiscaninturnmisswhat mightbetruedifferencesinthemagnitudeofdissimilaritybetween pat-terns(whichiswhywedidnotZ-transforminourexamples,although ourcodeprovidesthisoption).
SomeMD-connectivitymethodshavetheoptionofdimension reduc-tion,suchasusingSVDtoreducetoN>1componentsthatcapturethe majorityofvariancewithineachROI.However,adangerhereisthat theremaybeimportantcovariancebetweenROIs(theprimaryfocusof connectivityanalysis)thatdoesnotrepresentalargeproportionofthe variancewithinoneoftheROIs,andthereforeislostbydimension re-duction.ThisisexactlytheproblemthatCCAsolves,byselectingone timeseriesperROIthatsimultaneouslymaximisesthecorrelation be-tweenROIs,ratherthanselectingonetimeseriesthatsummariseseach ROIindependently.Anothersolution(thatcouldbeappliedtoLPRDand MVPD)istoregulariseestimationofthemulti-dimensionalmapping be-tweenROIs,whichencouragesdimensionreductionatthesametimeas capturingtheimportantcovariancebetweenROIs.
InSection4.3, wealso exploredthesensitivityof eachmetricto noise.WhilethisplotonlyapplieswhenTisafixed,linearmappingand thenoiseisindependentacrossvoxels,itsuggeststhatsomemeasures likedCoraremorerobusttonoisethanotherslikeRCA.Thisrobustness willdependonthedetailsofthealgorithm(e.g.measureofdissimilarity usedinRCA),whichisbeyondthecurrentremit,butthesimulation re-sultssuggestthatonemightwanttoconsiderarangeofMD-connectivity metricsona(held-out)dataset,toseewhichismostrobusttothetype andlevelofnoiseinthatdataset.
Finally,ofthemethodsconsideredhere,onlythemultivariate inter-actionmeasure(MIM,Ewaldetal.,2012)andmultivariatelagged coher-ence(MVLagCoh,Pascual-Marqui,2007b)cancurrentlycapture time-lagged, multi-dimensionalphase-couplingbetween ROIs. Wesuspect thiswillbeparticularlyimportantforsource-reconstructedMEG/EEG data,whereROIscontainmultipletimeseriesfromdipoleswith differ-entorientations(giventhatthesignofthedatadependsonthedipole orientation),whichmeansthatsimpleaveragingwillneverbe appro-priate.
When applied to real data, using relatively large, anatomically-definedROIs,wefoundthat,while1Dmetrics,specificallyPearson cor-relation,oftenperformedaswellasMDmetricslikedCorand Pearson-RCA,whenaveragingacrossconnections(ROIs),therewasasignificant proportionofconnections(intheCamCANfMRIdata)forwhichMD metricsdidbetter.TheadvantageofMDmetricswasevenclearerfor the(lagged)metricsappliedtosource-reconstructedMEGdata,where MDmetricsalsooutperformedtheir1Dequivalentsonaverageacrossall connections.Thismaybebecausethesignalineach“voxel” in source-localisedMEGdependsonthedominantorientationoftheunderlying electricalcurrentsinthatvoxel,whichmayresultinahigher dimen-sionalityofdominantsignalvariancewithintheROIs.
Notethat,whileweusedfMRItodemonstratenon-laggedmeasures andMEGtodemonstratelaggedmeasures,itispossibletoapplylagged measurestofMRIdata(e.g.afteradjustingforthepotentialconfoundof differenthaemodynamicresponsefunctionsindifferentROIs)and non-laggedmeasurestoMEGdata(e.g.afteradjustingforzero-lageffectsof field-spread).Notealsothat,evenwithnon-laggedmeasures,regional variabilityinthehaemodynamicresponsefunctioncanstillconfound fMRImeasuresoffunctionalconnectivity(Rangaprakashetal.,2018).
ItisimportanttorememberthatonecoulddefineROIsasonesin which their components(e.g. voxels)arefunctionallyhomogeneous, andthereforeoneswhereaveragingand1D-connectivityisthecorrect approachbydefinition.Forexample,ROIscouldbedefined function-allybycontiguouscollectionsofvoxelsthathavesimilartimeseries, or evensimilar 1D-connectivity (Craddock etal., 2015).This would negatetheneedforanyMD-connectivity.However,inmanysituations, thehomogeneityofROIsisnotknown,forexamplewhentheyare de-finedanatomically,orwhentheirfunctionaldefinitioninone popula-tion(e.g.youngpeople)maynotgeneralizetoanother(e.g.older peo-ple;Geerligsetal.,2017).Relatedly,itisworthnotingthatinvestigating theinformationcontentofactivitypatternscanuncoverprocessesthat arenotaccessibleby1D-connectivitymethods.Forexample,while aver-agesingleactivationsforGaborpatchesofvariousorientationsmightbe equivalentinearlyvisualareas,activitypatternsinthoseareas nonethe-lessdemonstrateexplicitinformationabouttheorientationofthe stim-uli.Therefore,itmaybethecasethataveragingactivationsacross re-sponsechannelsmasksthefactthattworegionshavedifferentresponse properties,eventhoughtheyarecalled“connected” according to1D analysis.Thisistheconversetowhatweshowinourexamples,i.e.that tworegionsmighthavesharedinformationintheirMD-responsesbut no1D-connectivity.
6.1. Tenrulesformulti-dimensionalfunctionalconnectivity
Belowweoffertenrulesforsomeoneconsideringapplicationof MD-connectivitymeasures:
1 IfyouareconfidentthatallyourROIsarehomogeneous,then 1D-connectivitymethodscan bemoresensitivethanMD-connectivity methods.Inthiscase,themeanacross voxelsisasufficient sum-mary(thoughSVDshouldproduceverysimilaranswers).The de-greeof1D-connectivitymightbeestimatedbylinearmethodslike Pearsoncorrelationcoefficient,orSpearmanrankcorrelation(e.g. ifdatadistributioncontainsoutliers)ornonlinearmethodslike mu-tualinformationor(e.g.forEEG/MEG)time-laggedmeasureslike theimaginarypartofcoherency, imaginarypartofphase-locking value,laggedcoherenceorphaselagindices(Marzettietal.,2019). However,homogeneousROIsarerarelyguaranteed,andexamining thesingularvaluesofaSVDcanhelpgiveanideaofhomogeneity.8 2 IfyouareconfidentthataROIcanbeconsideredasone-dimensional, butvariationalongthatdimensionmightbecapturedbetterbysome voxelsthanothers(e.g.owingtodifferingnoiselevels)oreven ex-presseddifferently acrossvoxels(e.g.somemaybeactivated and somedeactivated),thenconsiderapplying1D-connectivitymeasures basedonSVDratherthanthosebasedonthemeanacrossvoxels. Al-ternatively,ifyouthinkthattheconnectivitybetweenROIsis one-dimensional,butthateachROIcontainsalotofindependentnoise (whichwouldaffectaSVDperformedwithineachROI),then con-siderusingPearson-CCA(assumingthatthereisasufficientnumber oftimepoints/scans).
3 IfaROIcontainsmultipledimensionsofvariation(e.g.SVDdoesnot suggestasingledominantmode),thenconsideraMD-connectivity measure.ifyoudonotcareabouttheexplicitformofthemapping betweenROIsinfMRI, butwishtoallowfornonlinearaswell as linearmappings,thenconsiderdCor.dCordoesnotrequire cross-validationacrossrunsandappearsquiterobusttonoise.Notethat dCorisaspecialcaseofRCA;acasethatusesaEuclideanmeasure ofsimilarityplussomeextrastepstocentrethetimeseries. How-ever,becarefulaboutstructuredformsofnoise(noisethatis corre-latedacrossvoxels),whichcanreducethesensivityofdCor.Some 8 Ofcourse,homogeneityatthelevelofmeasurement(e.g.voxelsinfMRI) doesnotimplyfunctionalhomogeneityatfinerspatialscales:e.g.voxelscould averageovermanyfunctionallydifferentneuronalpopulations,effectively re-ducingamulti-dimensionalneuralspacetoonedimensionofdata.