THE ACCURACY OF BANKRUPTCY
PREDICTION MODELS: A COMPARATIVE
ANALYSIS OF MULTIVARIATE
DISCRIMINANT MODELS IN THE ITALIAN
CONTEXT
Salvatore Madonna, Prof.
Department of Economics and Management, University of Pisa, Italy
Greta Cestari, PhD
Department of Economics and Business Science, University of Cagliari, Italy
Abstract
This research is driven by the conclusions of Bellovary, Giacomino and Akers (2007), who stated at that time that future research, rather than aiming to develop new bankruptcy prediction models (to add to the considerable body) should focus more on the use of existing models. In this regard, we aimed to verify the accuracy of three bankruptcy prediction models, all based on multivariate discriminant analysis, in predicting the fate of firms operating in a different business context and all located in Emilia-Romagna region of Italy. The models tested were: Altman's Z'-score (1993), Alberici's Z-score (1975), and Bottani, Cipriani and Serao's discriminant function (2004). In particular, we conducted a two-phase analysis, the first to determine the capacity of the three models to predict the fate of firms known to have gone bankrupt between 2012 and 2014, and the second to distinguish between bankrupt and buoyant firms in a mixed sample from the same period. The analysis was performed according to ex-post reasoning, and the investigated models were tested on retrospective data pertaining to two
distinct samples of firms of known status. Specifically, the first sample comprised firms that already met the condition the models were designed to detect, i.e., bankruptcy, and the second comprised equal numbers of operational and failed firms. The models were applied to the annual financial statements pertaining to the last five years of activity of bankrupt firms, and the most recent five years of activity of the solvent firms. The predictive efficacy of each model was determined by comparing the results furnished by each model with the real world status of the investigated firms.
The results obtained were: 1) Altman's model, applied with a single cut-off, is well able to detect signs of failure and to discriminate between failing and flourishing firm, even if taken out of its original context and applied to in a heterogeneous sample of firms; 2) Altman's model appears to meet the demand for generalizability, and is therefore suitable for large-scale investigations.
Keywords: Corporate crisis, Bankruptcy prediction models, Multivariate
discriminant analysis, Predictive accuracy
1. Introduction
Although there is no universally accepted definition of business failure (Shepherd 2005; Pretorius 2009), much of the literature reports it as a dynamic phenomenon (Lorange and Nelson 1987; Weitzel and Jonsson 1989; D'Aveni 1989a; Chowdhury and Lang 1993; Probst and Raisch 2005; Sheppard and Chowdhury 2005; Barker and Duhaime 1997; Müller 1985; Giannessi 1960), in which several distinct phases (whose number will depend on the method of study employed) of growing severity (Müller 1985; Slatter and Lovett 1999; Guatri 1995; Sciarelli 1995; Cestari 2009) can be discerned. The stakeholders involved, whether internal or external, need to be able to detect the critical signs of failure early on, before a firm reaches the point of no return. Indeed, business failure is associated with losses, whether large or small, for the shareholders, banks, suppliers, public administration bodies, and many other involved parties (Warner 1977; Charalambous et al. 2000; Charitou et al. 2004). These stakeholders should therefore be able to determine not only if a business will fail, but also, and especially, when (Sandin and Porporato 2007).
For this reason it is necessary for research to shift its focus from diagnosing failure in the present to predicting it in the future. Indeed, the
ability to predict the conditions of future operativity of a firm, rather than merely assess those in the present, confers evident and undisputed benefits. Above all, it will provide the internal or external analyst, and therefore the relevant decision-makers, with sufficient time to make the necessary decisions and take the necessary action.
Hence a tool or tools able to reliably detect signs of business failure early on would be invaluable to all stakeholders. This consideration led, in the 1930's, to a series of studies designed to test the reliability of fiscal markers in terms of highlighting, distinguishing, and predicting crises (Smith 1930; FitzPatrick 1932; Ramser and Foster 1931; Smith and Winakor 1935; Wall 1936), and their efforts laid the foundations for the development of bankruptcy prediction models in the 1960s. Those models relied, and still do today, on the integration of opportune 1) statistical or engineering techniques, and 2) measurable and non-measurable indicators.
Although initially developed to support decisions regarding lending, i.e., for the banks, over time such predictive models have found other applications (Altman and Sametz 1977; Altman and Hotchkiss 2010; Forestieri 1986; Rossi 1988; Teodori 1989), particularly in small and large scale investigations. Lenders, investors, security analysts, receivable accounts management, creditors, auditors, bond raters, strategy consultants and government agencies can all make use of such models for their own ends, applying them to varying sizes of groups of firms. Internal management can also make use of such tools to monitor the performance of their own firm, in support of internal audits and/or to guide the turnaround process (Altman and La Fleur 1985).
Today, there are many predictive models of various different types available. The bankruptcy prediction models developed since 1965 were compared by Bellovary, Giacomino and Akers (2007), who found more than 150. Although they reported that many of these displayed good predictive capacity, researchers continue to focus on developing new models in their search for predictive perfection. This runs counter to Bellovary et al.'s conclusion, namely that future research should be directed at the effective use of existing models rather than the search for new ones.
If the aim of future research is to explore the usability of existing models, the first step is to assess their reliability. It has been demonstrated that the accuracy of such models tends to diminish when they are applied to firms of different characteristics (size, sector, type, legal status, area of operation,
etc.) than those originally provided for in their development. The same consideration can be made if such models are applied in different time-frames to the test case (Grice and Dugan 2001; Grice and Ingram 2001; Wu et al. 2010).
However, only if a model can be applied in any context, regardless of time-frame, geographical area, sector and other features, can it be considered fit for purpose and useable by stakeholders in the real world. This is particularly true when considering large-scale investigations; lenders, investors, auditors and public administration bodies all often find themselves having to assess the operational status of several different types of firm. In such cases, the need to resort to several different tools to assess the status of several different types of firm represents a considerable burden (both financial and temporal) for the user. Although over-specialization tends to affect the usability of prediction models (Madonna and Cestari 2012; Cestari et al. 2013), studies have shown that they are less reliable when applied to samples that differ from the original. Hence real world stakeholders are faced with a kind of trade-off between reliability and usability i.e., the benefits of applying several specialist models vs. the inconvenience and the costs they entail.
It is therefore essential to evaluate the usability of existing models in terms of their relative reliability when applied to firms of different sizes, types and sectors, etc. Hence we set out verify the accuracy of three multivariate discriminant analysis based prediction models in diagnosing the 'health' of firms operating in the Emilia-Romagna region of northern Italy. In order to test the generalizability of the models, test sample firms were selected without consideration for their individual characteristics.
After a brief review of the literature (Section 2), we go on to outline the research hypothesis, scope and aims (Section 3) of the study. We then detail the methods and research phases used (Section 4), reporting the results (Sections 5 and 6) and conclusions (Section 7) of the research below.
2. Literature review
From the first studies by Beaver (1966) and Altman (1968), many bankruptcy prediction models have been proposed (Scott 1981; Altman et al. 1981; Zavgren 1983; Altman 1984; Jones 1987; Altman and Narayanan 1997; Poddighe and Madonna 2006; Bellovary et al. 2007; Pencarelli 2013). Other researchers in this area have concentrated on refining the technical
aspects of such tools, aiming to maximize their predictive accuracy. Some have focussed on the composition of the sample to be analysed, both in terms of quality (Taffler 1982; Gilbert et al. 1990) and quantity (Altman et al. 1981; Zmijewski 1984), while others have concentrated on the number (Altman 1988; Teodori 1989) and nature (Edmister 1972; Tennyson et al. 1980; Peel et al. 1985; D'Aveni 1989b) of the indicators included in the model, as well as the importance (Eisenbeis 1977) and degree of correlation (Altman 1988) of the independent variables.
From the very first models, considerable research effort has been expended to determine which statistical methods to adopt. Early studies focused on the traditional techniques of univariate discriminant analysis (Beaver 1966; Ruozi 1974) and multiple discriminant analysis (Altman 1968; Altman et al. 1977), as well as Bayesian analysis (Forestieri 1986), principal components analysis (Cascioli and Provasoli 1986), and the logit analysis (Martin 1977; West 1985; Platt and Platt 1991). More recently, attention has been focussed on innovative methodologies such as recursive partitioning (Frydman et al. 1985; Pompe and Feelders 1997), neural networks (Altman et al. 1994; Yang et al. 1999) and genetic algorithms (Kingdon and Feldman 1995; Varetto 1998; Shin and Lee 2002).
Despite this significant evolution, multivariate discriminant analysis continues to play an important role in bankruptcy prediction models. In fact, this technique, aside from being the first and the most used (Brédart 2014) in the development of prediction models, has been shown to offer the greatest degree of accuracy (Bellovary et al. 2007), generating simple models that are easy to comprehend by the user (Altman and La Fleur 1985). Multivariate discriminant models are configured as an equation, of first or second degree, composed of a variable number of appropriately weighted independent variables. These variables are chosen according to the phenomenon to be monitored, in this case business failure. The discriminant function has the aim of separating, with the minimum possible degree of error, firms into two distinct groups, namely 'healthy' and 'ailing' firms. This technique is based on the assumptions that failing firms display particular features (fiscal or otherwise) that set them apart from their flourishing counterparts, and that the model will be able to detect such signs.
On the international scene, many such models have been developed, and there has been a profusion of studies aimed at increasing their accuracy, many based on Altman's Z-score (1968). This research activity was not
confined to the United States, and researchers from many other parts of the world have endeavoured to develop more reliable models suitable for firms operating in their specific financial markets, with a view to improving their performance. In Italy in particular, Alberici (1975), sought to replicate Altman's study in the Italian context; this was followed by Appetiti (1984), Mantoan and Mantovan (1987), Bozzolan (1992), Luerti (1993), and, more recently, Bottani, Cipriani and Serao (2004). In their development of new models, many based on multivariate discriminant analysis, these researchers have attempted to imbue them with the capacity to detect the peculiarities of the Italian market, thereby rendering them more reliable than those developed overseas. However, it is our contention that a model applicable to the wider context would be more helpful and convenient for stakeholders charged with bankruptcy prediction.
3. Research aims
This investigation was set up to verify the diagnostic reliability of three
well-known bankruptcy prediction models in determining the operational state of firms in the Emilia-Romagna region of Italy.
The models tested, all based on multivariate discriminant analysis, were: Altman's Z'-score (Altman 1993), Alberici's Z-score (Alberici 1975), and Bottani, Cipriani and Serao's discriminant function (Bottani et al. 2004). Altman's Z'-score is the version of his earlier Z-score (Altman 1968) developed for privately owned companies. The original Z-score is generally regarded as the gold standard for diagnosing early signs of insolvency. Alberici's Z-score, on the other hand, was the first model to be designed specifically for detecting such problems in firms operating in the Italian economic context. Altman's Z-score was later modified by Bottani, Cipriani and Serao to produce their discriminant function, also specifically designed for use in the Italian context.
In order to test the reliability of the above three models, two phases of analysis were performed:
1. the first to verify their reliability in detecting signs of insolvency in a sample of firms that had gone bankrupt (Phase 1).
2. the second to test their efficacy in correctly diagnosing the financial state of firms in a mixed sample of 'healthy' and 'ailing' firms' (Phase 2).
Phase 1 was performed, in essence, in order to determine the ability of the tests to detect the typical warning signs of insolvency, and therefore fulfil the purpose for which they were intended, namely the early and reliable prediction of bankruptcy. Phase 2, on the other hand, was set up to test the ability of each tool to discriminate between struggling and buoyant firms, the self-declared aim of discriminant analysis, and with what degree of error.
The underlying aim of this two-phase analysis was to determine whether these instruments, in their basic form, are efficacious means of predicting the fate of firms in the Emilia-Romagna region of Italy. By "efficacious" we refer to both their diagnostic accuracy (correctness of prediction) and their timeliness (early warning). Indeed, such diagnostic tools can only be considered fit for purpose if they provide the analyst with reliable information as to the state of the firm before the event. Although we aimed to test the models on firms operating in a specific economic setting (Emilia-Romagna), we decided to focus on only their original or "basic" incarnations, unadulterated by adaptations for specific contexts. Thus, we aimed to determine whether these existing econometric models, applied in their 'pure' state, are able to predict bankruptcy in firms operating in a context different from that for which they were intended. Indeed, only in this way can we envisage the general application of such diagnostic tools in many economic contexts, irrespective of the individual characteristics of the firms under investigation.
Our research hypotheses were as follows:
H1: Being developed specifically for the Italian market, Italian models are more efficacious at predicting bankruptcy in Italian firms.
H2: Being developed specifically for the Italian market, Italian models are more efficacious in distinguishing between failing and flourishing samples.
4. Method and phases of the research
The analysis was performed according to ex-post reasoning (Altman1988; Rossi 1988; Teodori 1989), and the investigated models were tested on retrospective data pertaining to two distinct samples of firms of known status. Specifically, the first sample (Phase 1) comprised firms that already met the condition the models were designed to detect, i.e., bankruptcy, and the second (Phase 2) comprised equal numbers of operational and failed firms.
The models were applied to the annual financial statements pertaining to the last five years of activity of bankrupt firms, and the most recent five years of activity of the solvent firms. The scores yielded by the application of each model were then subjected to the cut-off point and/or grey area thresholds provided. In theory, application of a single cut-off point creates an either/or situation, dictating whether a firm will, or will not, go bankrupt. Grey area thresholds, on the other hand, create an intermediate group of indeterminate status, whose fate is classed as uncertain.
The predictive efficacy of each model was then determined by comparing the results furnished by each model with the real world status of the investigated firms. The classification furnished by the model (solvent, insolvent or uncertain) was considered correct in cases where it corresponded to the real world status of the firm (still operational or bankrupt), and incorrect, i.e., unreliable, in cases where it failed to do so.
Practically speaking, the research was conducted in six steps. First, the samples were selected (Step 1) from the Bureau Van Dijk AIDA database, a comprehensive list of Italian firms and their particulars. As mentioned above, two samples were tested in two distinct phases of analysis. The sample of bankrupt firms to be used in Phase 1 was selected according to the following criteria:
• type of firm: joint-stock company (S.p.A.), limited partnership (S.a.p.a), or limited liability company (S.r.l.);
• geographical area: Emilia-Romagna region; • legal status: bankrupt;
• period of bankruptcy: years 2012, 2013 or 2014.
This search yielded a total of 337 eligible firms, which were then further screened to exclude 'anomalous' firms, i.e., those which had ceased to exist for reasons other than bankruptcy (mergers, splits, transformations, etc.); those for which financial statements for the five years preceding the bankruptcy were not available; irregularities in the published accounts; and so on. This screening furnished a total of 323 bankrupt firms whose data would be subjected to the three models tested in Phase 1.
100 of these bankrupt firms were selected at random for the 'bankrupt' half of the sample used in Phase 2, which also comprised 100 firms randomly selected from among the above categories of companies listed on the AIDA database as active in the Emilia-Romagna region in 2014. The assets and main financial and economic indices of these firms were assessed
a priori to ensure that they were, in fact, in good financial health. Hence the
sample to which the models were applied in Phase 2 comprised 100 'healthy' and 100 'ailing' firms of the same types and economic context (geographical area, period of operation/bankruptcy).
It is important to mention that no attempts were made during the sample selection to adjust for the peculiarities of firms with respect to the samples used when the models were originally tested (Figure 1) – once again, the idea was to assess the reliability of the basic forms of the models to predict the status of firms in the wider, general context. Indeed, although such adjustments may improve the efficacy of a particular prediction tool, they considerably narrow its focus, rendering it unusable for anything outside that specific setting, and undermining its applicability on the wider scale.
Fig. 1 – The features of the samples tested: Emilia-Romagna firms (our sample), Altman's Z'-score, Alberici's model, and Bottani, Cipriani and Serao's model.
Sample features Emilia-Romagna firms (our sample) Altman's Z'-score Alberici's model Bottani, Cipriani and Serao's model
Type of firm • Non-specific • Manufacturing • Industrial • Manufacturing
Size • Non-specific • Large
businesses • Small, medium and large businesses • Small and medium-sized businesses
Legal status • Bankrupt • Bankrupt • Bankrupt • Bankrupt
Year of
bankruptcy • 2012–2014 • 1946–1965 • 1962–1972 • 2002
Listing in regulated markets
• Not listed • Not listed • Not listed • Not listed
The second stage of the investigation (Step 2) was to collect the financial statements pertaining to the five final years of operation of the bankrupt firms. Specifically, these were:
• Firms declared bankrupt in 2014: financial statements for the years 2009–2013
• Firms declared bankrupt in 2013: financial statements for the years 2008–2012
• Firms declared bankrupt in 2012: financial statements for the years 2007–2011
The financial statements for the most recent 5-year period of operation were analysed for the firms in the Phase 2 sample.
After reclassification of financial statements (Step 3) to ensure the homogeneity of the accounts of all the samples included, the indices considered in each econometric model were calculated for each firm in each sample (Step 4). The three prediction models were then applied to these figures (Step 5), and scores calculated for each firm. These scores were then compared with the respective cut-off points or grey areas provided for each tool to determine the reliability of each (Step 6).
5. Results of the first analysis: reliability of bankruptcy prediction
As mentioned above, Phase 1 of the analysis was aimed at verifying the ability of the three models to early detect signs of insolvency and therefore to accurately predict bankruptcy in a sample of 323 limited companies from the Emilia-Romagna region declared bankrupt in the years 2012–2014.
5.1. Altman's model
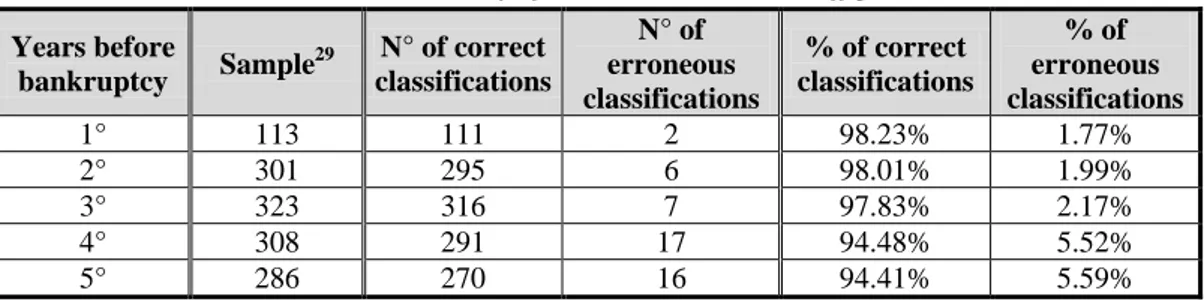
The efficacy of Altman's Z'-score was tested twice. First the sample was classified by comparing the scores obtained using one cut-off point, and then again considering the grey area threshold parameters. This two-step procedure was necessary, as the two types of comparison yielded two sets of results that can be interpreted in different ways, as outlined below. Comparison of the scores with the single discriminant function cut-off enabled the sample firms to be allocated to one of two groups: solvent (incorrect classification) or insolvent (correct classification), as shown in Table I.
Table 1 – Reliability of Altman's Z-score: cut-off point.
Years before bankruptcy Sample 29 N° of correct classifications N° of erroneous classifications % of correct classifications % of erroneous classifications 1° 113 111 2 98.23% 1.77% 2° 301 295 6 98.01% 1.99% 3° 323 316 7 97.83% 2.17% 4° 308 291 17 94.48% 5.52% 5° 286 270 16 94.41% 5.59% 29
The number of observations on the sample varied across the period of analysis as for various reasons (firm operational for fewer than five years; missed filing of accounts, etc.) financial statements for all five years preceding the declaration of bankruptcy were not available for some companies.
Table 1 evidences the excellent reliability of this model, which correctly classified over 94% of the sample over the 5-year period, reaching 98% in the two years preceding bankruptcy. The slight dip in prediction accuracy in the fourth and fifth years should be considered normal, as the symptoms of insolvency are indeed less evident the further back in time the model is applied, and therefore the outcome is more difficult to predict via econometric testing.
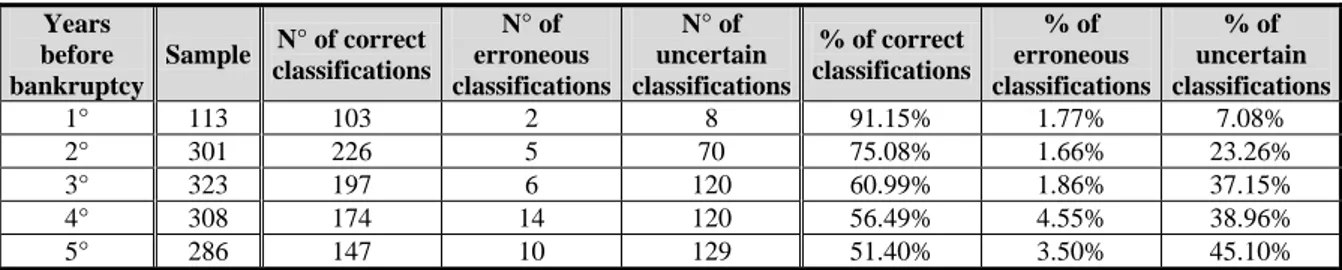
Comparison of the annual Altman scores with the grey area threshold values enabled the sample to be divided into three categories: solvent, insolvent, and uncertain. As shown in Table 2, which summarises the results, reporting the correct (1), incorrect (2) and uncertain (3) scores as both absolutes and percentages, the Z'-score is able to correctly classify 91.15% of the sample firms in the year preceding bankruptcy.
However, the accuracy of this prediction progressively decreases over the 5-year period, falling to 75.08% in the third year before bankruptcy, and 51.40% in the fifth. Statistically speaking, therefore, this application of the model does not appear to be particularly useful. However, considering the percentage total error does enable the diagnostic reliability of Altman's model to be judged in a positive light. Indeed, introduction of a 'grey' or uncertain range by definition limits the possibility of incorrect classification. Nevertheless, the effect of this limitation is moderate, as can be seen from the comparison reported in the respective columns in Tables 1 and 2, namely that the percentage of error measured in the cut-off method ranged between 1.77% and 5.59%, as compared to a range of 1.77% to 4.55% when a grey area was included.
Table 2 – Reliability of Altman's Z-score: grey area.
Years before bankruptcy Sample N° of correct classifications N° of erroneous classifications N° of uncertain classifications % of correct classifications % of erroneous classifications % of uncertain classifications 1° 113 103 2 8 91.15% 1.77% 7.08% 2° 301 226 5 70 75.08% 1.66% 23.26% 3° 323 197 6 120 60.99% 1.86% 37.15% 4° 308 174 14 120 56.49% 4.55% 38.96% 5° 286 147 10 129 51.40% 3.50% 45.10%
That being said, the 'uncertain' class of firms cannot be neglected from any reliability assessment. Indeed, the number of grey area firms was as high as 23.26% of the total sample in the second year preceding bankruptcy. Practically speaking, this means that the grey area application of the model
could not predict the fate (its stated function) of over a fifth of firms, even two years before bankruptcy. Obviously, this cannot be considered a positive sign, as specific, and generally time-consuming, procedures would be needed to separate the 'healthy' from the 'ailing' firms. Hence this application of the model is unhelpful as a bankruptcy prediction tool, as it fails to provide accurate information on the status of a large number of the firms to which it is applied.
5.2. Alberici's model
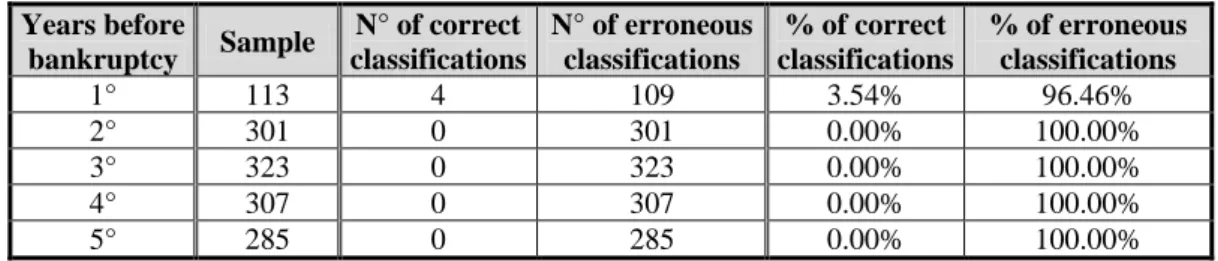
The reliability of Alberici's model was only tested by applying a single cut-off point to the scores obtained, as no grey-area thresholds are provided.
Table 3 – Reliability of Alberici's model: cut-off point.
Years before bankruptcy Sample N° of correct classifications N° of erroneous classifications % of correct classifications % of erroneous classifications 1° 113 4 109 3.54% 96.46% 2° 301 0 301 0.00% 100.00% 3° 323 0 323 0.00% 100.00% 4° 307 0 307 0.00% 100.00% 5° 285 0 285 0.00% 100.00%
As shown in Table 3, Alberici's discriminant function was clearly unable to detect the signs of impending bankruptcy in our sample, incorrectly classifying 100% of firms in the fifth to second years preceding bankruptcy, and only correctly classifying 4 firms, a total of 3.54%, based on the data for the year preceding the event. These results clearly (and statistically) show that the model in fact possesses no discriminatory properties, and is unable to predict bankruptcy in firms whose baseline characteristics differ from those used in the original sample to which it was subjected. It is therefore unsuitable for the wider context and cannot be considered as a diagnostic/prediction model, rather a simple combination of indices describing a specific sample of firms analysed within an equally specific time-frame.
5.3. Bottani, Cipriani and Serao's model
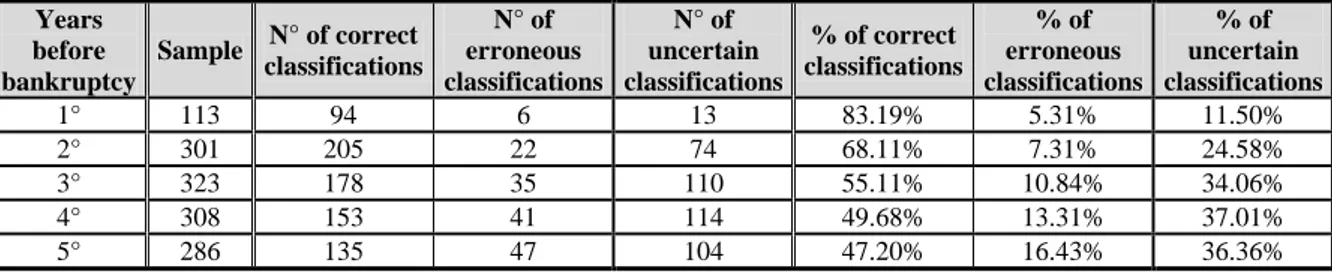
As Bottani, Cipriani and Serao only provided grey area threshold values for their model and not a single cut-off point, on the basis of the scores recorded for our sample we were able to classify firms as solvent, insolvent or uncertain.
As shown by the figures reported in Table 4, this model is a satisfactory means of predicting bankruptcy from the data pertaining to the year immediately preceding the event, correctly judging the status of 94 firms, 83.19% of the sample considered. Nevertheless, the further back in time from the event, the less reliable the test, and a significant loss of accuracy, more than 15%, was detected in the second period examined, 2 years prior to bankruptcy; only 49.68% and 47.20% of its predictions were considered accurate in the fourth and fifth years preceding bankruptcy, respectively, both of moderate statistical significance. Hence this model is unable to predict with any great degree of certainty the operational conditions of firms on the verge of insolvency, and, at an accuracy rate of one in two, appears unsuitable for use as a diagnostic tool in the wider context.
Table 4 – Reliability of Bottani, Cipriani and Serao's model: grey area.
Years before bankruptcy Sample N° of correct classifications N° of erroneous classifications N° of uncertain classifications % of correct classifications % of erroneous classifications % of uncertain classifications 1° 113 94 6 13 83.19% 5.31% 11.50% 2° 301 205 22 74 68.11% 7.31% 24.58% 3° 323 178 35 110 55.11% 10.84% 34.06% 4° 308 153 41 114 49.68% 13.31% 37.01% 5° 286 135 47 104 47.20% 16.43% 36.36%
As with Altman's model, however, we cannot merely consider the correct predictions when assessing the success rate of the tool, and we must also take into account those judged incorrectly or as uncertain. Although there were a relatively limited number of the former category in the two years directly preceding bankruptcy, the error rate increased progressively from the third year to the fifth, from 10.84% to 16.43%, respectively. Although the grey area was introduced to limit the number of diagnostic errors furnished by such models, in this case it does not appear to have been particularly effective. In fact, in the fifth year preceding bankruptcy, it diagnosed one out of six bankrupt firms as "healthy".
As mentioned previously, to some extent the 'uncertain' values also affect the reliability of the tool, and in this case, as in Altman's, the numbers of firms that could not be classified as either solvent or insolvent were fairly high. In fact, from a relatively successful first year, in which one out of ten firms was judged to be of uncertain fate, this rose progressively to one in three in the fourth year preceding bankruptcy.
6. Results of the second analysis: evaluation of discriminatory capacity
The aim of the analysis performed in Phase 2 was to determine the degree of efficacy of each of the investigated tool in correctly diagnosing the state, and therefore predict the fate, of a sample comprising equal numbers of 'healthy' firms and those destined for bankruptcy. As Alberici's model proved unfit for purpose in the first phase of the investigation, we limited ourselves to examining 1) Altman's and 2) Bottani, Cipriani and Serao's models in this phase of the analysis.
In order to judge the discriminatory capacity of the investigated models, we evaluated not only 1) the total accuracy, i.e., the predictive efficacy across the entire sample, but also 2) the specific accuracy, i.e., the predictive efficacy within the operational and bankrupt groups, respectively, and 3) the
type of error encountered. The investigation schematic adhered to is
illustrated in Figure 2.
Fig. 2 – Assessment procedure adopted in Phase 2
6.1. Altman's model
For Altman's model, the scores were first compared against a cut-off point, and then the grey area threshold values. Considering a single cut-off
point, the total prediction accuracy of the Z'-scores across the whole sample
for the year immediately preceding bankruptcy was 94.50% (see Table 5). This fell, but only slightly, to 91.50% in the second year, and from then on fell progressively to the fifth year, in which the Altman model correctly classified 74.21% of the sample. Despite this expected, and to all intents and purposes normal, discrepancy, the tool displays a significant discriminatory capacity.
Table 5 – Total accuracy of Altman's model: cut-off point. Years before bankruptcy Sample 30 N° of correct classifications N° of erroneous classifications % of correct classifications % of erroneous classifications 1° 200 189 11 94.50% 5.50% 2° 200 183 17 91.50% 8.50% 3° 200 168 32 84.00% 16.00% 4° 198 154 44 77.78% 22.22% 5° 190 141 49 74.21% 25.79%
Examining the specific accuracy of this model in distinguishing between buoyant and failing companies, i.e., looking at the results for each subgroup within the sample, enables us to prevent the success in qualifying the status of one subgroup from compensating, to any degree of significance, for errors in classifying the other, and thereby affecting the overall judgement of its reliability.
As shown in Table 6, in the three years preceding bankruptcy, the Z'-score is able to accurately classify almost all of the failing firms, with success rates of between 98% and 99%. This diminished progressively over time, and in the fourth year the minimum percentage of correct classification was 94.95%. In the flourishing firms, however, the reliability of the model was lower, varying from 10% success in the first year to 47.37 in the fifth, at which time, therefore, this approach is only able to accurately diagnose the status of one 'healthy' firm out of two.
Table 6 – Specific accuracy of Altman's model: cut-off point.
Years before bankruptcy Sample Healthy firms N° of correct classifications N° of erroneous classifications
(II type errors)
% of correct classifications
% of erroneous classifications
(II type errors)
1° 200 90 10 90.00% 10.00% 2° 200 85 15 85.00% 15.00% 3° 200 69 31 69.00% 31.00% 4° 198 60 39 60.61% 39.39% 5° 190 50 45 52.63% 47.37% 30
The reduction in number of the sample analysed in the fourth and fifth years before bankruptcy is due to the lack, in some cases, of financial statements pertaining to those financial years. To homogenize/compare the samples, for the above mentioned years a corresponding number of randomly selected firms was eliminated from the ‘healthy’ comparison group.
Years before bankruptcy Sample Bankrupt firms N° of correct classifications N° of erroneous classifications (I type errors) % of correct classifications % of erroneous classifications (I type errors) 1° 200 99 1 99.00% 1.00% 2° 200 98 2 98.00% 2.00% 3° 200 99 1 99.00% 1.00% 4° 198 94 5 94.95% 5.05% 5° 190 91 4 95.79% 4.21%
In order to complete the analysis, we set out to determine the type of
error encountered when using the Z'-score with a single cut-off. Two types
of error were identified: type 1 (false negatives), i.e., a firm in trouble classed as solvent, and type 2 (false positives), i.e., a buoyant firm classified as heading for bankruptcy. The real-world impact of these types of error differ, and therefore cannot be overlooked. Indeed, as reported in the literature (Altman 1984), type 1 errors are more costly than type 2, and this needs to be taken into consideration when evaluating the performance of a financial predictor. Indeed, it is not the number of errors (whether expressed as an absolute or percentage) that counts, rather the financial burden they entail (Lace and Koleda 2008; Madonna and Cestari 2012; Cestari et al. 2013).
As shown in Table 6, this approach yielded a greater number of type 2 than type 1 errors, which were only revealed in 1 to 2% of cases in the three years directly preceding bankruptcy. False negatives, on the other hand, increase progressively over time, although levels remain low. The same level of precision could not be reported for the solvent firms, with 10 to 45 firms' scores being subject to type 2 errors. As mentioned, however, despite the statistical significance of these results, this type of error is less burdensome, and therefore reflects well on the overall reliability of the model.
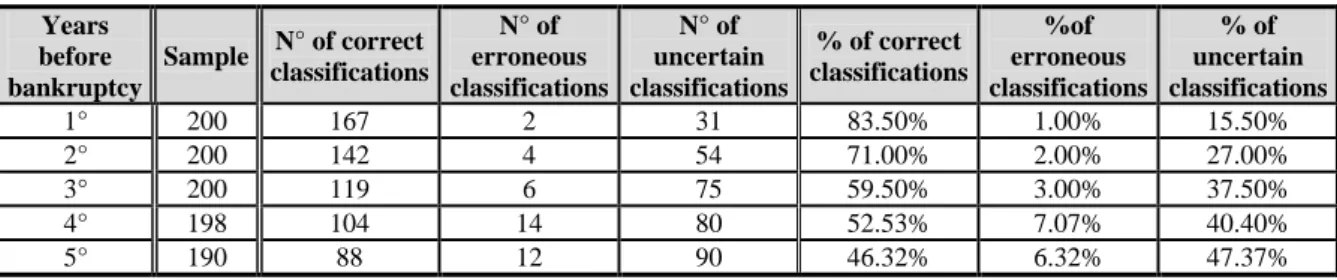
Considering the results of the grey area approach (Table 7), the total
accuracy of the Altman model tended to be lower than that obtained using
the cut-off method. Compare the 94.5% obtained by the former for the first year (Table 6) with the 83.50% obtained here (Table 7). The discrepancy between the two sets of results is even more apparent when we consider the fifth year data, which yielded 74.21% for the cut-off approach and only 46.32% when the grey-area thresholds were applied.
Table 7 – Total accuracy of Altman's model: grey area. Years before bankruptcy Sample N° of correct classifications N° of erroneous classifications N° of uncertain classifications % of correct classifications %of erroneous classifications % of uncertain classifications 1° 200 167 2 31 83.50% 1.00% 15.50% 2° 200 142 4 54 71.00% 2.00% 27.00% 3° 200 119 6 75 59.50% 3.00% 37.50% 4° 198 104 14 80 52.53% 7.07% 40.40% 5° 190 88 12 90 46.32% 6.32% 47.37%
The overall reliability is conditioned not only by the erroneous predictions, which were considerably less numerous with respect to the cut-off approach (1% vs. 7.07%), but also the numerous uncertain classifications (from 15.50% to 47.37% in the sample examined). In practical terms, while the 'uncertain' group did contain some of the firms erroneously classified using the cut-off approach, thereby seemingly improving its reliability, it also contained a significant number of firms whose fate it accurately predicted.
Table 8 shows the results for the specific accuracy of the Z'-score model. As with the cut-off method, the grey-area approach is more efficacious at diagnosing failing (91% accuracy) than flourishing (76% accuracy) firms in the first year examined. As we go further back in time, we can see that 1) the relative success rates for the solvent and insolvent firms tend to come into line, but 2) they both significantly diminish over time. Indeed, by the fourth year, the reliability of this application of the model is severely compromised, with performance values close to 50%, and in the fifth year the fate of fewer than one in two firms is predicted accurately.
Table 8 – Specific accuracy of Altman's model: grey area.
Years before bankruptcy Sample Healthy firms N° of correct classifications N° of erroneous classifications (II type errors) N° of uncertain classifications % of correct classifications %of erroneous classifications (II type errors) % of uncertain classifications 1° 200 76 1 23 76.00% 1.00% 23.00% 2° 200 70 2 28 70.00% 2.00% 28.00% 3° 200 59 5 36 59.00% 5.00% 36.00% 4° 198 53 11 35 53.54% 11.11% 35.35% 5° 190 45 10 40 47.37% 10.53% 42.11% Years before bankruptcy Sample Bankrupt firms N° of correct classifications N° of erroneous classifications (I type errors) N° of uncertain classifications % of correct classifications %of erroneous classifications (I type errors) % of uncertain classifications
1° 200 91 1 8 91.00% 1.00% 8.00%
2° 200 72 2 26 72.00% 2.00% 26.00%
3° 200 60 1 39 60.00% 1.00% 39.00%
4° 198 51 3 45 51.52% 3.03% 45.45%
5° 190 43 2 50 45.26% 2.11% 52.63%
Regarding the type of error, in the first two annual datasets analysed, the Altman method yields the same number of false negatives and false positives. In the third to fifth years, however, there is a growing gap between the two. In detail, in the third year examined, the difference between the two is still fairly moderate, with the Z'-score erroneously classifying 5% of the 'healthy' firms (type 2 error) and 1% of the struggling firms (type 1). In the fourth year, the model yields 3.03% false negatives and 11.11% false positives – figures similar to those seen in the fifth year, which are, however, slightly lower. Once again, the cost of each type of error must be taken into account, and we can see that this model tends to furnish the less costly type of error.
That being said, the grey area approach does furnish a substantial number of firms classed as uncertain, which also represent a further burden, both financial and in terms of time. Indeed, in order to obtain a more definite classification, other analytical tools will need to be employed, rendering the grey-area application of the Altman model inefficacious and, therefore, unfit for purpose in this scenario.
6.2. Bottani, Cipriani and Serao's model
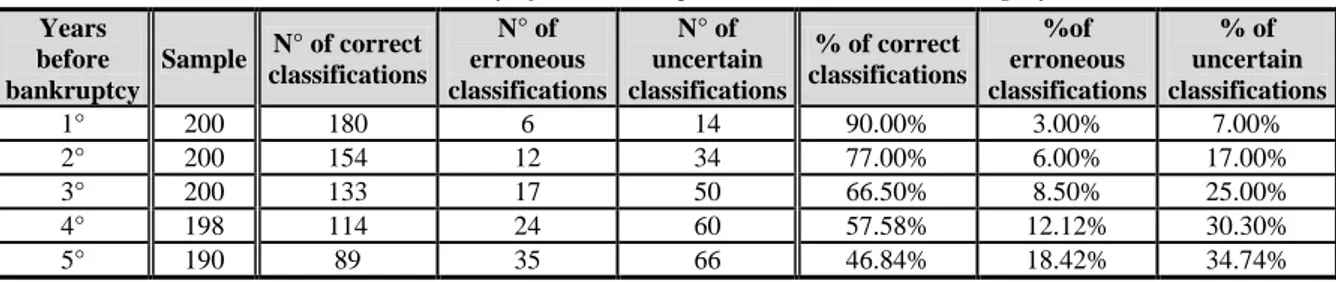
As regards the total accuracy (Table 9), in the first year preceding bankruptcy, the Bottani, Cipriani and Serao model correctly predicted the fate of 90% of the sample, considered as a whole. This performance appreciably diminished the further back in time the data analysed, and in the fifth year preceding bankruptcy fewer than 50% of firms were classified correctly. Clearly this model is therefore statistically inefficacious in the long term, although the total errors were also relatively few in the first years analysed, with percentages from 3% to 8.5%. Predictably, these also increased in the longer-term predictions, albeit to a relatively moderate degree (18.42%).
Table 9 – Total accuracy of Bottani, Cipriani and Serao's model: grey area. Years before bankruptcy Sample N° of correct classifications N° of erroneous classifications N° of uncertain classifications % of correct classifications %of erroneous classifications % of uncertain classifications 1° 200 180 6 14 90.00% 3.00% 7.00% 2° 200 154 12 34 77.00% 6.00% 17.00% 3° 200 133 17 50 66.50% 8.50% 25.00% 4° 198 114 24 60 57.58% 12.12% 30.30% 5° 190 89 35 66 46.84% 18.42% 34.74%
As previously mentioned, this model is accompanied by grey area thresholds, rather than a single cut-off, and, with the exception of the first year, a considerable portion of the sample fell into the 'uncertain' category. Indeed, even three years before bankruptcy, the model is unable to determine the operational conditions of one firm in four, a ratio that increases further when applied to the fourth and fifth year data.
The specific accuracy analysis (Table 10) shows that this model is better able to classify the 'healthy' firms. In the five years examined, the fate of more than 72% of the firms examined was predicted accurately, with particularly high accuracy values in the first (97%) and second (93%) year data. Considerably smaller success rates were seen in the bankrupt group, however. With the exception of the first year, in which the discriminant function displayed a satisfactory degree of accuracy, the number of errors were rather high, progressively increasing over time. In particular, in the very early years before bankruptcy, the diagnostic efficacy of the model was only just above 40%.
Analysing the type of error across the sample, and bearing in mind the attendant costs, we can see that once again the grey area method falls short of the desired result. Considering first the three years' data, as shown in Table 10, although the percentage error was fairly low, (6% in healthy firms and 11% in failing firms) the model furnished more false negatives, the more costly type, than false positives. Despite their increase in the fourth and fifth years, the ratio of type 1 and type 2 errors tended to level off slightly, reaching around 12% and 18%, respectively.
Table 10 – Specific accuracy of Bottani, Cipriani and Serao's model: grey area.
Years before bankruptc y Sampl e Healthy firms N° of correct classificatio ns N° of erroneous classificatio ns (II type errors) N° of uncertain classificatio ns % of correct classificatio ns %of erroneous classificatio ns (II type errors) % of uncertain classificatio ns
1° 200 97 1 2 97.00% 1.00% 2.00% 2° 200 93 2 5 93.00% 2.00% 5.00% 3° 200 80 6 14 80.00% 6.00% 14.00% 4° 198 72 12 15 80.00% 6.00% 14.00% 5° 190 50 17 28 72.73% 12.12% 15.15% Years before bankruptc y Sampl e Bankrupt firms N° of correct classificatio ns N° of erroneous classificatio ns (I type errors) N° of uncertain classificatio ns % of correct classificatio ns %of erroneous classificatio ns (I type errors) % of uncertain classificatio ns 1° 200 83 5 12 83.00% 5.00% 12.00% 2° 200 61 10 29 61.00% 10.00% 29.00% 3° 200 53 11 36 53.00% 11.00% 36.00% 4° 198 42 12 45 42.42% 12.12% 45.45% 5° 190 39 18 38 41.05% 18.95% 40.00%
Considering the uncertain predictions, these were relatively limited in the healthy firms, and did not exceed 28% in the five-year period investigated. However, the number of failing firms falling into the grey area will have a great influence on the financial implications of the model, and only two years before bankruptcy almost a third of firms fell into the 'uncertain' category. This increased significantly over time, and the tool was unable to predict the fate of roughly one in two bankrupt firms based on the fourth-year data. Hence, the number (and type) of errors and uncertain classifications make this model rather inefficacious at predicting the fate of struggling firms, and particularly costly when considering the necessity of resorting to further, more reliable analytical tools.
7. Discussion and conclusion
The three bankruptcy prediction models tested in this investigation, set up to verify their accuracy in predicting the fate of firms in the Emilia-Romagna region, although all based on multivariate discriminant analysis, were designed for application in specific business contexts. Our idea was to determine whether they are also applicable to other contexts, in this case those pertaining to the sample described above, and to what degree of reliability. The underlying aim was to verify whether the tested models may be able to meet the needs of stakeholders in the wider world.
In the first phase of the analysis, the capacity of the models to detect in advance the signs of failure in a sample of bankrupt firms was tested.
It would not be meaningful to rank the models that distinguish the status of firms via a single cut-off point (thereby categorizing firms as either
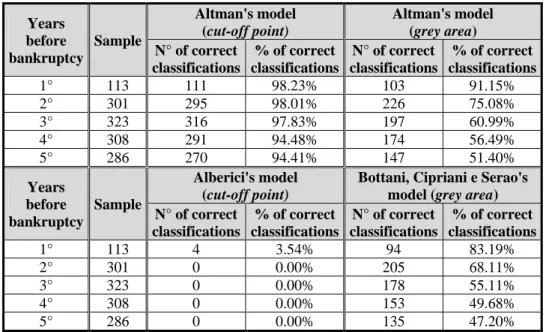
solvent or insolvent) against those that use a grey-area approach (thereby categorizing firms as solvent, insolvent or uncertain), as the latter yield a certain number of firms whose status cannot be determined – prediction failures to all intents and purposes. That being said, if we consider only the successful predictions resulting from a single cut-off (ignoring for the moment the incorrect and 'unsuccessful' results), the superiority of Altman's Z'-score in this regard, across the whole 5 years of data examined, is clear from Table 11.
Table 11 – Comparison of the relative performance of the models on the sample of bankrupt firms. Years before bankruptcy Sample Altman's model (cut-off point) Altman's model (grey area) N° of correct classifications % of correct classifications N° of correct classifications % of correct classifications 1° 113 111 98.23% 103 91.15% 2° 301 295 98.01% 226 75.08% 3° 323 316 97.83% 197 60.99% 4° 308 291 94.48% 174 56.49% 5° 286 270 94.41% 147 51.40% Years before bankruptcy Sample Alberici's model (cut-off point)
Bottani, Cipriani e Serao's model (grey area) N° of correct classifications % of correct classifications N° of correct classifications % of correct classifications 1° 113 4 3.54% 94 83.19% 2° 301 0 0.00% 205 68.11% 3° 323 0 0.00% 178 55.11% 4° 308 0 0.00% 153 49.68% 5° 286 0 0.00% 135 47.20%
The Altman model was also shown to be more reliable in predicting bankruptcy in our sample when the grey-area thresholds were applied, in this case with respect to the Bottani, Cipriani and Serao model, which employs the same discriminatory parameter.
Alberici's model was not applicable to our sample, predicting that all bankrupt firms would succeed, showing that this model is not generalizable. As it cannot be applied to spatial and temporal contexts other than those of its test case, Alberici's model is therefore little more than a descriptive function of its own sample. This enables us to refute the first hypothesis (H1), namely that the Italian model would be more suitable for predicting the fate of firms operating in an Italian context.
Having identified the most reliable tool in terms of diagnosing the status of known bankrupt firms, we then set out to test the discriminatory capacity of the models, in other words their overall ability to differentiate between failing and flourishing firms in a mixed sample. Having discarded the Alberici model on the basis of the findings from the first phase of the analysis, we looked at the Altman Z'-score method with cut-off applied, confirming its discriminatory reliability (Table 12).
Table 12 – Comparison the relative performance of the models in distinguishing bankrupt from buoyant firms31.
Years before bankruptcy Sample Altman's model (cut-off point) Altman's model (grey area)
Bottani, Cipriani e Serao's model (grey area) % of correct classifications % I type errors % II type errors % of correct classifications % I type errors % II type errors % of correct classifications % I type errors % II type errors 1° 200 94.50% 1.00% 10.00% 83.50% 1.00% 1.00% 90.00% 5.00% 1.00% 2° 200 91.50% 2.00% 15.00% 71.00% 2.00% 2.00% 77.00% 10.00% 2.00% 3° 200 83.50% 1.00% 31.00% 59.50% 1.00% 5.00% 66.50% 11.00% 6.00% 4° 198 78.00% 5.05% 39.39% 52.53% 3.03% 11.11% 57.58% 12.12% 6.00% 5° 190 73.00% 4.21% 47.37% 46.32% 1.00% 1.00% 46.84% 18.95% 12.12%
That being said, when the grey-area thresholds were applied, the overall accuracy of the Bottani, Cipriani and Serao model was greater than that of the Z'-score proposed by Altman. However, this ranking needs to be reassessed in light of the percentage of each type of error made by the two models. Indeed, the grey-area application of the Altman method generated fewer type 1 errors (the more costly type). Precisely speaking, analysing data from the three years preceding bankruptcy, both versions of the Z'-score (cut-off and grey area) provided the same number of false negatives. These methods diverged, however, when the models were applied to the data from the fourth and fifth years preceding bankruptcy, with the grey area furnishing more accurate results in the sample of bankrupt firms than the cut-off. This is in line with expected results, given that the grey area was introduced precisely in order to reduce the likelihood of classification errors. Despite this, Bottani, Cipriani and Serao's discriminant function, was not as successful as correctly classifying firms.
The grey-area Z'-score also displayed better performance than Bottani, Cipriani and Serao's discriminant function in terms of type-2 errors, although
31
The percentage of type 1 and 2 errors were calculated as follows: 1) n. type 1 errors/n. failed firms, and 2) n. type 2 errors/n. 'healthy' firms.
only slightly. Looking at this type of error, the cut-off Z'-score is the least efficacious of the three methods, with rather significant values in years 4 and 5. That being said, as we have already mentioned, false positives represent the least costly type of error, and thereby contribute favourably to the overall judgement of the reliability of the Altman cut-off method. In this case too, therefore, the starting hypothesis (H2), i.e., that Italian models would be better at predicting the status of Italian firms, must be rejected.
In brief, our findings show that Altman's model, applied with a single cut-off, is well able to detect signs of failure and to discriminate between failing and flourishing firm, even if taken out of its original context and applied to in a heterogeneous sample of firms. Although its favourable performance with respect to the grey area application (more 'certain' classifications), we show that this model appears to meet the abovementioned demand for generalizability, and is therefore suitable for large-scale investigations.
Acknowledgments
While this work has been a joint effort of the authors, the individual contributions can be identified as follows: paragraphs 2., 3. and 5.: Salvatore Madonna; paragraphs 1., 4., 6. and 7.: Greta Cestari.
References:
AltmanE.I.(1984). A further empirical investigation of the bankruptcy cost question. Journal of Finance, 39(4), 1067-1089.
Altman E.I. (1988). The prediction of corporate bankruptcy. A discriminant analysis, New York: Garland Publishing Inc..
AltmanE.I.,& HaldemanR.G. (1977). NarayananP. Zeta Analysis. A new model to identify bankruptcy risk of corporations. Journal of Banking and Finance, 1, 29-54.
Altman E.I., & Hotchkiss E. (2010). Corporate financial distress and bankruptcy: predict and avoid bankruptcy, analyze and invest in distressed debt. New York: John Wiley & Sons.
AltmanE.I.,&LaFleurJ.K. (1985). I modelli di previsione delle insolvenze: le loro applicazioni alla gestione d’impresa. Finanza, marketing e produzione, 4, 77-93.
Altman E.I., & Narayanan P. (2001). An international survey of business failure classification models. Financial Markets, Institutions & Instruments, 6(2), 1-57.
Altman E.I., & Sametz A.W. (1977). Financial crises: institutions and markets in a fragile environment. New York: John Whiley and Sons.
Altman E.I., Avery R.B., Eisenbeis R.A., & Sinkey J.F. Jr. (1981). Applications of classification techniques in business, banking and finance. Greenwich: Jai Press Inc..
Appetiti S., (1984). L’utilizzo dell’analisi discriminante per la previsione delle insolvenze: ipotesi e tesi per un’analisi dinamica. Temi di Discussione, Rome: Servizio Studi della Banca d’Italia.
Barker V.L. III, & Duhaime I.M. (1997). Strategic change in the turnaround process: theory and empirical evidence. Strategic Management Journal, 18(1),13-38.
Beaver H.W. (1966). Financial ratios as predictors of failure. Journal of Accounting Research, 4, 71-102.
Bellovary J.L., Giacomino D.E., & Akers M.D. (2007). A review of bankruptcy prediction studies: 1930 to present. Journal of financial education, 33 (Winter), 262-298.
Bottani P., Cipriani L., & Serao F. (2004). Il modello di analisi Z-Score applicato alle PMI. Amministrazione & finanza. 19(1), 50-53.
Bozzolan S. (1992). Un modello dinamico per l’analisi e la previsione delle insolvenze aziendali. Analisi finanziaria, 7, 71-99.
Brédart X. (2014). Bankruptcy prediction model: the case of the United States. International Journal of Economics and Finance, doi: 10.5539/ijef.v6n3p1.
CascioliE.,&ProvasoliA. (1986). La previsione delle insolvenze aziendali, un metodo quantitativo. In M. Cattaneo, F. Cesarini, A. Provasoli, B. Quatraro (Ed), Crisi di Impresa e Amministrazione Controllata, Milan: Giuffrè.
Cestari G. (2009). La diagnosi precoce della crisi aziendale. Analisi del processo patologico e modelli predittivi. Milan: Giuffré.
Cestari G., Risaliti G., & Pierotti M. (2013). Bankruptcy prediction models: preliminary thoughts on the determination of parameters for the evaluation of effectiveness and efficiency. European Scientific Journal, 9(16), 265-290.
Charalambous, C., Charitou, A., & Kaourou, F. (2000). Comparative analysis of artificial neural network models: application in bankruptcy prediction. Annals of Operations Research, 99(1-4), 403-425.
Charitou A., Neophytou E., & Charalambous C. (2004). Predicting corporate failure: empirical evidence for the UK. European Accounting Review, 13(3), 465-497.
Chowdhury S.D., & Lang, J.R. (1993). Crisis, decline and turnaround: a test of competing hypotheses for shortterm performance improvement in small firms. Journal of Small Business Management, 31(4), 8-17.
D’Aveni R.A. (1989a). The aftermath of organisational decline: a longitudinal study of the strategic and managerial characteristics of declining firms. Academy of Management Journal, 32(3), 577-608.
D’Aveni R. (1989b). Dependability and organizational bankruptcy. Management Science, September, 35(9),1120-1138.
EdmisterR.O. (1972). An empirical test of financial ratios analysis for small business failure prediction. Journal of Finance and Quantitative Analysis, 7(2), 1477-1493.
Eisenbeis R.A. (1977). Pitfalls in the application of discriminant analysis in Business, Finance and Economics. Journal of Finance, 32(3), 875-900.
FitzPatrick P.J. (1932). Symptoms of industrial failures as revealed by an analysis of the financial statements of failed companies, 1920-1929. Washington DC: The Catholic University of America.
ForestieriG. (1986). La previsione delle insolvenze aziendali. Profili teorici e analisi empiriche. Milan: Giuffrè.
Frydman H., Altman E.I., & Kao D. (1985). Introducing Recursive Partitioning for Financial Classification: The Case of Financial Distress. The Journal of Finance, 40(1), 269-291.
Giannessi E. (1960). Le aziende di produzione originaria. Psa: Colombo Cursi.
Gilbert L., Menon K., & Schwartz K. (1990). Predicting bankruptcy for firm in financial distress. Journal of Business Finance and Accounting, 17(1), 161-171.
Grice J.S., & Dugan M.T. (2001). The limitations of bankruptcy prediction models: some caution for the researcher. Review of Quantitative Finance and Accounting, 17 (2), 151-166.
Grice J.S., & Ingram R.W. (2001). Tests of the generalizability of Altman’s bankruptcy prediction model. Journal of Business Research, 54(1), 53-61.
GuatriL. (1995). Turnaround. Declino, crisi e ritorno al valore. Milan: Egea. Jones F.L. (1987). Current techniques in bankruptcy prediction. Journal of Accounting Literature, 6, 131-146.
Kingdon J., & Feldman K. (1995). Genetic Algorithms and applications to finance. Applied Mathematical Finance, 2(2), 89-116.
Lace N., Koleda N. (2008). Selecting the right tool for evaluating of solvency: the case of latvian enterprises. 5th International Scientific Conference Business and Management, Vilnius, Lithuania, 16-17.
Lorange P., & Nelson R.T. (1987). How to reorganize – and avoid – organizational decline. Sloan Management Review, 28(3), 41-46.
Luerti A. (1992), La previsione dello stato di insolvenza delle imprese. Il modello AL/93 di Credit Scoring elaborato in base alla IV Direttiva CEE, Milan: Etaslibri.
Madonna S., & Cestari G. (2012). Affidabilità ed efficienza dei modelli di previsione delle insolvenze nel contesto economico ferrarese. Riflessioni nella prospettiva dell’intervento pubblico a supporto della crisi aziendale. Rome: RIREA.
Mantoan M., & Mantovan P. (1987). Un modello di previsione del dissesto d’impresa. Rivista dei dottori commercialisti, n. 1-2, 135-159.
Martin D. (1977). Early warning of bank failure: a logit regression approach. Journal of Banking and Finance, 1(3), 249-276.
Müller R. (1985). Corporate Crisis Management. Long Range Planning, 18(5), 28-48.
PeelM.,PeelD.,&PopeP.(1985).Some evidence on corporate failure and the behaviour of non-financial ratios. The Investment Analyst, 75, 3-7. Pencarelli T. (2013), Le crisi d’impresa. Diagnosi, previsione e procedure di risanamento. Milan: Franco Angeli.
Platt H.D., & Platt M.B. (1991). A linear programming approach to bond portfolio selection. Economic Financial Computing, Spring, 71-84.
Poddighe F., & Madonna S. (2006). Modelli di previsione delle crisi aziendali: possibilità e limiti. Milan: Giuffrè.
Pompe P., & Feelders A. (1997). Using machine learning, neural networks, and statistics to predict corporate bankruptcy. Microcomputers in Civil Engineering, 12, 267-276.
Pretorius M. (2009). Defining business decline, failure and turnaround: a content analysis. South African Journal of Entrepreneurship and Small Business Management, 2(10), 1-16.
Probst G., & Raisch S. (2005). Organizational crisis: the logic of failure. Academy of Management Executive, 19(1), 90-105.
Ramser J.R., & Foster L.O. (1931). A Demonstration of Ratio Analysis. Bureau of Business Research, Bulletin nr. 40. Urbana: University of Illinois. Rossi C. (1988). Indicatori di bilancio, modelli di classificazionee previsione delle insolvenze aziendali. Milan: Giuffré.
RuoziR. (1974). Sull’attendibilità dei bilanci e sulla loro validità ai fini di previsione delle insolvenze. Bancaria, 1, 7-15.
Sandin A.R., & Porporato M. (2007). Corporate bankruptcy prediction models applied to emerging economies: Evidence from Argentina in the years 1991-1998. International Journal of Commerce and Management, 17(4), 295-311.
Schmuck M. (2013). Financial distress and corporate turnaround: an empirical analysis of the automotive supplier industry. Wiesbaden: Springer Fachmedien Wiesbaden.
Sciarelli S. (1995). La crisi d’impresa. Il percorso economico della crisi aziendale. Padua: Cedam.
Scott J. (1981). The probablity of bankruptcy. A Comparison of Empirical Predictions and Theoretical Models. Journal of Banking and Finance, 5 (3), 317-344.
Shepherd D.A. (2005). The theoretical basis for my plenary speech about our successes and failures at research on business failure. Invited paper. Proceedings: Regional Frontiers of Entrepreneurial Research, Brisbane, 123-134
Sheppard J.P., & Chowdhury S.D. (2005). Riding the wrong wave: organisational failure as a failed turnaround. Long Range Planning, 38, 239-260.
Shin K., & Lee Y. (2002). A genetic algorithm application in bankruptcy prediction modelling. Expert Systems with Applications, 23(3), 321-328. Slatter S., & Lovett D. (1999). Corporate recovery: managing companies in distress. Washington D.C.: Beard Books.
Smith F.R. (1930). A Test Analysis of Unsuccessful Industry Companies. Bureau of Business Research, Bulletin nr. 31. Urbana: University of Illinois. Smith F.R., Winakor A.H. (1935). Changes in Financial Structure of Unsuccessful Corporations. Bureau of Business Research. Bulletin nr. 51. Urbana: University of Illinois.
Taffler R. (1982). Forecasting company failure in the UK using discriminant analysis and financial ratio data. Journal of the Royal Statistical Society, 145(3), 342-358.
Tennyson M., Ingram R., & Dugan M. (1990). Assessing the information content of narrative disclosures in explaining bankruptcy. Journal of Business Finance & Accounting, 17(3), 390-410.
Teodori C. (1989). Modelli di previsione nell’analisi economico-aziendale. Turin: Giappichelli.
Varetto F. (1998). Genetic Algorithms Applications in the Analysis of Insolvency Risk. Journal of Banking and Finance, 22(10-11), 1421-1439. Wall A. (1936). How to evaluate financial statements. New York: Harper. Warner, J. (1977). Bankruptcy costs: some evidence. Journal of Finance, 32(2), 337-347.
Weitzel W.F., & Jonsson E. (1989). Decline in organisations: a literature integration and extension. Administrative Science Quarterly, 34(1), 91-109. West R.C. (1985). A factor-analytic approach to bank condition. Journal of Banking and Finance, 9(2), 253-266.
Wu Y., Gaunt C., & Gray S. (2010). A comparison of alternative bankruptcy prediction models. Journal of Contemporary Accounting & Economics, 6(1), 34-45.
Zavgren C.V. (1983). The prediction of corporate failure: the state of the art. Journal of Accounting Literature, 2, 1-38.
Zmijewski M.E. (1984). Methodological issues related to the estimation of financial distress prediction models. Journal of Accounting Research, 22, 59-82.